

Weighted Price Action
This indicator counts the number of times eight different price action events occur in the last p bars. It then gives more weight to recent price action events and less to earlier price action events.
The price action events it counts are:
- close > open
- high > previous high
- low > previous low
- close is in top half of candles range
- close < open
- high < previous high
- low < previous low
- close is in bottom half of candles range
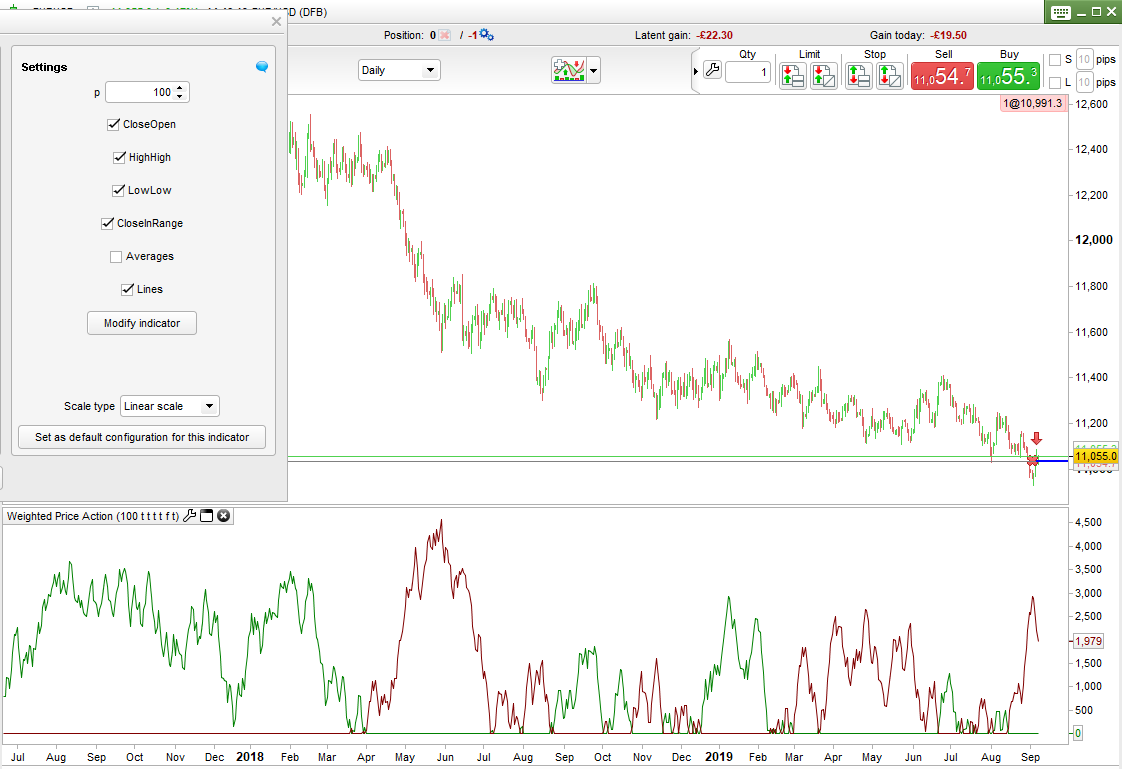
Two lines are drawn. The green line represents weighted upward price action and the red line weighted downwards price action. The lines are drawn from a datum of whichever line has the lowest value so that is can easily be seen which type of price action has been most dominant recently.
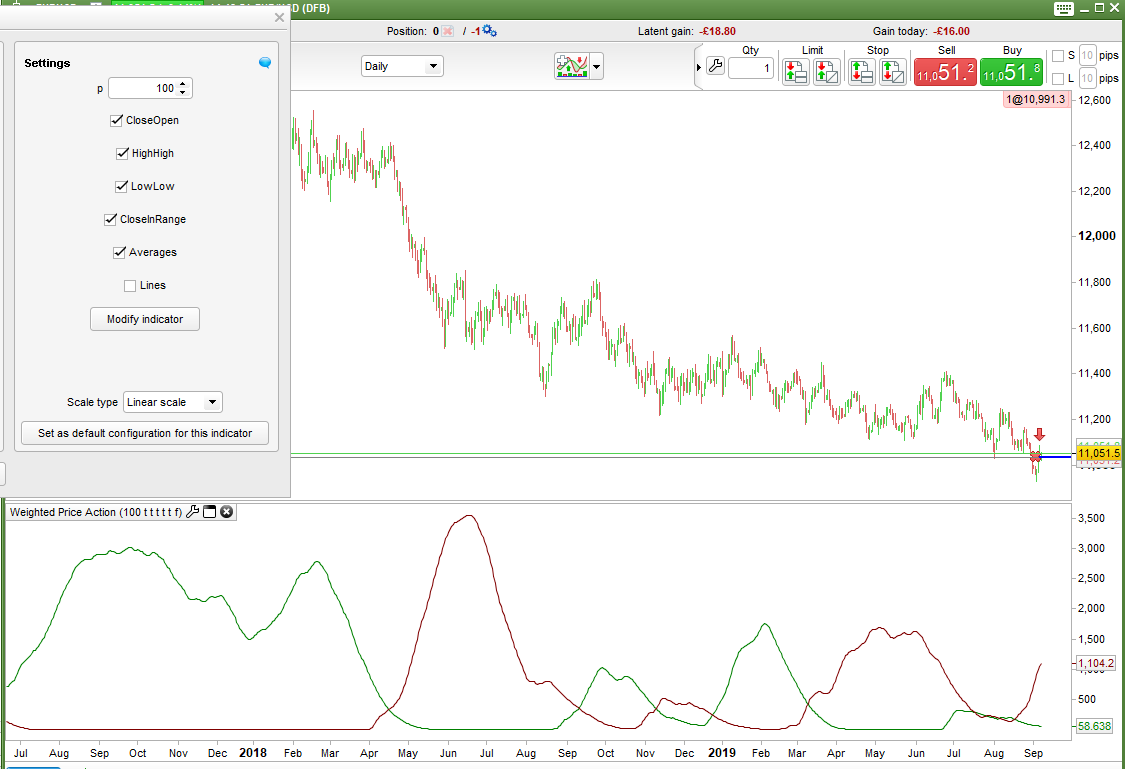
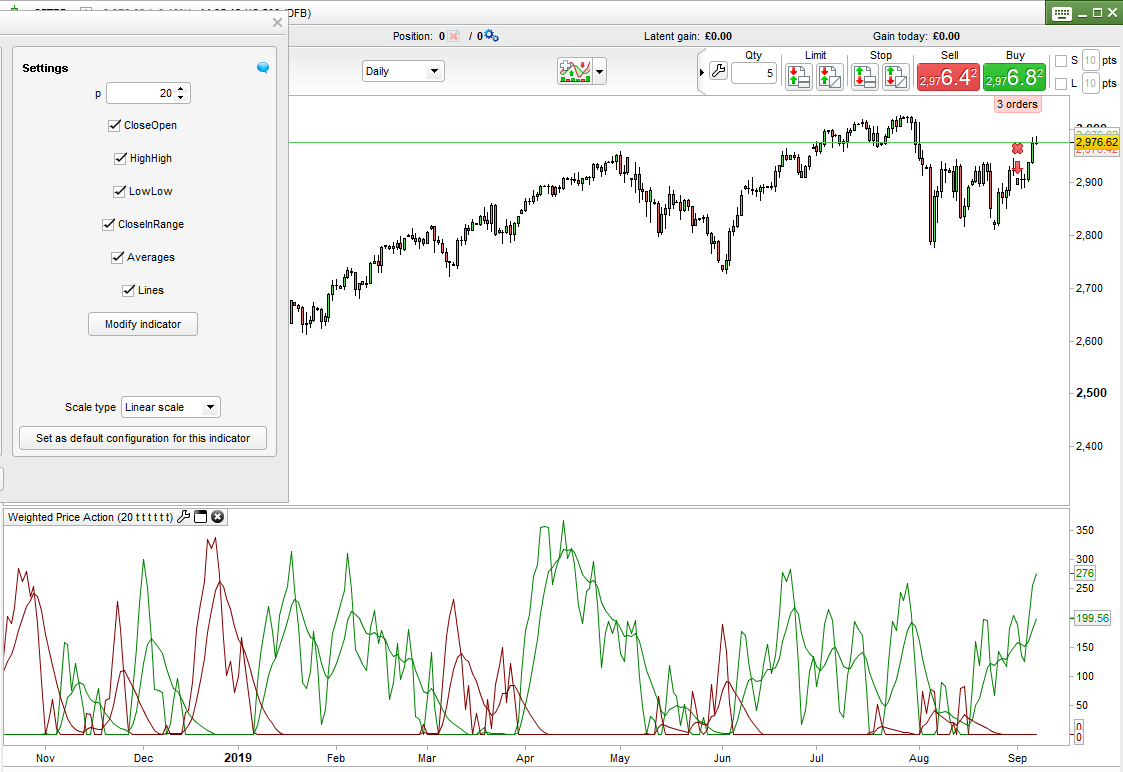
Weighted average lines with a period of half p can also be drawn. These smooth out the indicator returns but also add some lag.
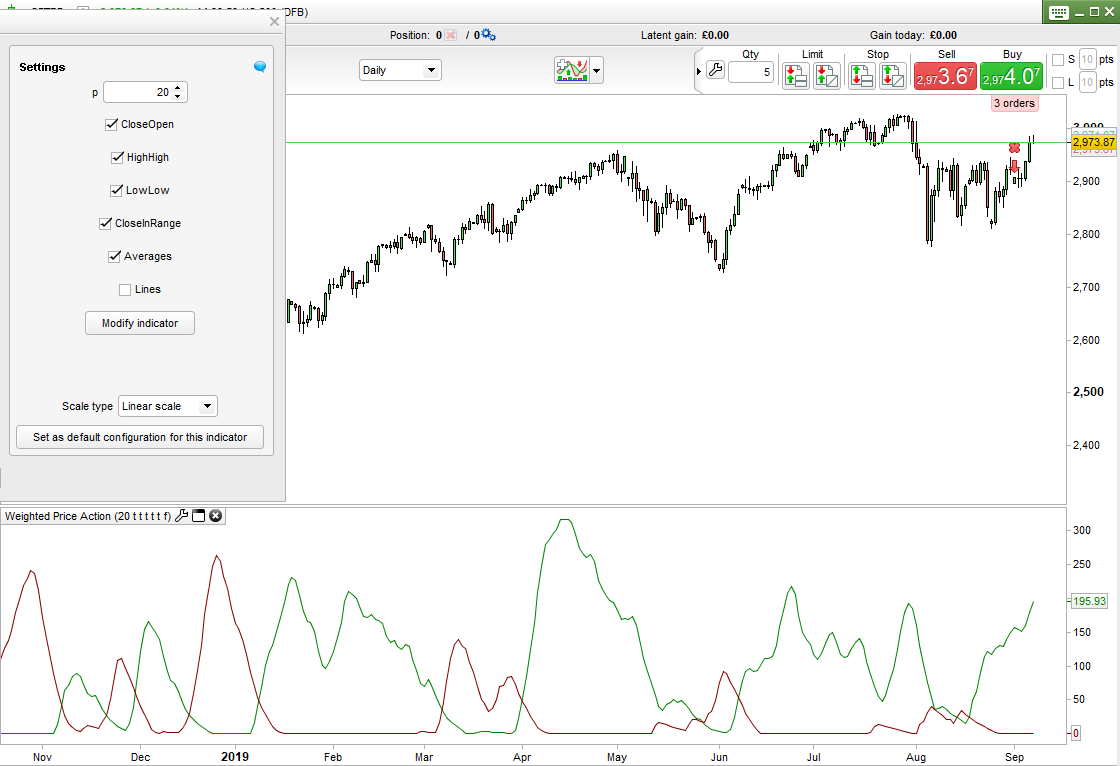
You can choose which of the two lines are displayed by ticking or un-ticking ‘Lines’ and ‘Averages’ in the indicator window.
It is also possible to remove any of the price action events from the calculation by ticking or not the relevant box.
If the green average line is rising from zero then it indicates an increase in recent long price action and bulls have been on top of bears. If it starts falling then the bulls are losing control.
If the red average line is rising from zero then it indicates an increase in recent short price action and bears have been on top of bulls. If it starts falling then the bears are losing control.
As with all my indicators I advise downloading and importing the ITF file to get full functionality.
//Weighted Price Action
//By Vonasi
//20190906

defparam calculateonlastbars = 1000

//closeopen = 1
//highhigh = 1
//lowlow = 1
//closeinrange = 1
//Averages = 1

a = (close > open)
b = (high > high[1])
c = (low > low[1])
d = ((close-low)/(high-low) > 0.5)

e = (close < open)
f = (high < high[1])
g = (low < low[1])
i = ((close-low)/(high-low) < 0.5)

up = 0
down = 0

for j = 0 to p-1
if closeopen then
if a[j] then
up = up + (p-j)
endif
if e[j] then
down = down + (p-j)
endif
endif

if highhigh then
if b[j] then
up = up + (p-j)
endif
if f[j] then
down = down + (p-j)
endif
endif


if lowlow then
if c[j] then
up = up + (p-j)
endif
if g[j] then
down = down + (p-j)
endif
endif

if closeinrange then
if d[j] then
up = up + (p-j)
endif
if i[j] then
down = down + (p-j)
endif
endif
next

upres = (up - min(up,down))
downres = (down - min(up,down))
upave = weightedaverage[p/2](upres)
downave = weightedaverage[p/2](downres)

if averages then
upave = upave
downave = downave
else
upave = undefined
downave = undefined
endif

if lines then
upres2 = upres
downres2 = downres
else
upres2 = undefined
downres2 = undefined
endif

return upres2 coloured(0,128,0) as "long", downres2 coloured(128,0,0) as "short", upave coloured(0,128,0) as "long average", downave coloured(128,0,0) as "short average"
