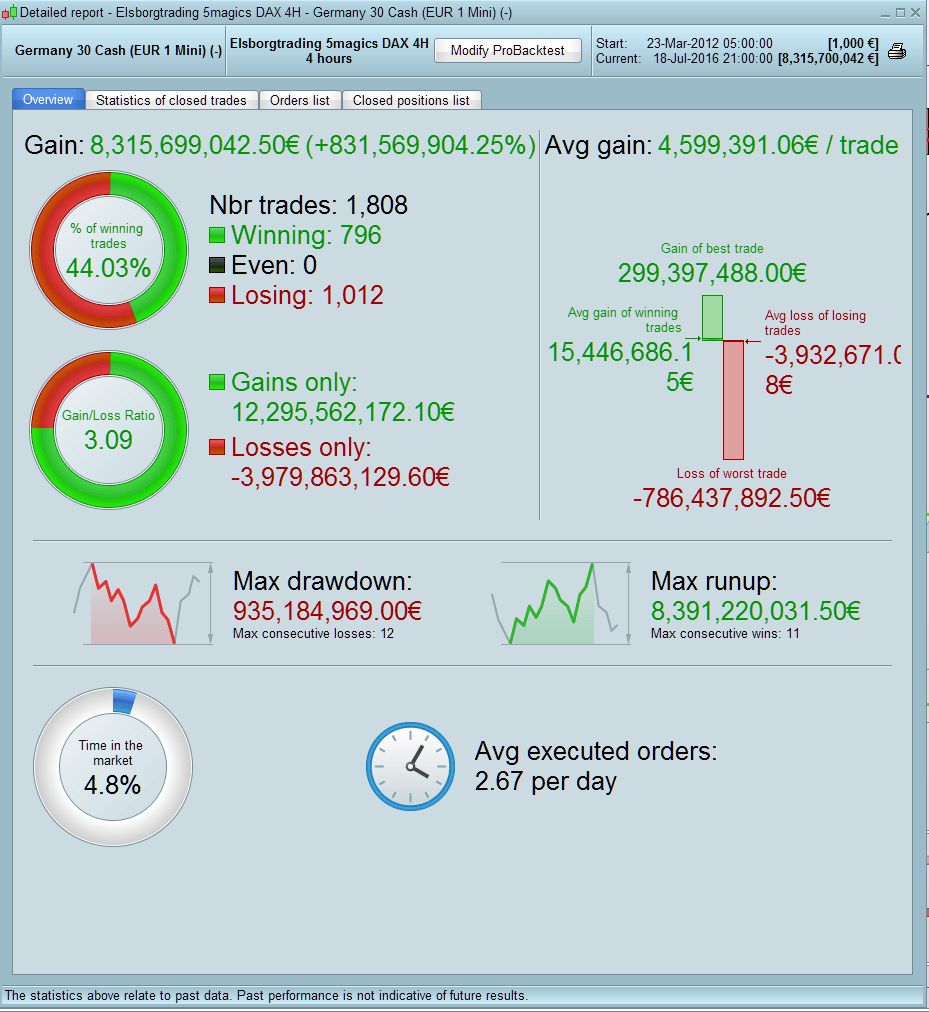
..was not so holy after all. It backtested like there was no tommorow, but failed utterly in a live test, and I tell you why.
First look at the numbers in the backtest it’s insane and somehow unrealistic, as the last 2 winning trade is with around 8.4 mill contracts, the backtest generated 8.315 billion euros from mar. 2012 until today. But the main thing is that it’s done on a 4Hour time frame, and when back testing, it does not take into consideration the real price action with in the 4 hours time frame, only the high/low open and close. so if you were to buy and the candlestick is a 4 hour bearish you will lose only the SL at 8 i put in there, but when it’s bullish, you will win the 37 points I put in there – at least that is my theory. It does not take in to consideration how the real price moved in that 4 hour time frame. So even with a SL at 8 points I’m winning at a time frame at 4Hours with in a bullish candle.
So in sure that some of you already knew that, but just to my confirmation- am I right here on the back testing issue?
Further if I still what to code some condition in a 4H time frame but at the same time have some condition in another time frame, can this be done?
Br. Elsborgtrading
Hi – Unfortunately you are correct, the backtesting engine is not entirely accurate. If you have the possibility of a profit in a bar then it will show a profit – regardless of whether the actual real tick movements would have closed you out at your stop level resulting in a loss. This is a well known issue in backtesting and we are informed that it should be fixed in the next version of PRT (fingers crossed). Only way to avoid so called false positives at the moment is run the strategy on the smallest timeframe possible and/or code it such that a close can never be in the same bar as the entry. Also, look out for the results that are shown with 0 bars and basically ignore those to be on the safe side.
As for your other point, I believe the ability to run the strategy on one timeframe but have the conditions look at another timeframe will also be available in the next release. You can kind of do this at the moment within the coding in certain strategies but its kind of messy.
Hi Manel, and thanks for clarifying things for me. I will be looking forward to the new release
thanks for pointing this out Elsborgtrading. I have just started backtesting and getting good results however I knew it would be different live, you’ve just confirmed it.
Hi cusack. The problem with zero bar trades should be solved in prt 10.3 withthe tick-by-tick test so it would produce more realistic back test results. You can also look in the trade statisticks and see how many bars trades are in. 0 bars is the problem
Great thanks. I’ll look out for those 0 bars while I wait for IG to release 10.3
The demo account shoud be 10.3 by now. (?)
real IG accounts will get 10.3 in the next few days. It’s already the case for French ones (first country to get it).
 Bel
BelParticipant
Veteran
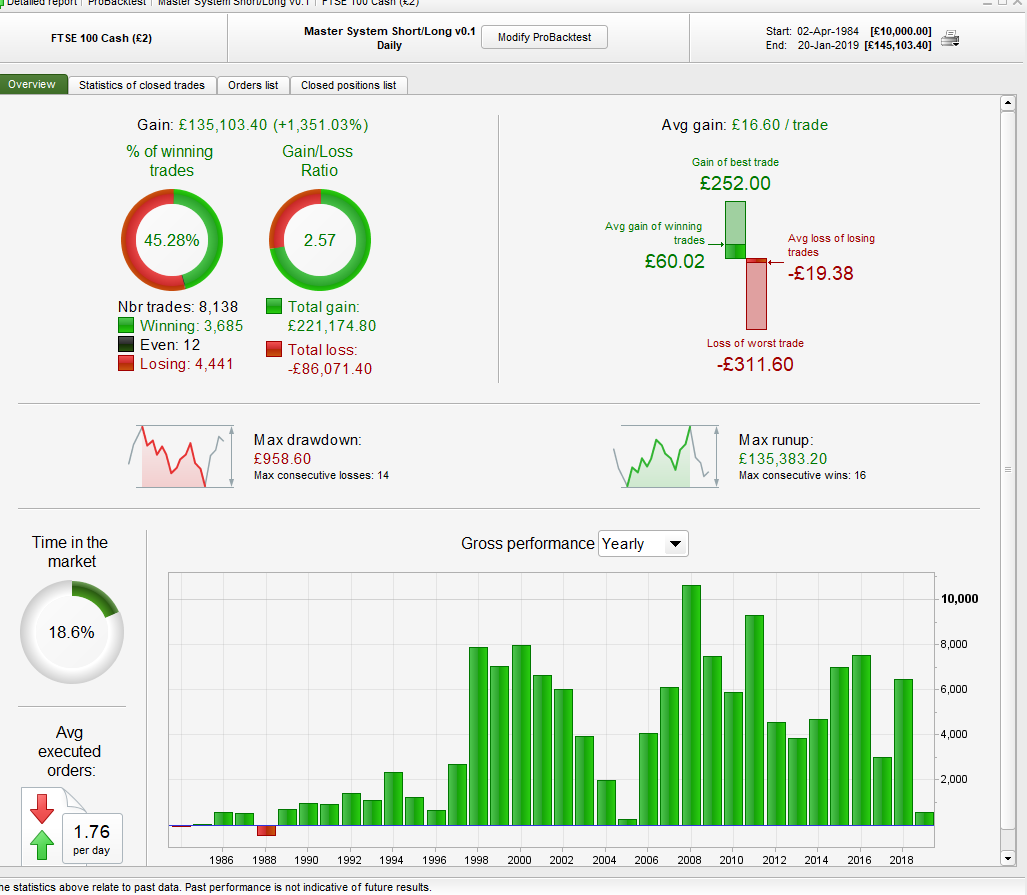
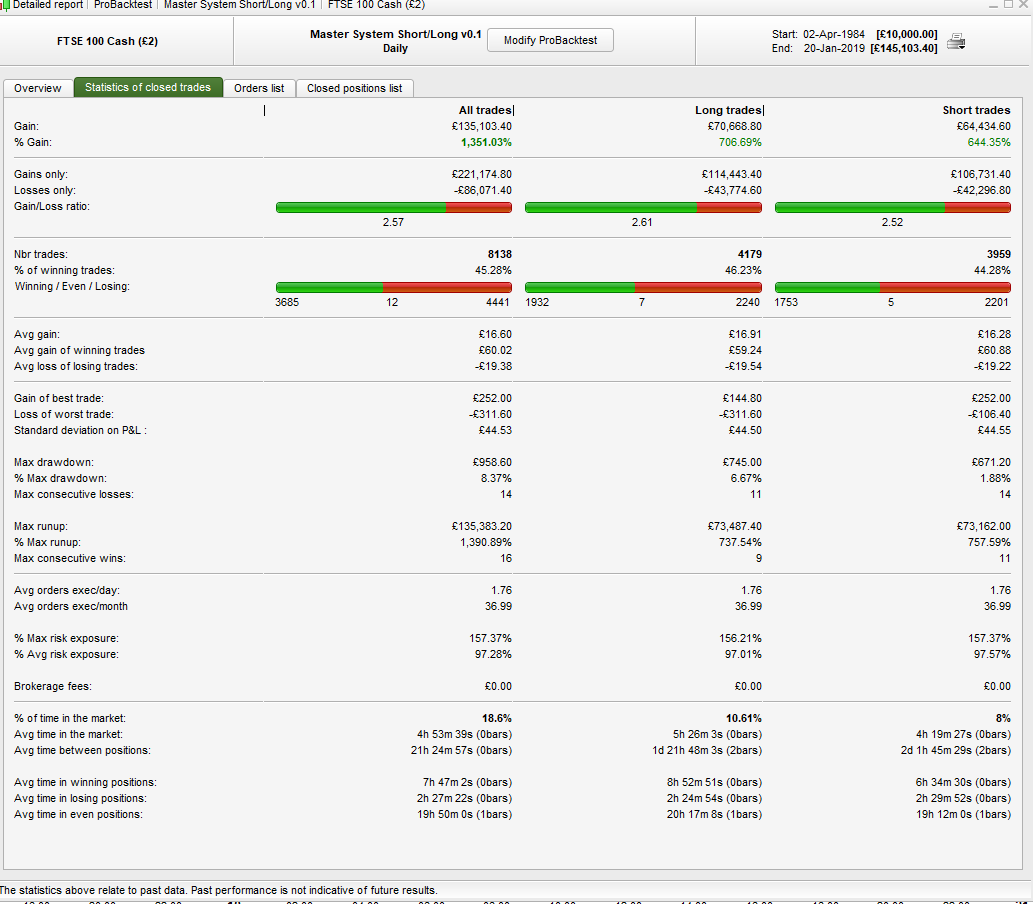
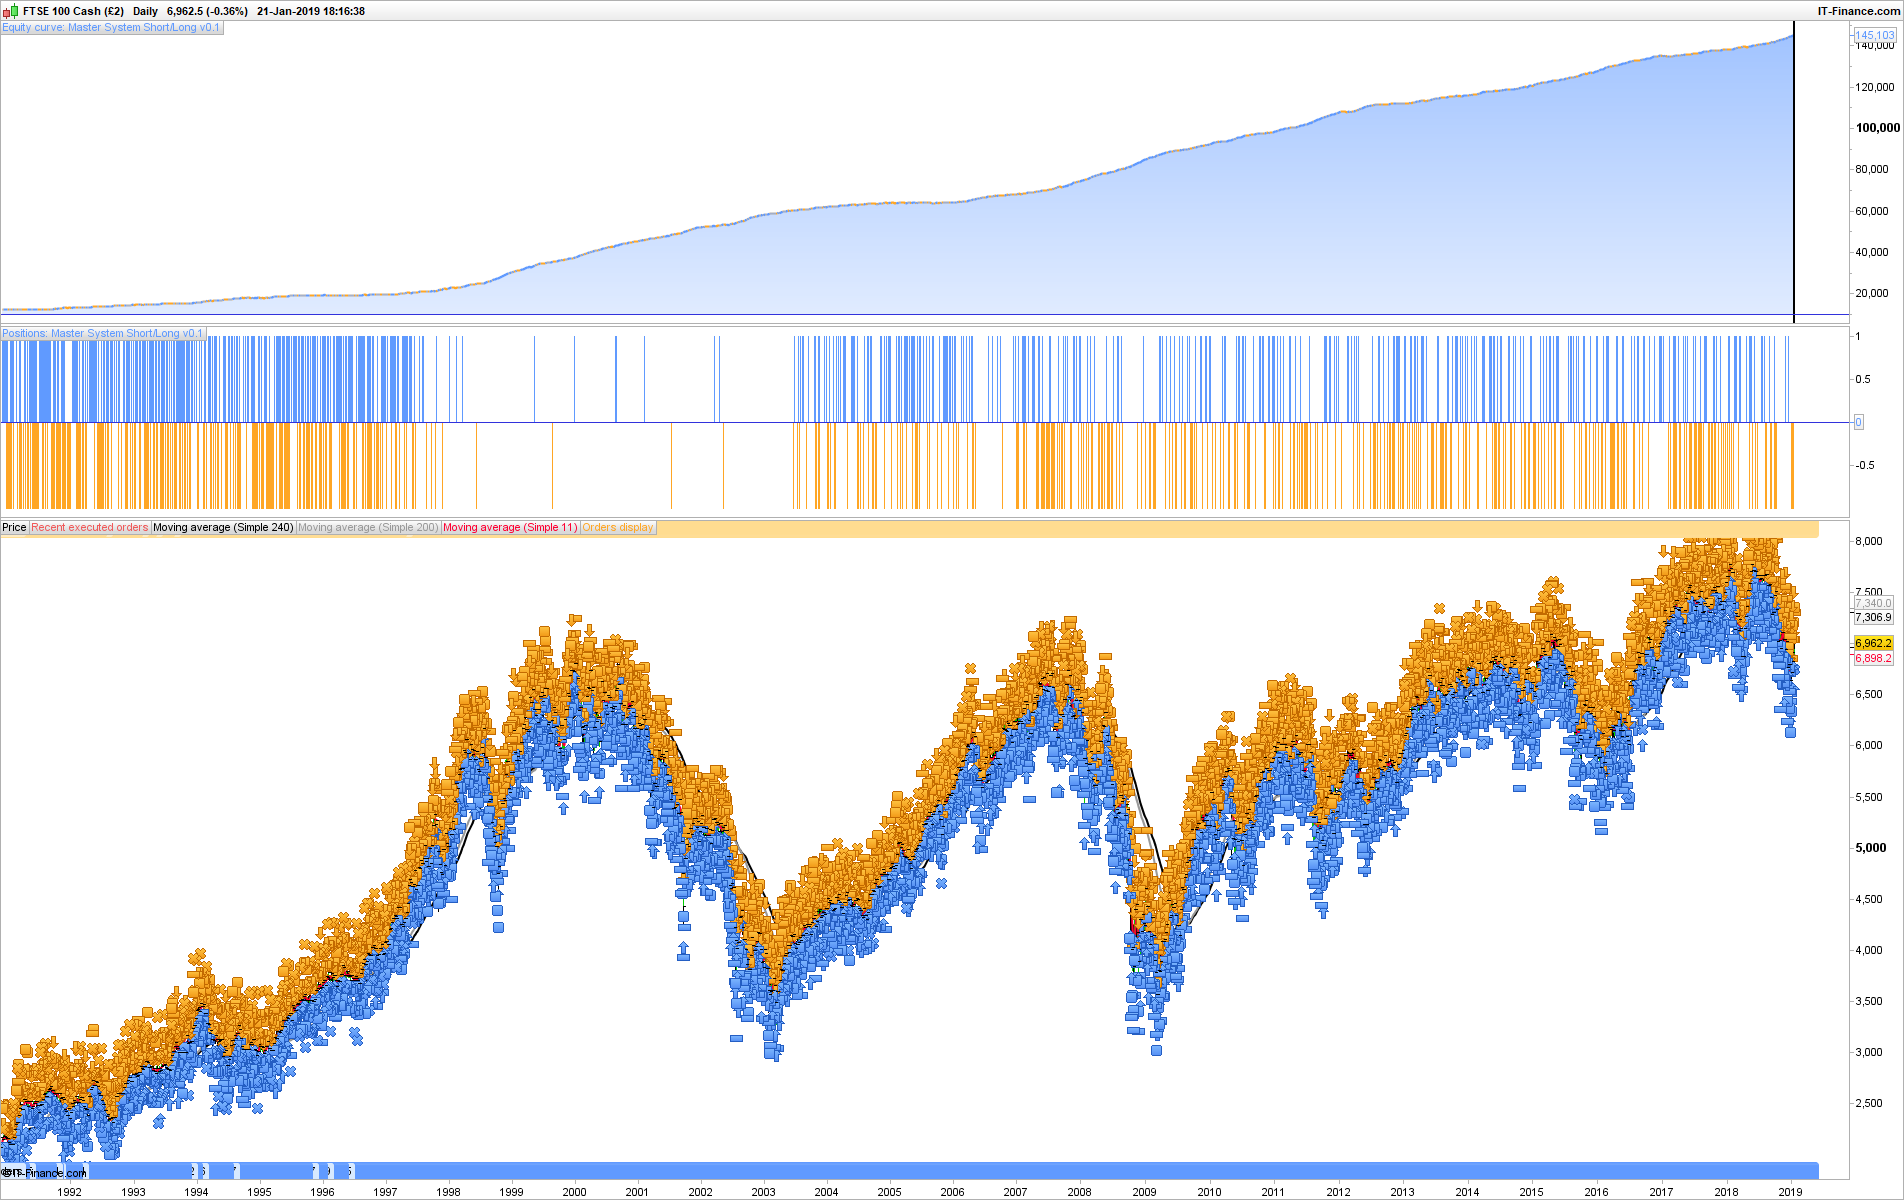
Sorry to bump old thread but I’m getting the same issue in current PRT 10.3 Get unrealistic results with trailing stop, and also 10pt stop and 40pt target as example. I’ve coded a daily system so it enters once daily bar closes and exits at either the stop or target. It says 0bars as well. I’m attaching a few screenshots and hope somebody can comment. Looking forward to a healthy discussion:)
Regards.
Bel – have you ticked the box to use tick by tick data?
BelParticipant
Veteran
I’m trying with the ticked box now but get only 1 year of data 2011 and nothing more…Will try another FTSE contract and see whats up….Tick by tick data should solve the issue i believe?
BelParticipant
Veteran
Ok seems its working now, so doing some testing. Would like to know if once the tick-by-tick box is ticked, does the optimization run with this or standard?
BelParticipant
Veteran
Ok seems its working now, so doing some testing. Would like to know if once the tick-by-tick box is ticked, does the optimization run with this or standard?
Found out its running standard optimization without tick-by-tick, so will run tests and then come back and share results. Thank you Vonasi.
Found out its running standard optimization without tick-by-tick
Optimisation runs without tick by tick (else it would take too long) but it tells you in the Tick by Tick column how many instances of 0 / zero bars there have been for that set of results in that row.
When you click on any row of results to show them on a Chart then the tick by tick engine kicks in and computes the results INCLUDING tick by tick.
Above also happens when the first row of results flip over into a chart when optimisation finishes running.
Hope above makes sense, if not just say.
BelParticipant
Veteran
Yup, makes complete sense GraHal. Appreciate the support and help received. Thank you.