Bullish and Bearish Forex Screeners (based on 3 indicators)

Bullish and Bearish Forex Screeners (based on 3 indicators)

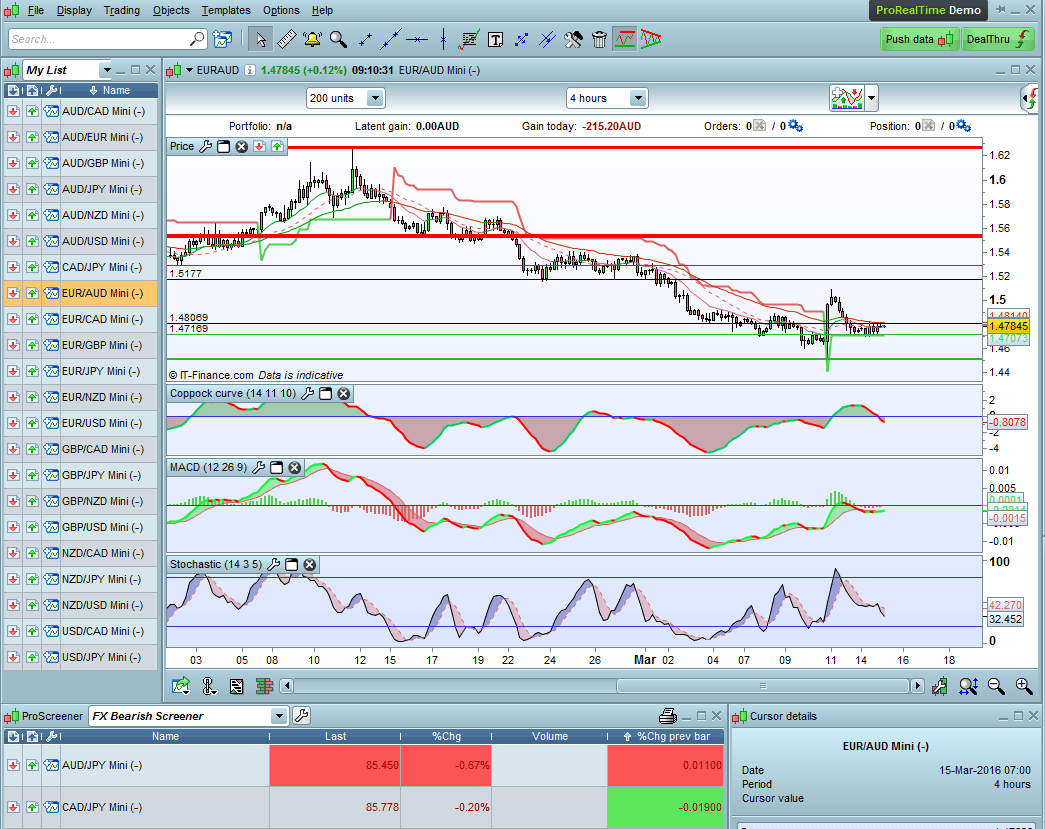
These is a very effective screeners that will form the basis of an automatic system.  I have been using them for about 5 years with great success.


Forex Bearish Screener:

Forex Bullish Screener:


To set it up you will need a new indicator I call “MGC-Coppock” as PRT does not offer the Coppock as such.  The code is:


I have uploaded both screeners in .itf format that can be imported straight into your PRT.

Please note that these screeners can also be used for stocks and indices.

Remember to limit the size of the scan by having them only scanning your list of preferred instruments e.g. top 200 stocks, or high volatility Forex pairs.

Share this

Risk disclosure:

No information on this site is investment advice or a solicitation to buy or sell any financial instrument. Past performance is not indicative of future results. Trading may expose you to risk of loss greater than your deposits and is only suitable for experienced investors who have sufficient financial means to bear such risk.

ProRealTime ITF files and other attachments : How to import ITF files into ProRealTime platform?

PRC is also on YouTube, subscribe to our channel for exclusive content and tutorials

  1. Nicolas • 03/15/2016 #

    Hello Mike and thanks a lot for your precious contribution!

  2. Sofitech • 03/15/2016 #

    Hello Mike. You’re screener are very interesting. I can see they are made to work on H4 timeframe. To take position, do you zoom into smaller timeframe and search for entries going the same way your screener indicate in H4 ? Based on the same indicators ?

  3. MikeGC • 03/15/2016 #

    Hello Sofitech, I use these screeners to minimise the time looking for trades in FX.  Before I take a trade on the H4 chart, I check the D1 and the H1 and see whether the trend is in favour.  They can give signals that could become reversals, but that is a risky trade without looking at the price action.  Also it is probably better to wait for the candle to close on the H4.  The benefits are that the confluence of 3 indicators should provide a lesser risk as you would know, trading the Ichimoku.
    Hope this helps.
    Best regards,
    Mike

  4. Sofitech • 03/15/2016 #

    Thanks for your answer. I will have a look on your screener results soon. But i like the logic of it.  As you say in another post, the stop or trailing stop is the key… 
    Hope for you this forum and Nicolas will help you to improve your system and maybe to find a way to make it autotrade.
    Regards.

  5. MikeGC • 03/15/2016 #

    Thanks, Sofitech.  Nicolas is working on it now.  It is a bit tricky, there being so much visual input.  Am considering a trend indicator on the D1 such as Zig-Zag.  In fact the NZDJPY  D1 is now 14 days into a new uptrend with the H4 showing  bullish – it may be worth a look. 

  6. Doctrading • 03/15/2016 #

    Hello Sir,
    Nice system, thanks for sharing.
    Maybe we could try to automate this strategy. For example, if all the conditions are met, we could set an automatic order of buying / selling, with stop loss and take profit (I personally like using ATR for this ; we can also code the “last swing high / low”, but it’s a bit difficult).
    Greetings,

  7. MikeGC • 03/15/2016 #

    Hello Doctrading,
    Nicolas has written some really elegant code for me that works well, but I find that there are other factors that need to be taken into account when setting a trade based on the screeners.  You may have noticed that not every screened pair is necessarily a good trade.   The two main problems are:

     The direction of the trend.  I am trialing Zig Zag as a source of this information, and find it reasonably reliable.
     Coding the trailing stop loss cum exit.   

    Zig Zag may be able to provide a good swing high/low.  However I have noticed that it can sometimes change when the trend shifts from a short term reversal back to the longer-term trend.
    I think that a multiple of the ATR might be the answer.
    Or a choice of the tighter of the two.
    With the exit, I have been using the Super Trend as a stop loss.  After the ST flips over, it is wonderful for a long trending trade.  I have experienced some great trades with this.  The longest was for 195 days on an AUDUSD short in September 2014.  It made 1388 pips.

    Thanks for your interest in this.  I have been using the system and some variants for years with good success.  However, I would appreciate your suggestions, comments and insights.  I am planning to build the above factors into the code and if they test successfully, then I will post it with Nicolas’ permission.
    Good trading,
    Mike

  8. Tradingsales • 03/15/2016 #

    Hi Mike ,
    im having problems getting the indicator coding i keep getting :
     Syntax error:The following variable is undefined: maThe following variable is undefined: roc1The following variable is undefined: roc
    apologies if i’m being naive but any advice would be greatly appreciated.

  9. MikeGC • 03/15/2016 #

    Hello Tradingsales,
    The reason for your error messages is probable because the screeners call for the indicator MGC-Coppock.  I created this at the time when PRT didn’t offer a Coppock.  Thus you now have two options:

     set up the MGC-Coppock indicator as described above:   To set it up you will need a new indicator I call “MGC-Coppock” as PRT does not offer the Coppock as such.  The code is:  RETURN WEIGHTEDAVERAGE[MA](ROC[roc1] +ROC[roc2]) AS \"Coppock Indicator\" or
    download the PRT indicator Coppock Curve and change the screeners’ codes accordingly.

    Let me know how you get on.
    Cheers,  Mike

  10. sourberry • 03/15/2016 #

    RETURN WEIGHTEDAVERAGE[MA](ROC[roc1] +ROC[roc2]) AS “Coppock Indicator”

    This code alone as indicator does not work.

    The PRT indicator Coppock Curve as different parameters and does not work with CALL “MGC-Coppock”[14, 11, 10](close)

    Cannot use both your screener.

  11. Toto le Heros • 03/15/2016 #

    Hi Mike,
    Hope you will get this message as this interresting stuff was posted some time ago…
    Coopock curve is generally described as a 10-weighted average of 14ROC + 11 ROC… Looks like you are using 14-weighted average of 11ROC + 10 ROC… My mistake ? Or done intentionnaly by yourself ?
    Moreover you are saying : “Nicolas has written some really elegant code for me that works well…” but I cannot find that piece of code on ProRealCode ? Maybe Nicolas can help on this as well.
    Many thanks again for this very interresting idea.
    BR,

avatar
Register or

Likes

avatar avatar avatar avatar avatar avatar avatar avatar avatar avatar avatar avatar avatar avatar avatar avatar

+7 more likes

Related users ' posts
Stephane0174 Bonjour et merci pour le Screener. Je suis nouveau ici et je ne connais rien en programmati...
Nicolas Je pense que c'est le copier/coller des guillemets qui pose problème, il faudrait les retape...
enriquem
3 years ago
bab el franco hello once installed I have no results despite different options of markets or temporality
Vinks_o_7
3 years ago
3 Bars LONG
3 Bars LONG
3
Screeners
Maxime Csls Hello Vinks_o_7 Thank You for your work. I am working on a different candle setup. Your wor...
Vinks_o_7 Hi Maxime This is a momentum strategy that I use for swing trading (couple of day, weeks). ...
haimpinto Thank you for the code How can I use it for a short trend?
Sofitech le screener "resserrement" (le premier) correspond aux flèches rouge / vertes sur l'image ?
JC_Bywan Bonjour, non les flèches sur l'image correspondent aux croisements des ema15/ema60, 2e screener
jc_aries Thanks for the SCREENER. I have a doubt. Is it not necessary to put a time interval for the ...
BoutDePain Here is the updated screener with variables that are more understandable:
BoutDePain https://www.prorealcode.com/topic/three-line-breakouts/#post-155918
haimpinto Hi What should be added in the code in order to limit the price range of the shares it disp...
StephFor //ind1 = ZigZagPoint[2*averagetruerange[200]](close) avr = 3 //3% ind1 = ZigZag[avr](close...
Manu L. @Steph un grand merci pour ton aide mais :-( J'ai copier le code tel quel mais cependant j...
AlphaMauss Je n'ai pas réussi à faire fonctionner l'indicateur avec le code fourni en commentaire sur P...
Fozzie Très bon code, merci pour le travail.
Titi Gone Très bon travail merci
Mike.44 Hello Merci beaucoup pour le code !
smarttrader1 hi, can you improve on this ? can you make this flag screeener for day trading, I want to be...
Nicolas Please open a new topic in the proscreener forum for this specific query. Please provide exp...
NHGambler Nice screener. Only thing is I wonder if this is aimed more at small/medium/large caps? I ...
jonny.cash the chikou is 26 periods behind current price, it's not the close
Nicolas Chikou is the current Close decayed 26 periods in the past of the chart.
jonny.cash yes, thanks for the correction. my post was complete rubbish
mickey992 salut merci pour ton partage et ton travaille
patapouf Hi Vivien René I just discovered your “Ordered trend-following stocks Screener”. Great work...
yeoreum Thank you very much for the screener, it reminds me on Minervini VCP. How to change th...
reecet any codes like this but in minutes and hours rather than days?
PHAN100 bonjour, je viens de tester ce screener, je constate une anomalie...il ne renvoie pas l'e...
bibifricotin Je pense avoir compris dans la première colonne exemple 92 le 9 indique la période et le 2 ...
Leo_da_Pisa It seems to work very well. Good for confirmation. Thanks for sharing Vivien.
jaginho Bonjour Vivien, je n'arrive pas à comprendre ce screener... En tout cas merci pour tes contr...
avatar
Anonymous Superb, merci!
Oxxoz Re bonjour Vivien, Il me smeble que 3 mois, c'est 60 séances. Cordialement,
Vinks_o_7 thanks ...and It can be used on a monthly and weekly basis by changing just the duration in ...

Top