

T3 daytrader Coral
March 18, 2016, 3:19 PM
Indicators
3 Comments
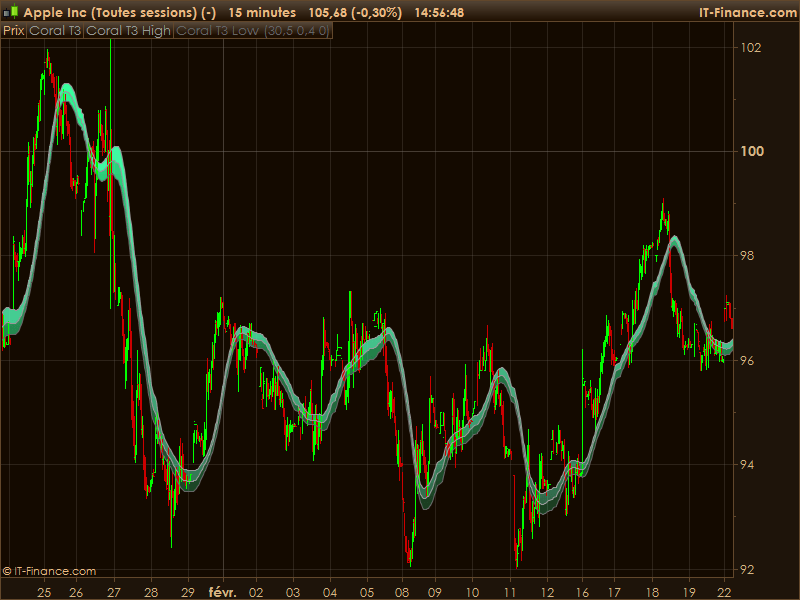
Indicator from the Kevins archive, seems made with different kind of exponential moving average with different calculation over time and coefficient. Quite looking good on intraday chart for trend filtering. I didnt play enough with the parameters to get a better idea but it seems ok to post here in the library. Dont really know from where came the code ..
//********************Required Variables
//
// Period    float  30.5
// Hot    float  .4
// shift 0
// This code is used at your own risk. It was written by one of our members, Andy Thomas so thanks to him for providing it //
//
//**********************
e1 = ExponentialAverage[Period](close)
e2 = ExponentialAverage[Period](e1)
e3 = ExponentialAverage[Period](e2)
e4 = ExponentialAverage[Period](e3)
e5 = ExponentialAverage[Period](e4)
e6= ExponentialAverage[Period](e5)

b = Hot
b2 = b * b
b3 =  b * b * b

c1 = -(b * b * b)
c2 = 3 * b2 + 3 * b3
c3 = -6 * b2 - 3 * b - 3 * b3
c4 = 1 + 3 *  b  + b3 + 3 * b2


ret = c1 * e6 + c2 * e5 + c3 * e4 + c4 * e3
////////////////////////
he1 = ExponentialAverage[Period](high)
he2 = ExponentialAverage[Period](he1)
he3 = ExponentialAverage[Period](he2)
he4 = ExponentialAverage[Period](he3)
he5 = ExponentialAverage[Period](he4)
he6= ExponentialAverage[Period](he5)

hb = Hot
hb2 = hb *hb
hb3 =  hb * hb * hb

hc1 = -(hb * hb * hb)
hc2 = 3 * hb2 + 3 * hb3
hc3 = -6 * hb2 - 3 * hb - 3 * hb3
hc4 = 1 + 3 *  hb  + hb3 + 3 * hb2

hret = hc1 * he6 + hc2 * he5 + hc3 * he4 + hc4 * he3
//////////////////
le1 = ExponentialAverage[Period](low)
le2 = ExponentialAverage[Period](le1)
le3 = ExponentialAverage[Period](le2)
le4 = ExponentialAverage[Period](le3)
le5 = ExponentialAverage[Period](le4)
le6= ExponentialAverage[Period](le5)

lb = Hot
lb2 = lb * lb
lb3 =  lb * lb * lb

lc1 = -(lb * lb * lb)
lc2 = 3 * lb2 + 3 * lb3
lc3 = -6 * lb2 - 3 * lb - 3 * lb3
lc4 = 1 + 3 *  lb  + lb3 + 3 * lb2


lret = lc1 * le6 + lc2 * le5 + lc3 * le4 + lc4 * le3


return ret[shift] as "Coral T3",hret AS "Coral T3 High",lret AS "Coral T3 Low"
Download
Filename:
Kevins-DayTrader-Coral.itf
Downloads:
211
Junior
I like scalping SPY, Nature and watch scifi movies :)
Author’s Profile
Loading...