

Normalized Candlesticks (stochastic candles)
October 25, 2016, 4:33 PM
Indicators
3 Comments
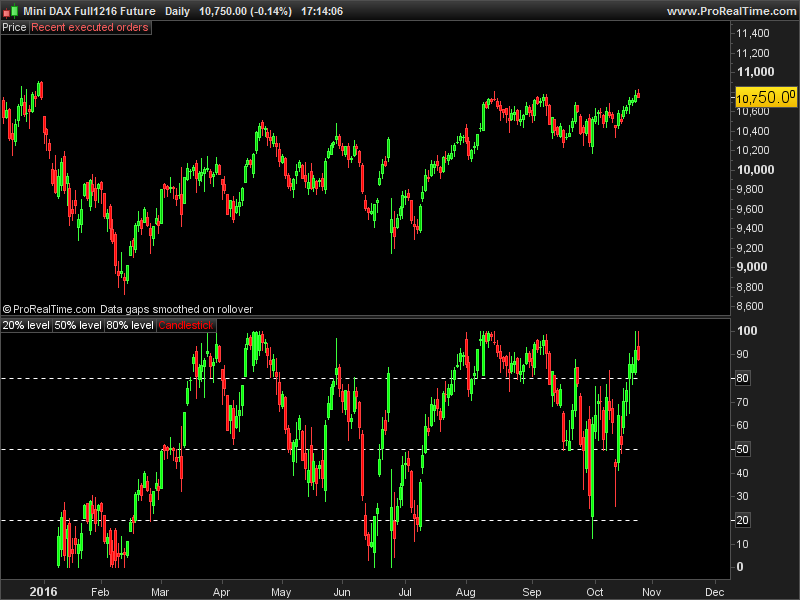
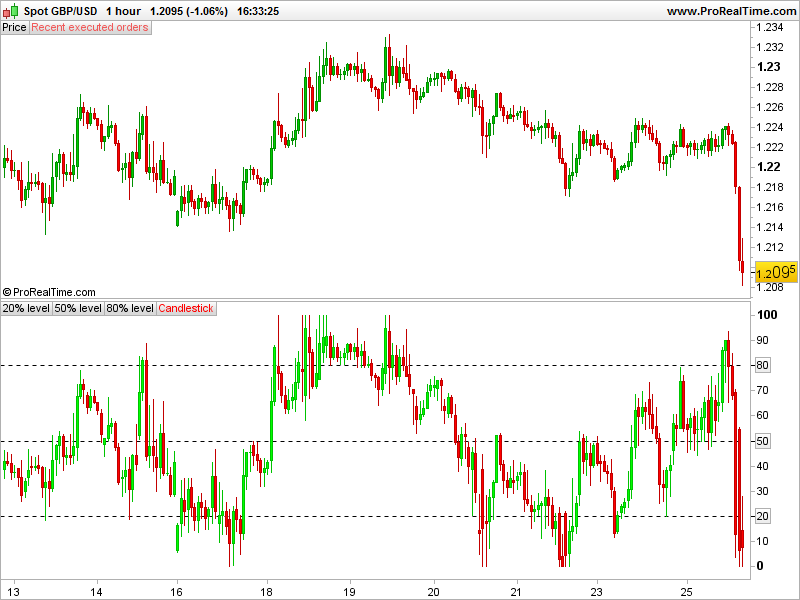
This indicator is a normalized price representation made with candlesticks. The dynamic scale between 0 and 100% is calculated upon the last X periods (50 periods in the code, you can change it at will). It can be used to detect price exhaustion in a trend of continuation if the candlesticks remains above the 50% level.
Another utility is the use of the different levels that could be changed to Fibonacci levels for examples (23.6% 38.2% etc.) and detect rebounds of breakout of these levels.
PRT 10.3 compatible only because of the use of the DRAWCANDLE function.
Coded by request on the French forum (french video that explain the development process of the normalized candlesticks).
//PRC_CandlesticksStochastic | indicator
//25.10.2016
//Nicolas @ www.prorealcode.com
//Sharing ProRealTime knowledge

period = 50

//lastest highhest high and lowest low over "period"
hh = highest[period](high)
ll = lowest[period](low)
scale = hh-ll

//dynamic OHLC (percentile rank)
dynO = ((open-ll)/scale)*100
dynH = ((high-ll)/scale)*100
dynL = ((low-ll)/scale)*100
dynC = ((close-ll)/scale)*100

//candle color
if open>close then
 r = 255
 g = 0
else
 r = 0
 g = 255
endif

//draw candlesticks
DRAWCANDLE(dynO,dynH,dynL,dynC) coloured(r,g,0)// BORDERCOLOR(0,0,0)

return 20 as "20% level", 50 as "50% level", 80 as "80% level"
Download
Filename:
PRC_CandlesticksStochastic.itf
Downloads:
198
Download
Filename:
candlesticks-stochastic.png
Downloads:
60
Master
I created ProRealCode because I believe in the power of shared knowledge. I spend my time coding new tools and helping members solve complex problems.
If you are stuck on a code or need a fresh perspective on a strategy, I am always willing to help. Welcome to the community!
Author’s Profile
Loading...