







Fibonacci pivot points
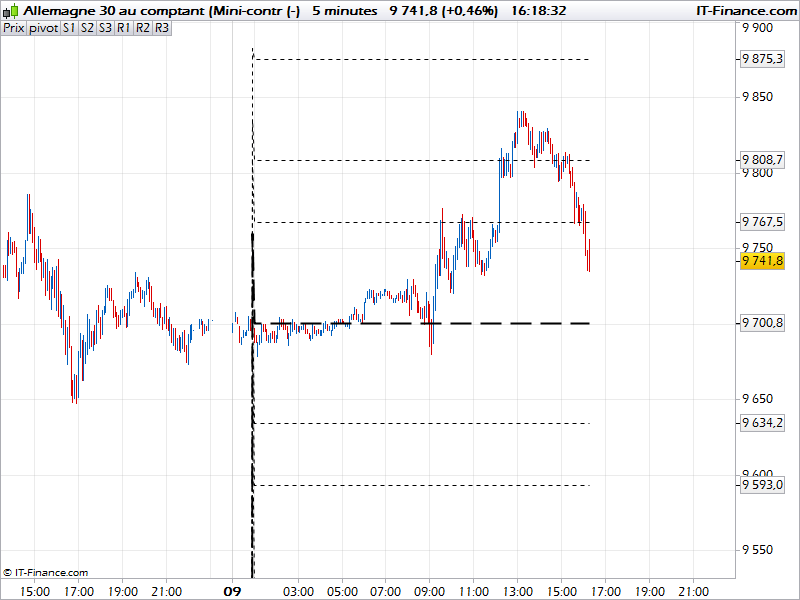
The Fibonacci pivot points indicator is made of 38.2% and 61.8% extension of the main pivot line, for the support (S1,S2) and resistance (R1, R2) ones. This indicator show only the pivot points on the current day from the previous OHLC day values.
Coded by member request on forum.
if Today[0] = Date[0] then
  dh = DHigh(1)
  dl = DLow(1)

  P = (dh + dl + DClose(1))/3
  S1 = P - .382 * (dh-dl)
  S2 = P - .618 * (dh-dl)
  S3 = P -  1 * (dh-dl)
  R1 = P +  .382 * (dh-dl)
  RR2 = P +  .618 * (dh-dl)
  R3 = P + 1 * (dh-dl)
endif

RETURN P as "pivot", S1 as "S1", S2 as "S2", S3 as "S3", R1 as "R1", RR2 as "R2", R3 as "R3"
Comments
You must be logged in to post a comment.



Hi Nicolas, I love these pivot points but most of the time I add it to chart, it messes up the scale and it's very hard to get it back to normal without removing it again. I can't see what is wrong with the code but was hoping you might be able to re-test it and see if you can re-produce the issue? Many thanks Rob

J'ai ce code de Gilles Santacruz de Boursikoter.com qui fonctionne en daily par exemple, j'utilise aussi celui de tradingview en journalier(une boite noire).
Initialement je voulais juste faire ressortir la ou les dernieres valeurs du point pivot Fibo pour ne pas charger le graphe des prix
A la question de remonter des images ici ce n'est pas possible ?
Voici le code Gilles :
Codage prorealtime
de ikiu91 » Mer 29 Sep 2010 23:41
//////////////////////////////////////////////////////////////////////////////////////////
Pivot=(Close[1]+High[1]+Low[1])/3
FR3 = Pivot + 1.000 * (High[1]-Low[1])
FR2 = Pivot + 0.618 * (High[1]-Low[1])
FR1 = Pivot + 0.382 * (High[1]-Low[1])
FS1 = Pivot - 0.382 * (High[1]-Low[1])
FS2 = Pivot - 0.618 * (High[1]-Low[1])
FS3 = Pivot - 1.000 * (High[1]-Low[1])

return Pivot as "pivot", FR3 as "Resistance 1",FR2 as "Resistance 2",FR1 as "Resistance 3",FS1 as "Support 1",FS2 as "Support 2",FS3 as "Support 3"

///////////////////////////////////////////////////////////////////////////
C'est déjà le cas, ce sont les valeurs en clôture de la journée qui précède. Dans le cas présent, dh=le plus haut et dl=le plus bas. C'est en effet un indicateur qui fonctionne en intraday, si tu veux voir quelque-chose dans un timeframe supérieur à partir du daily, tu ne verras rien, puisque ces valeurs changent chaque jour et donc à chaque bougie journalière.
Thanks