Active Trader workspace
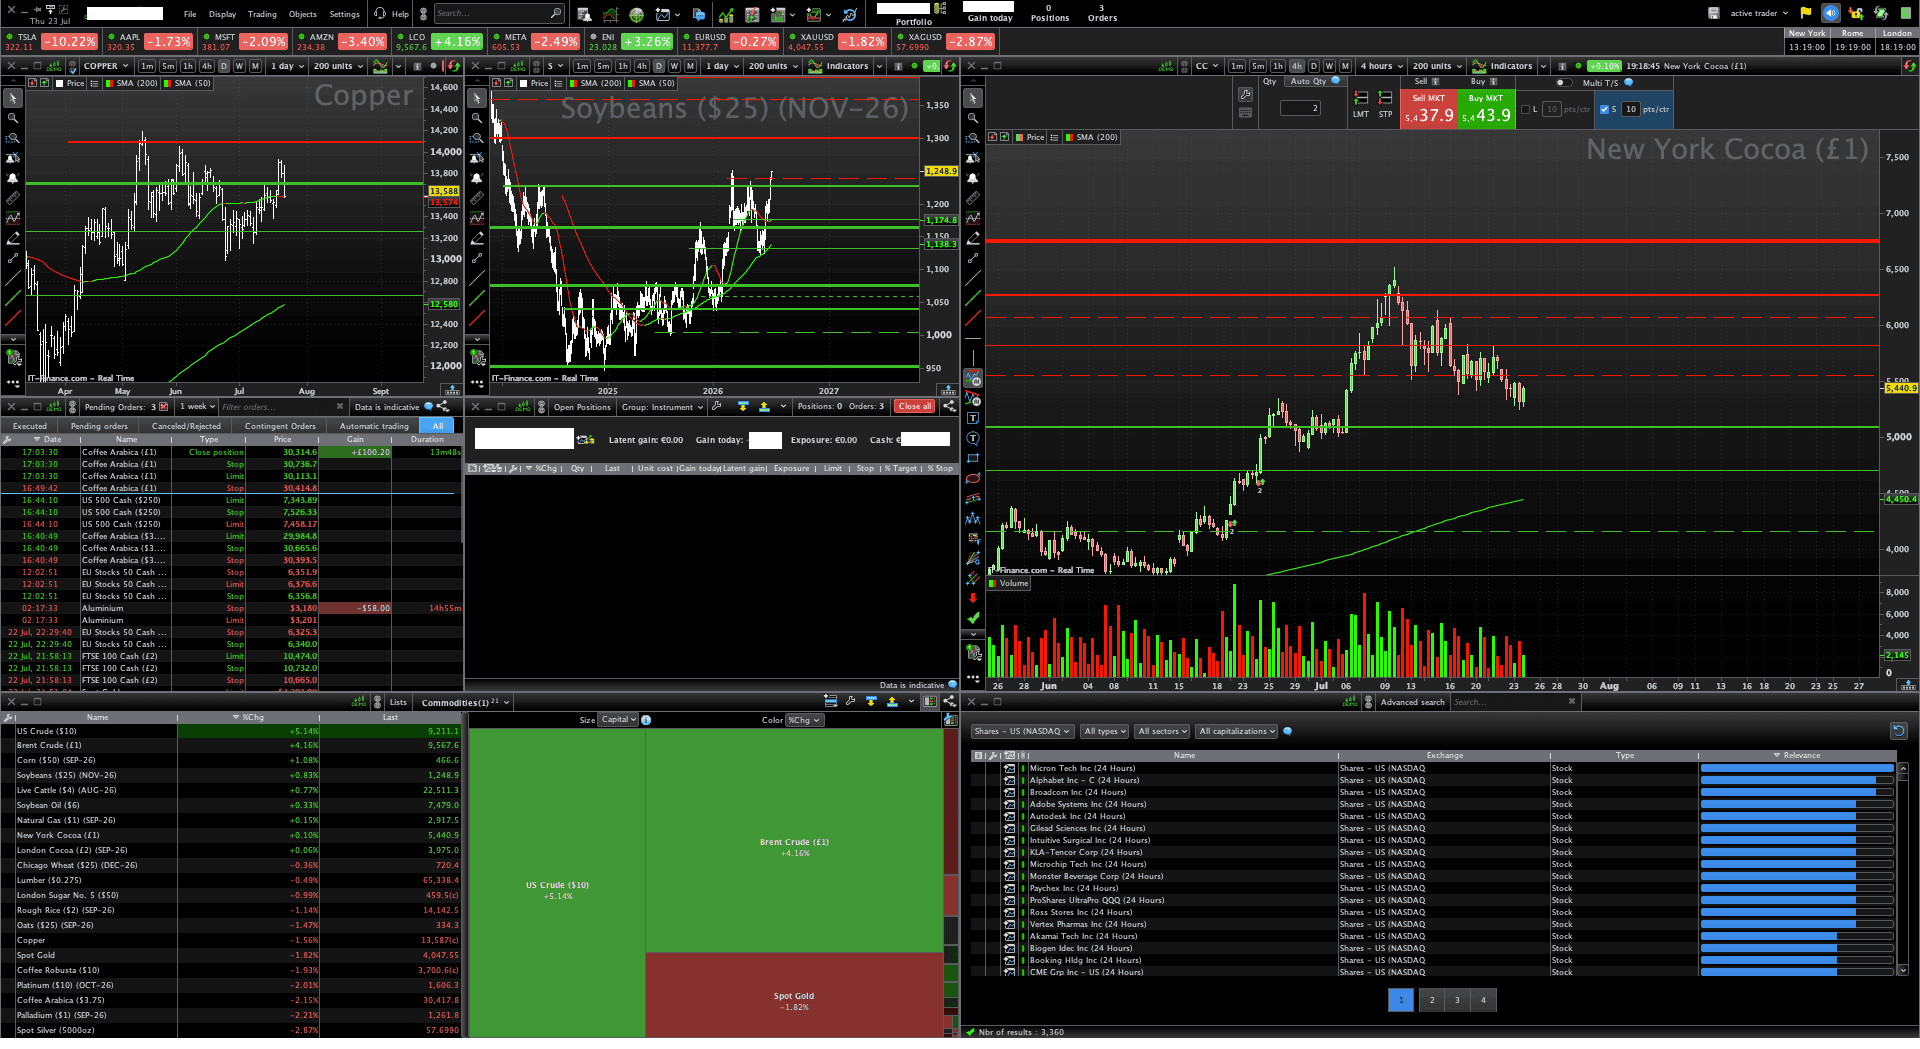
The platform is organized into a multi-panel modular grid designed to optimize technical analysis and direct order execution workflows.
1. Top Bar (Header & Control)
Ticker Bar (Top Bar): A horizontal banner across the top showing real-time percentage changes for multiple tracked instruments.
Status & Account Bar: Positioned in the top-right corner, displaying account summaries (equity, available cash, open positions, active orders) alongside platform settings.
2. Upper Section (Charts & Order Entry)
Divided vertically into two main regions:
Left Side (Two Stacked Charts):
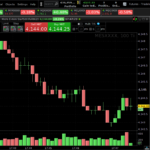
Top Chart:** A compact candlestick chart
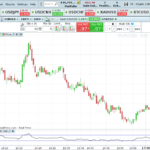
Bottom Chart: A second independent technical chart for medium-to-long-term comparative analysis.
Right Side (Main Chart + Order Panel):
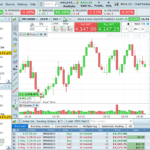
Main Chart: Occupies roughly 50% of the upper section’s width.
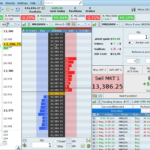
Quick Trade Module: Integrated directly into the top-right corner of the chart for rapid order entry (Market/Limit/Stop) and ticket management.
3. Lower Section (Management & Tools)
Divided into three main columns:
Left Column:
Top Module (Orders Table): Real-time tracking of executed, pending, canceled, and rejected orders along with execution history.
Bottom Module (Watchlist): A tabular list of market instruments with real-time bid/ask prices and percentage performance.
Middle Column:
Heatmap: A visual block-map representation showing market strength and weakness across different sectors or assets at a glance.
Right Column:
Advanced Search & Screener Panel: A market scanner table complete with volume and relevance meters for each listed ticker.