


zigzag avec marqueur (PLH/PLB/Nb points/Volume)

Viewing 3 posts - 1 through 3 (of 3 total)
  • Author
    Posts
  • #265549 quote
    titititi
    Participant
    Junior

    Bonjour,

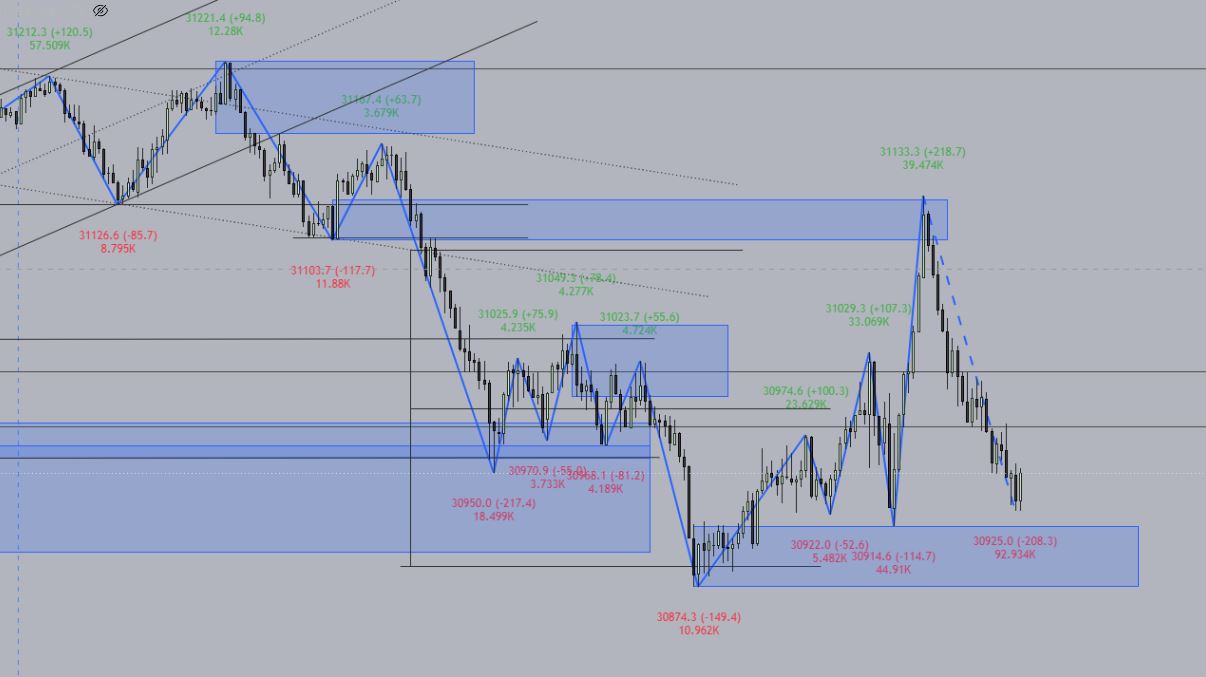
    J’ai parcouru le forum et je n’ai pas trouvé de zigzag qui affiche le plus Haut, plus Bas, écart entre fractal zigzag et le volume entre chaque fractal. J’utilise un code sur tradingview et je souhaiterai savoir s’il serait possible de convertir ce code pour PRT ? Il est très utile pour comprendre la dynamique des hausses ou baisse (via les volumes) et de comprendre les amplitudes de manière visuel plutôt que de devoir le calculer à chaque fois.

    le réglage s’effectue en % sur cet indicateur.

    Merci beaucoup à ceux qui pourraient m’aider.


    zigzag.jpg zigzag.jpg
    #265550 quote
    titititi
    Participant
    Junior

    ci-joint le code de Tradingview

    #265551 quote
    titititi
    Participant
    Junior

    //@version=6

    indicator(“Zigzag”, overlay = true, max_lines_count = 500, max_labels_count = 500)


    import TradingView/ZigZag/9 as ZigZagLib


    // Tooltips

    string TT_D = (

        “Specifies the total number of bars required to confirm a pivot point. “

        + “The required number of left and right bars is half this value, rounded down as necessary.”

    )

    string TT_P = (

        “If selected, the indicator searches for projected pivots that are not yet confirmed on realtime bars. “ +

        “When a valid projection is identified, the Zig Zag updates its structure immediately, then “

        + “draws a temporary dashed line to show the projected point.\n\n”

        + “If not selected, the Zig Zag updates its structure only when a new pivot point is confirmed, “

        + “and it does not search for or display projected pivots.”

    )


    // Inputs

    float  deviationInput = input.float(5.0, “Price deviation for reversals (%)”, 0.00001, 100.0, 0.5, “0.00001 – 100”)

    int    depthInput     = input.int(10, “Pivot legs”, 2, tooltip = TT_D)

    color  lineColorInput = input(#2962FF, “Line color”, display = display.none)

    bool   projectInput   = input(true, “Calculate projected pivots”, tooltip = TT_P, display = display.none)

    bool   showPriceInput = input(true, “Display reversal price”, display = display.none)

    bool   showVolInput   = input(true, “Display cumulative volume”, display = display.none)

    bool   showChgInput   = input(true, “Display reversal price change”, inline = “priceRev”, display = display.none)

    string priceDiffInput = input.string(“Absolute”, “”, [“Absolute”, “Percent”], inline = “priceRev”, display = display.none, active = showChgInput)


    // Create a ZigZag object from user settings.

    var zigZag = ZigZagLib.newInstance(

        ZigZagLib.Settings.new(

            deviationInput, depthInput, lineColorInput, projectInput,

            showPriceInput, showVolInput, showChgInput, priceDiffInput, true

        )

    )


    // Update the Zig Zag on each bar, adding new pivot points and drawings when possible.

    zigZag.update()
Viewing 3 posts - 1 through 3 (of 3 total)
  • You must be logged in to reply to this topic.

ProRealAI ProRealAI New

Stuck on this ProBuilder code?

Describe what this topic is trying to build, in plain English, and ProRealAI writes the ProRealTime™ indicator, screener or system for you.

Available in 7 languages
Try ProRealAI

zigzag avec marqueur (PLH/PLB/Nb points/Volume)


ProBuilder : Indicateurs & Outils Personnalisés

New Reply
Author
author-avatar
titi @el-titi Participant
Summary

This topic contains 2 replies,
has 1 voice, and was last updated by titititi

5 hours, 46 minutes ago.

Topic Details
Forum: ProBuilder : Indicateurs & Outils Personnalisés
Language: French
Started: 10/08/2026
Status: Active
Attachments: 1 files
ProRealCode ProRealCode
Loading...

