WVAP et MARKET PROFILE

Viewing 4 posts - 1 through 4 (of 4 total)
  • Author
    Posts
  • #260750 quote
    larouedegann
    Participant
    Master

    Bonjour à tous,

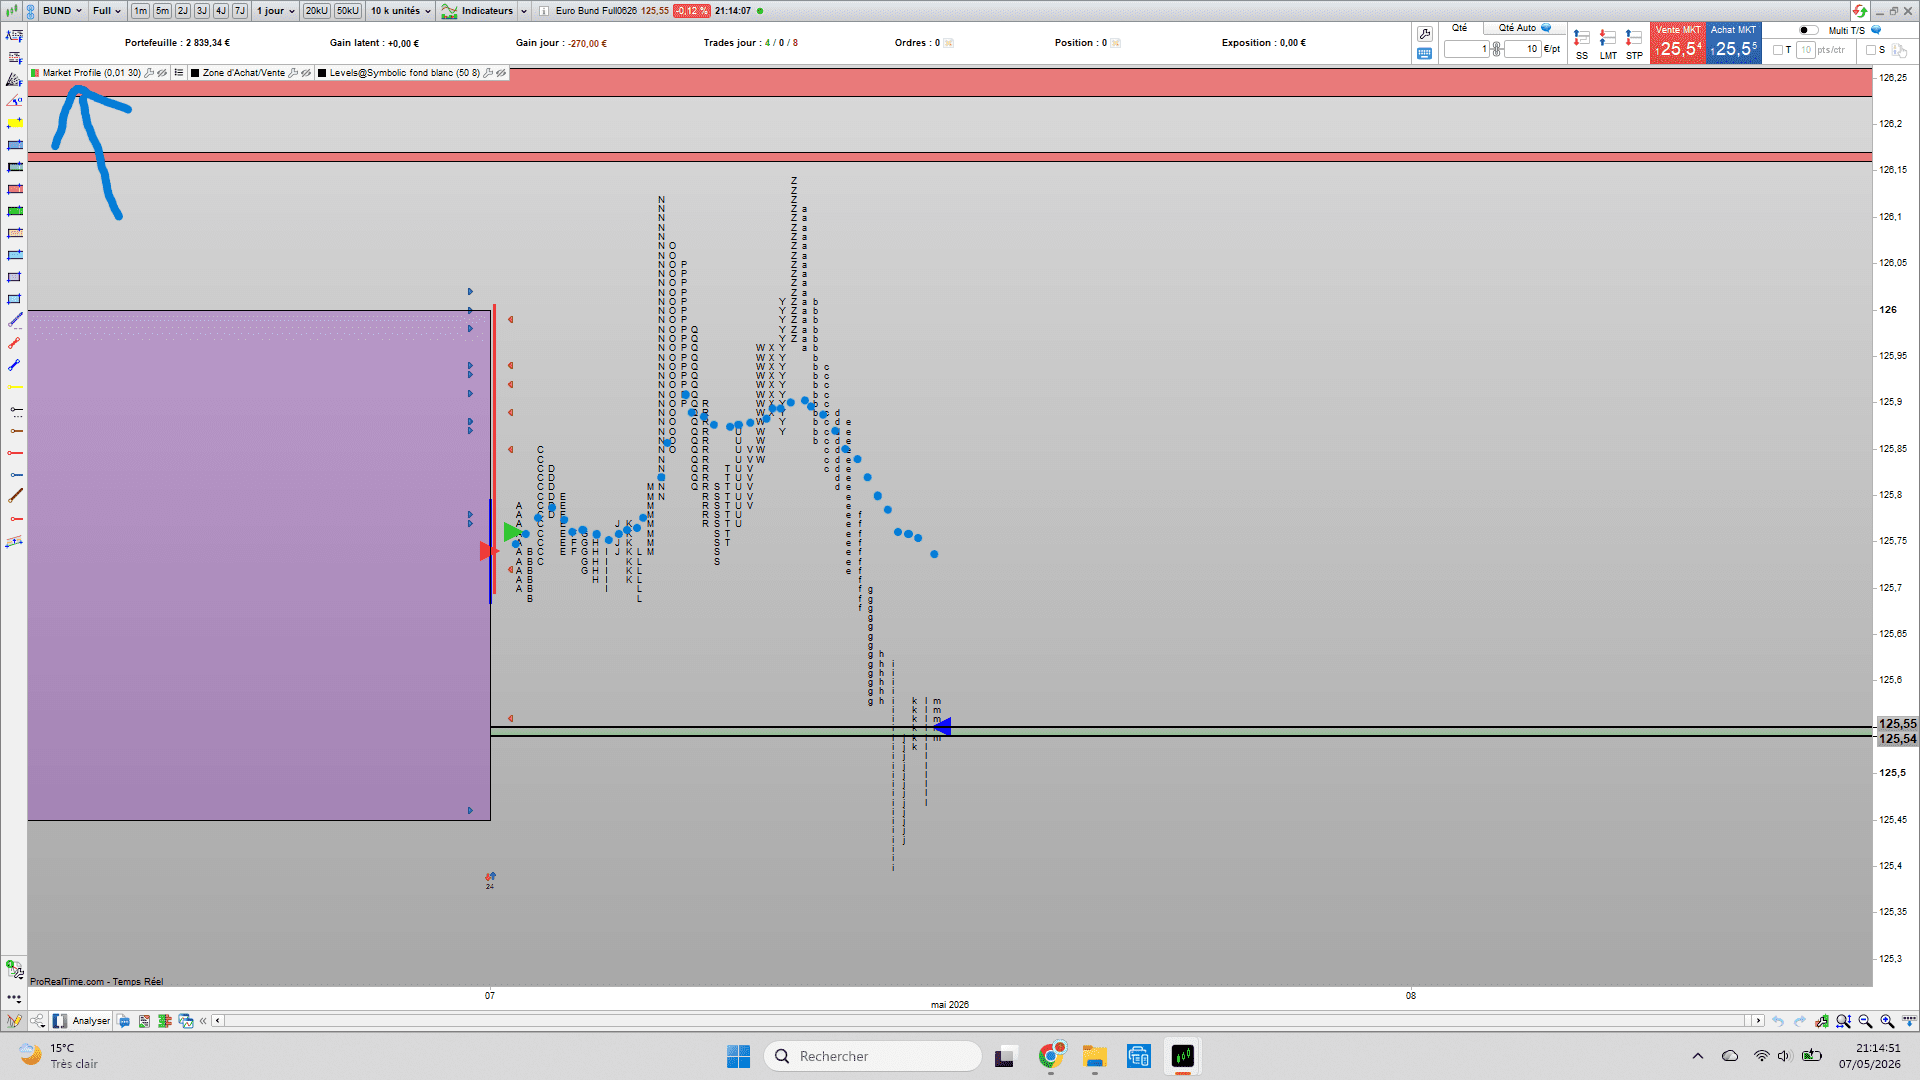
    Je cherche à coder la “WVAP” dans le market profile, l’indicateur “VWAP” dans PRT ne pouvant s’utiliser uniquement qu’avec “prix”.

    Celle-ci pourrait avoir la forme de boites ou de point de la taille du tick du support.

    Merci à ceux qui peuvent

    Capture-decran-2026-05-01-160452.png Capture-decran-2026-05-01-160452.png
    #260900 quote
    Iván González
    Moderator
    Master

    Petite précision avant le code : ce que tu décris (boîtes ou points par niveau de prix) n’est pas vraiment un “VWAP”, c’est un Volume Profile, la distribution horizontale du volume par tranche de prix. Le VWAP en soi reste une ligne unique. Je te propose donc les deux dans le même indicateur : le Volume Profile (boîtes) + la ligne VWAP de la fenêtre + le POC.


    DEFPARAM drawonlastbaronly = TRUE
    
    // ============ Parametros ============
    lookback = 100        // barras a analizar
    profileWidth = 40     // anchura visual del profile (barras)
    
    // Resolucion: intenta usar tick real, limitada a 30 bins max
    itickSize = pipsize
    priceRange = highest[lookback](high) - lowest[lookback](low)
    nbBinsTick = round(priceRange / itickSize)
    IF nbBinsTick > 30 THEN
       nbBins = 30
    ELSE
       nbBins = nbBinsTick
    ENDIF
    
    // ============ Calculo ============
    IF barindex >= lookback AND islastbarupdate THEN
       topPrice = highest[lookback](high)
       botPrice = lowest[lookback](low)
       stepSize = (topPrice - botPrice) / nbBins
       
       // Niveles
       FOR x = 0 TO nbBins DO
          $levels[x] = botPrice + stepSize * x
       NEXT
       FOR x = 0 TO nbBins - 1 DO
          $vol[x] = 0
       NEXT
       
       sumVolPrice = 0
       sumVol = 0
       
       // Distribucion proporcional body+wicks (wicks pesan x2)
       FOR b = 0 TO lookback - 1 DO
          bTop = max(close[b], open[b])
          bBot = min(close[b], open[b])
          tw = high[b] - bTop
          bw = bBot - low[b]
          bd = bTop - bBot
          denom = 2*tw + 2*bw + bd
          
          tp = (high[b] + low[b] + close[b]) / 3
          sumVolPrice = sumVolPrice + tp * volume[b]
          sumVol = sumVol + volume[b]
          
          IF denom > 0 THEN
             bdVol = bd * volume[b] / denom
             twVol = 2 * tw * volume[b] / denom
             bwVol = 2 * bw * volume[b] / denom
             
             FOR x = 0 TO nbBins - 1 DO
                lLo = $levels[x]
                lHi = $levels[x + 1]
                
                IF bd > 0 THEN
                   bdOvlp = max(0, min(lHi, bTop) - max(lLo, bBot))
                   bdC = bdOvlp * bdVol / bd
                ELSE
                   bdC = 0
                ENDIF
                
                IF tw > 0 THEN
                   twOvlp = max(0, min(lHi, high[b]) - max(lLo, bTop))
                   twC = twOvlp * twVol / tw
                ELSE
                   twC = 0
                ENDIF
                
                IF bw > 0 THEN
                   bwOvlp = max(0, min(lHi, bBot) - max(lLo, low[b]))
                   bwC = bwOvlp * bwVol / bw
                ELSE
                   bwC = 0
                ENDIF
                
                $vol[x] = $vol[x] + bdC + twC + bwC
             NEXT
          ENDIF
       NEXT
       
       // VWAP de la ventana
       IF sumVol > 0 THEN
          vwapVal = sumVolPrice / sumVol
       ELSE
          vwapVal = undefined
       ENDIF
       
       // POC
       maxV = 0
       pocIdx = 0
       FOR x = 0 TO nbBins - 1 DO
          IF $vol[x] > maxV THEN
             maxV = $vol[x]
             pocIdx = x
          ENDIF
       NEXT
       pocLevel = ($levels[pocIdx] + $levels[pocIdx + 1]) / 2
       
       // Dibujo: rectangulos horizontales a la derecha del precio
       startX = barindex + 5
       FOR x = 0 TO nbBins - 1 DO
          IF $vol[x] > 0 THEN
             w = round($vol[x] * profileWidth / maxV)
             IF x = pocIdx THEN
                DRAWRECTANGLE(startX, $levels[x+1], startX + w, $levels[x]) coloured(255, 80, 80, 220)
             ELSE
                DRAWRECTANGLE(startX, $levels[x+1], startX + w, $levels[x]) coloured(100, 150, 255, 140)
             ENDIF
          ENDIF
       NEXT
       
       // VWAP de la ventana como linea horizontal
       DRAWSEGMENT(barindex - lookback + 1, vwapVal, barindex, vwapVal) coloured(255, 200, 0) style(line, 2)
       DRAWTEXT("VWAP #vwapVal#", barindex + profileWidth + 8, vwapVal, dialog, bold, 11) coloured(255, 200, 0)
       DRAWTEXT("POC #pocLevel#", barindex + profileWidth + 8, pocLevel, dialog, bold, 11) coloured(255, 80, 80)
    ENDIF
    
    RETURN


    robertogozzi thanked this post
    #260916 quote
    larouedegann
    Participant
    Master

    Merci pour ton travail ivan , mais je pense m’être mal exprimé.

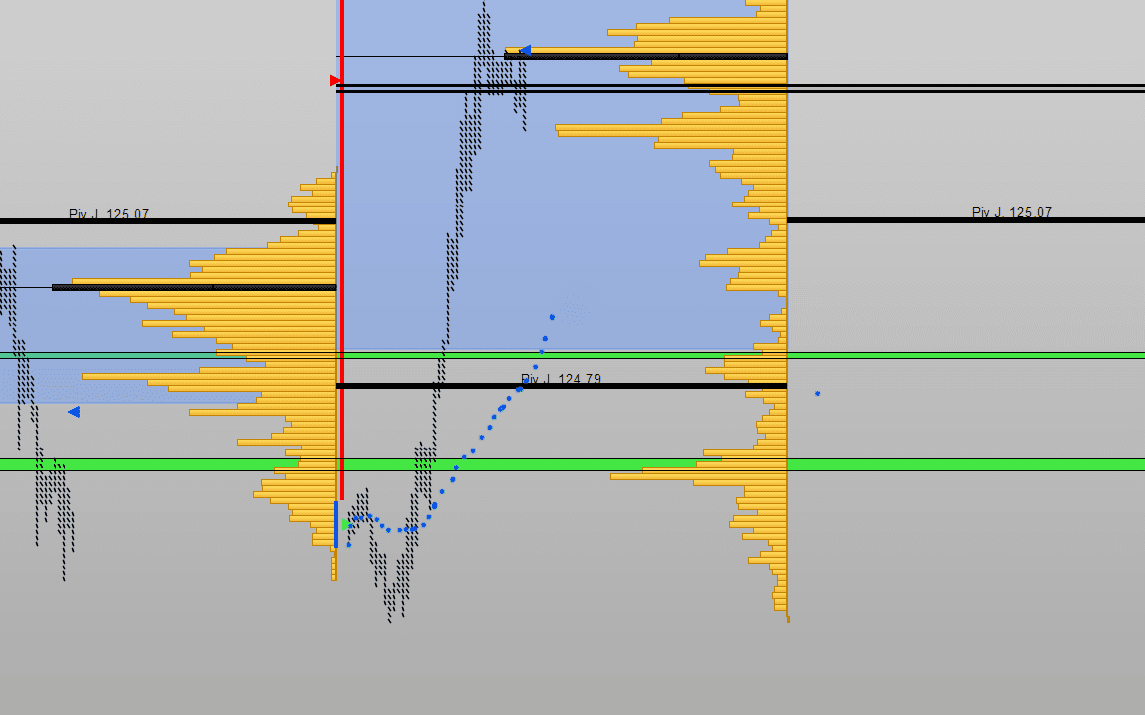
    Le graphique est en mode MARKET PROFILE et non en mode PRIX. Je l’ai appuré de façon à n’avoir que

    le market profile (ici il est splité).Cette option VWAP n’existe pas dans ce mode, donc le but est d’avoir une VWAP en mode MARKET PROFILE comme

    indiqué dans ci-dessous.

    #260921 quote
    larouedegann
    Participant
    Master
Viewing 4 posts - 1 through 4 (of 4 total)

  • You must be logged in to reply to this topic.

WVAP et MARKET PROFILE


ProBuilder : Indicateurs & Outils Personnalisés

New Reply
Author
Summary

This topic contains 3 replies,
has 2 voices, and was last updated by larouedegann
1 week, 1 day ago.

Topic Details
Forum: ProBuilder : Indicateurs & Outils Personnalisés
Language: French
Started: 05/01/2026
Status: Active
Attachments: 2 files
Logo Logo
Loading...