Woodies CCI indicator conversion from trading view

Viewing 2 posts - 1 through 2 (of 2 total)
  • Author
    Posts
  • #188533 quote
    cactus363cactus363
    Participant
    New

    Hi,

    Is it possible to convert this indicator from tradingview pinescript?
    I would really appreciate if someone can help with this.
    I have attempted to replicate it but can only achiveve displaying the two  CCI’s withouth the coloring.
    Many thanks

    The Trading View Pine Script:

    //@version=3
    study(title="Woodies CCI + CZ + SW indicators")
    
    //declaration of variables
    source = input (title="Source for CCI", defval=close)
    barsbt = input(title="Bars before trend", defval = 4)
    
    
    swhigh = input(title="Sidewinder higher th", defval = 1.7453)
    swlow = input(title="Sidewinder lower th", defval = 0.5235)
    swmid = input(title="Sidewinder middle th", defval = 1.0471)
    
    colorTurquoise = #34dddd
    colorDarkGreen = #006400
    colorPaleGreen = #98fb98
    colorLime = lime
    colorDarkRed = #8B0000
    colorRed = red
    colorOrange = orange
    colorLightOrange = #ffc04c
    colorYellow = yellow
    
    avg = hlc3
    
    pi = atan(1) * 4
    periods = 30
    highestHigh = highest(periods)
    lowestLow = lowest(periods)
    range = 25 / (highestHigh - lowestLow) * lowestLow
    
    //Chopzone indicator
    
    emal = input(title="ema34 Length", type=integer, defval=34)
    ema34 = ema(source, emal)
    x1_ema34 = 0
    x2_ema34 = 1
    y1_ema34 = 0
    y2_ema34 = (ema34[1] - ema34) / avg * range
    c_ema34 = sqrt((x2_ema34 - x1_ema34)*(x2_ema34 - x1_ema34) + (y2_ema34 - y1_ema34)*(y2_ema34 - y1_ema34))
    emaAngle_1 = round(180 * acos((x2_ema34 - x1_ema34)/c_ema34) / pi)
    emaAngle = iff(y2_ema34 > 0, - emaAngle_1, emaAngle_1)
    
    chopZoneColor = emaAngle >= 5 ? colorTurquoise : emaAngle < 5 and emaAngle >= 3.57 ? colorDarkGreen : emaAngle < 3.57 and emaAngle >= 2.14 ? colorPaleGreen : emaAngle < 2.14 and emaAngle >= .71 ? colorLime : emaAngle <= -1 * 5 ? colorDarkRed : emaAngle > -1 * 5 and emaAngle <= -1 * 3.57 ? colorRed : emaAngle > -1 * 3.57 and emaAngle <= -1 * 2.14 ? colorOrange : emaAngle > -1 * 2.14 and emaAngle <= -1 * .71 ? colorLightOrange : colorYellow
    
    // Woodies CCI indicator
    
    cciTurboLength = input(title="CCI Turbo Length", type=integer, defval=6, minval=3, maxval=14)
    cci14Length = input(title="CCI 14 Length", type=integer, defval=14, minval=7, maxval=20)
    
    
    cciTurbo = cci(source, cciTurboLength)
    cci14 = cci(source, cci14Length)
    
    ccilz = barssince(crossunder(cci14,0))
    ccigz = barssince(crossover(cci14,0))
    
    ccibrs = (ccilz > ccigz) ? ccigz : ccilz
    
    
    histogramColor = (ccibrs < barsbt) ? silver : (ccibrs == barsbt) ? yellow : (cci14 < 0) ? red: green
    cci14color = cci14 < 0 ? red : green
    
    
    //LSMA indicator
    length = input(title="Length", type=integer, defval=25)
    offset = input(title="Offset", type=integer, defval=0)
    
    src = input(defval=open, title="Source for LSMA")
    
    lsma = linreg(src, length, offset)
    lsmastd = stdev(abs(lsma[1] - lsma), length)
    colorLine= abs(lsma - lsma[1]) < lsmastd ? white : lsma < lsma[1] ? red : green
    //Sidewinder indicator
    sum=change(lsma)+change(ema34)
    //** radian angles
    colorLineSW= abs(sum)> swhigh ? green : (abs(sum)>swlow and abs(sum)<swmid) ? red : yellow
    colorLineSW2= close > ema34 ? green : red 
    //plots of CCIS
    plot(cci14, title="CCI 14 area", color=histogramColor, style=area, transp=50)
    plot(cciTurbo, title="CCI Turbo", color=aqua, style=line, linewidth=2)
    plot(cci14, title="CCI 14", color=fuchsia, style=line, linewidth=2)
    //plots of Chopzones
    plot(100, title="plusle chop zone",color=chopZoneColor , style=line, linewidth=3, editable= false)
    plot(-100, title="minus chop zone",color=chopZoneColor , style=line, linewidth=3, editable= false)
    //plot of LSMA
    plot(0, title="LSMA line",color=colorLine , style=line, linewidth=3, editable= false)
    //plot of Sidewinder
    plot(-200, title="-Sidewinder",color=colorLineSW , style=line, linewidth=3, editable= false)
    plot(200, title="-Sidewinder",color=colorLineSW2 , style=line, linewidth=3, editable= false)
    
    //hlines
    hline(0, title="Zero Line", color=black, linestyle=solid)
    hline(200, title="+Sidewinder line", color=black, linestyle=dotted)
    hline(-200, title="-Sidewinder line", color=black, linestyle=dotted)
    hline(100, title="+chop zone line", color=black, linestyle=dotted)
    hline(-100, title="-chop zone line", color=black, linestyle=dotted)


    #188534 quote
    cactus363cactus363
    Participant
    New

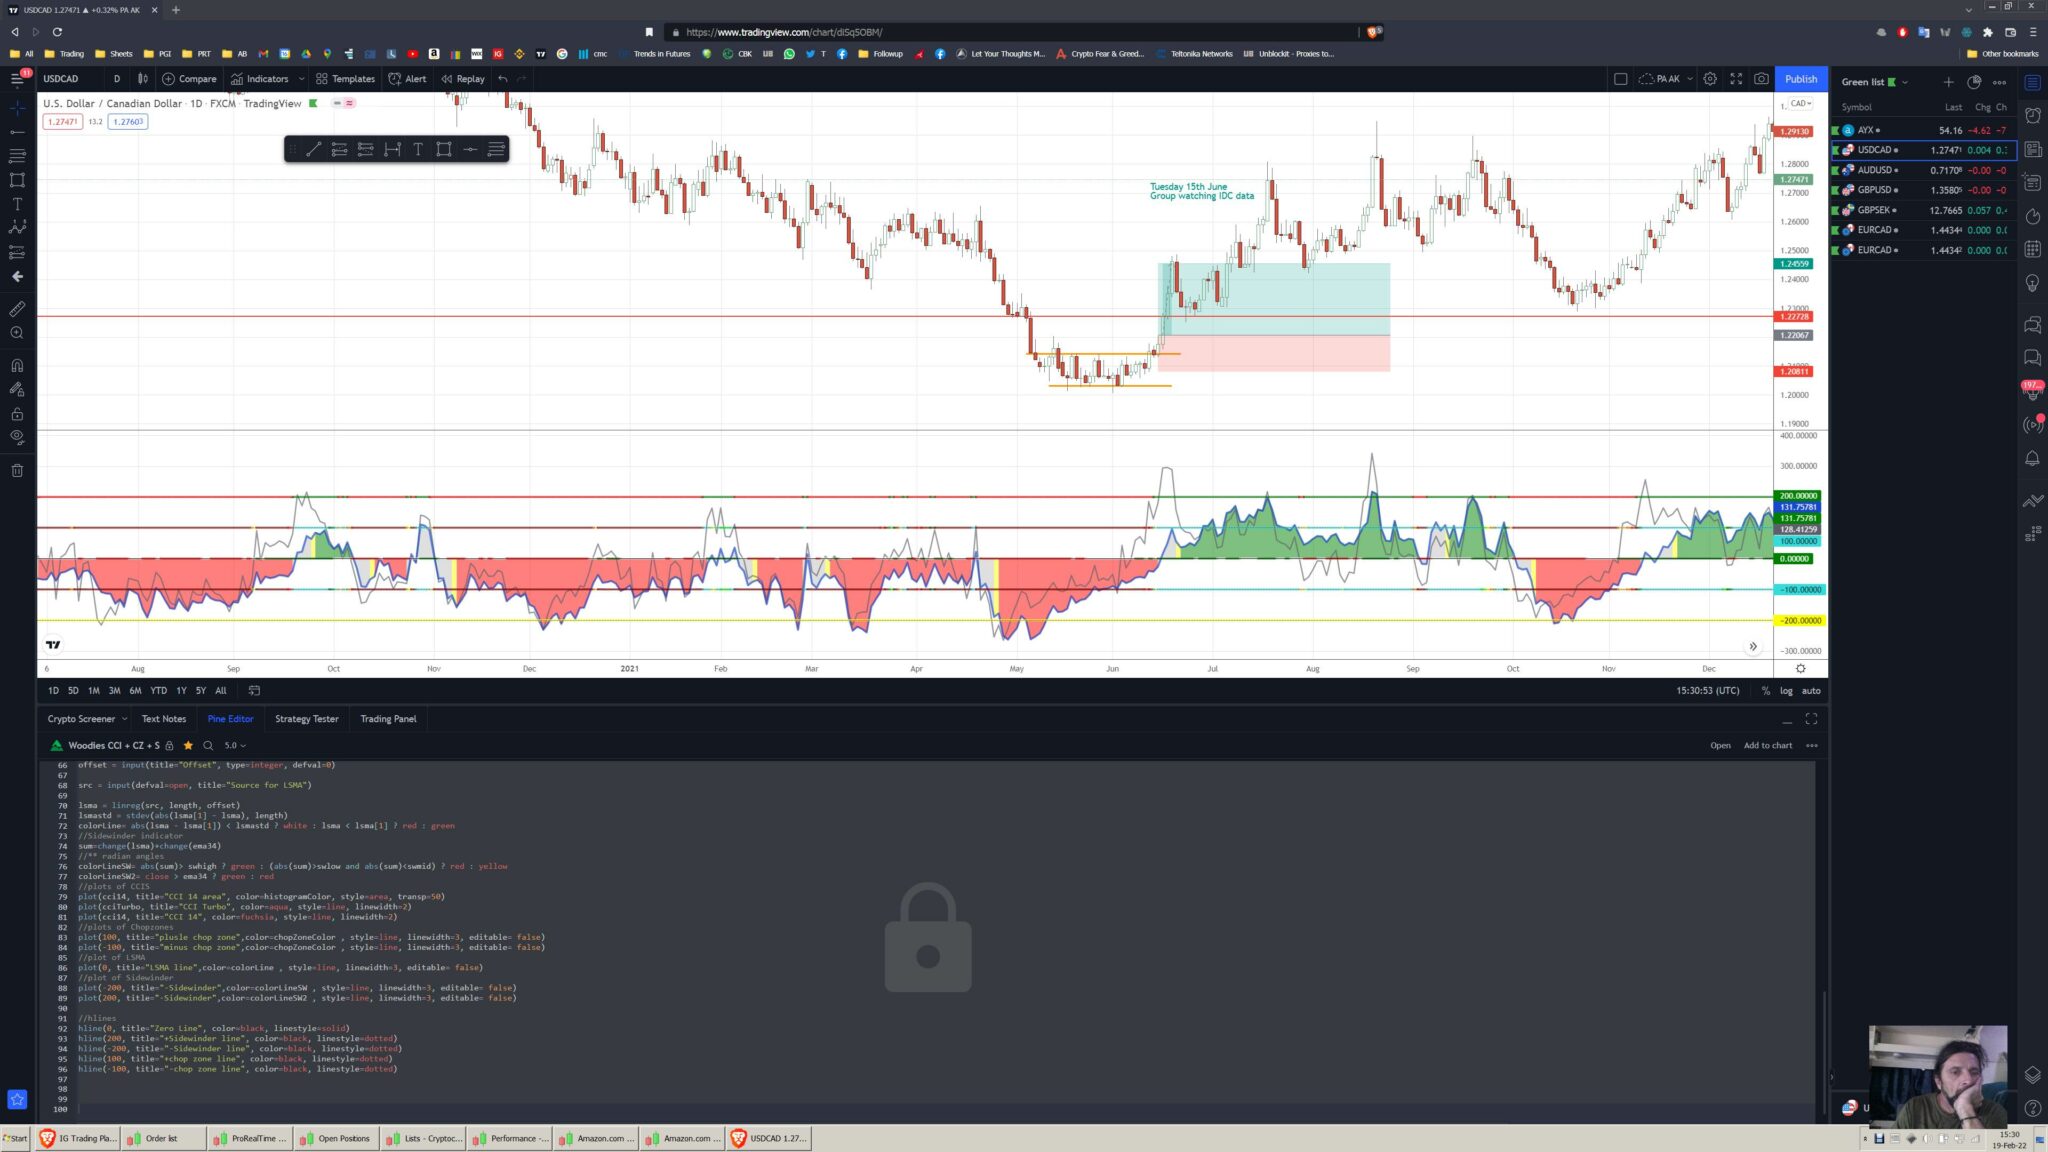
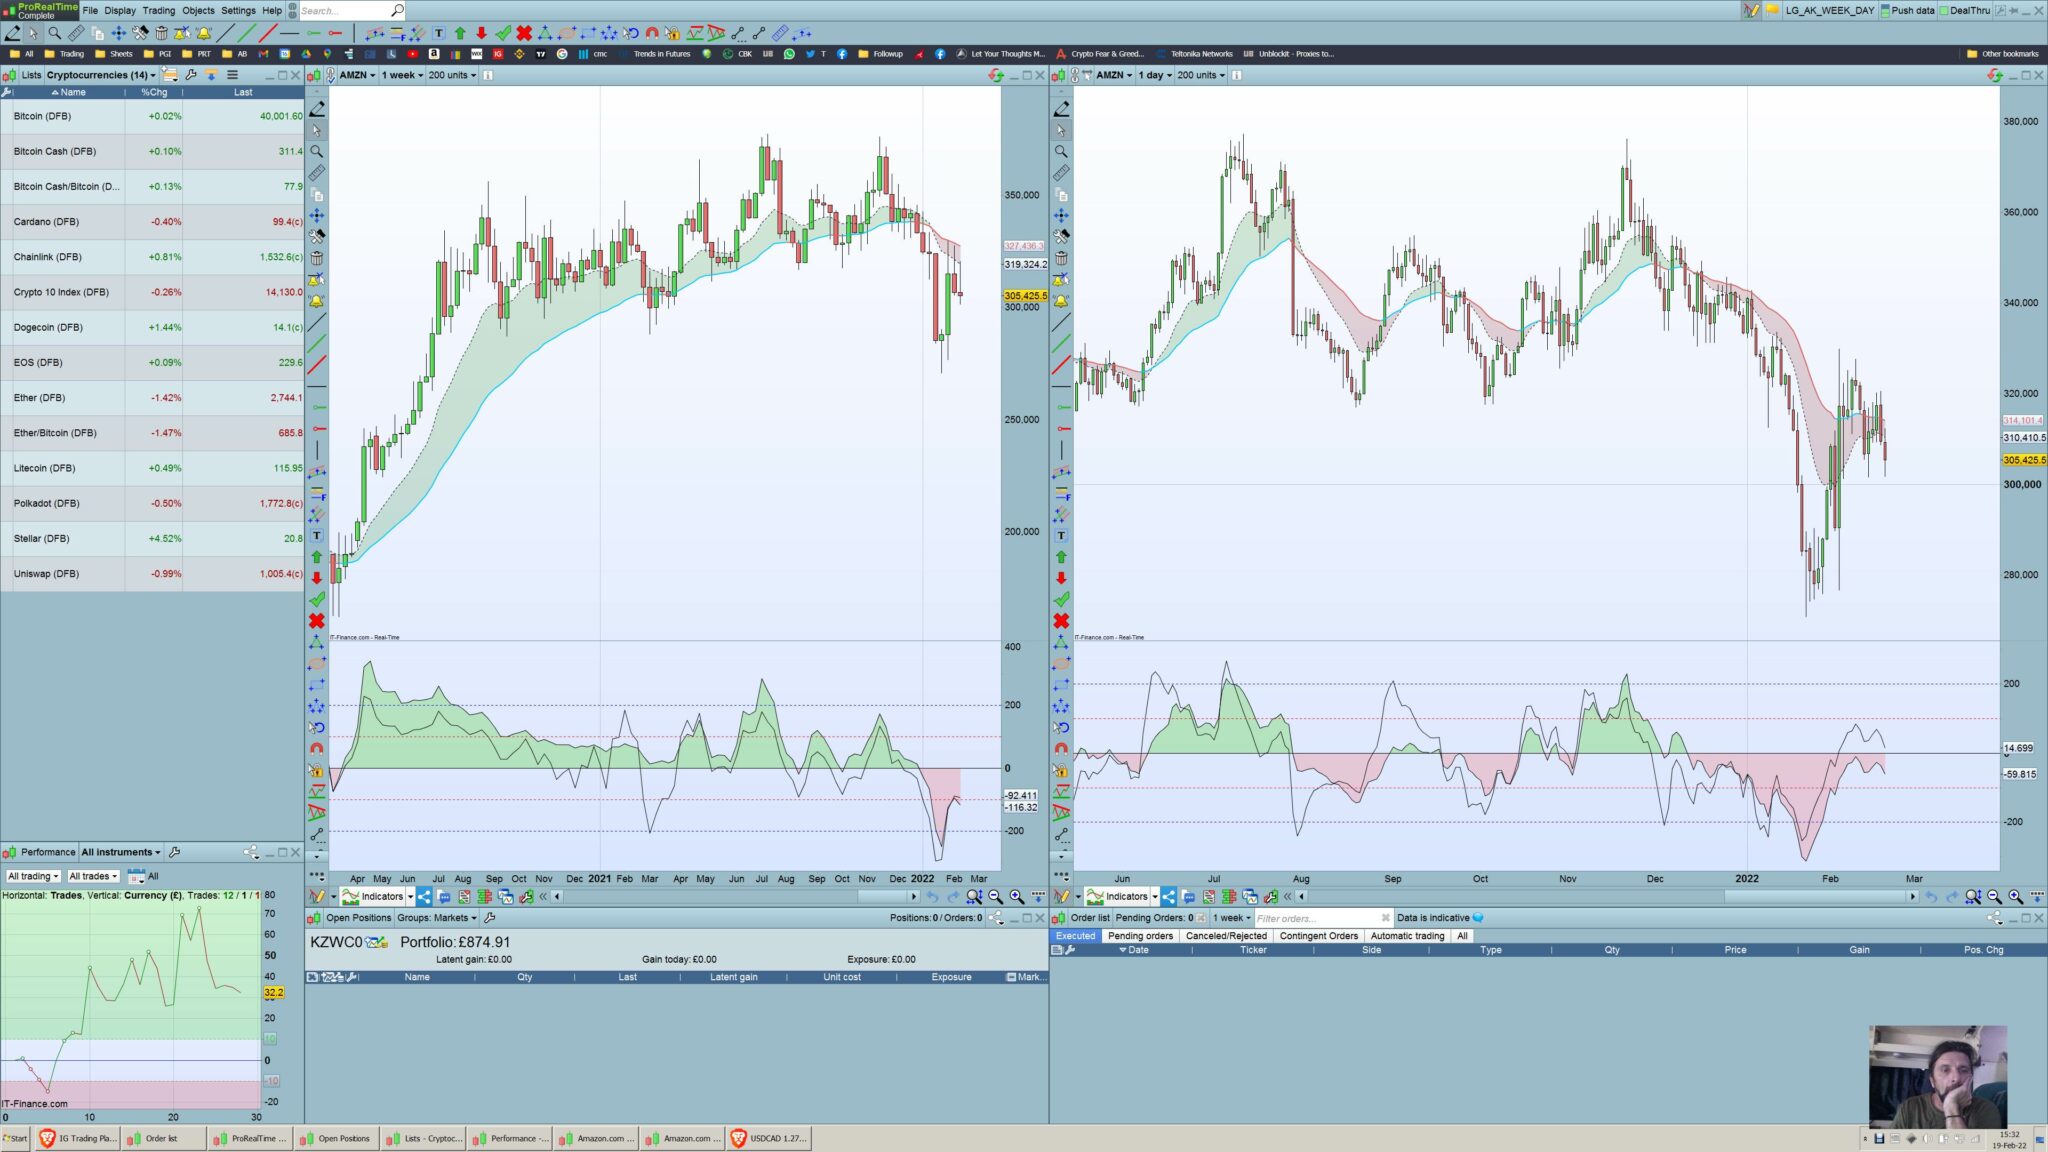
    Here are the screenshots on trading view what it should look like and on PRT the basic display I managed to write

    Untitled-12.jpg Untitled-12.jpg Untitled-13.jpg Untitled-13.jpg
Viewing 2 posts - 1 through 2 (of 2 total)
  • You must be logged in to reply to this topic.

ProRealAI ProRealAI New

Stuck on this ProBuilder code?

Describe what this topic is trying to build, in plain English, and ProRealAI writes the ProRealTime™ indicator, screener or system for you.

Available in 7 languages
Try ProRealAI

Woodies CCI indicator conversion from trading view


ProBuilder: Indicators & Custom Tools

New Reply
Author
author-avatar
cactus363 @cactus363 Participant
Summary

This topic contains 1 reply,
has 1 voice, and was last updated by cactus363cactus363
4 years, 7 months ago.

Topic Details
Forum: ProBuilder: Indicators & Custom Tools
Language: English
Started: 02/19/2022
Status: Active
Attachments: 2 files
ProRealCode ProRealCode
Loading...