


Weekly High/Low + Fib Levels

Viewing 3 posts - 1 through 3 (of 3 total)
  • Author
    Posts
  • #188875 quote
    breitdombreitdom
    Participant
    New

    Good day to all!

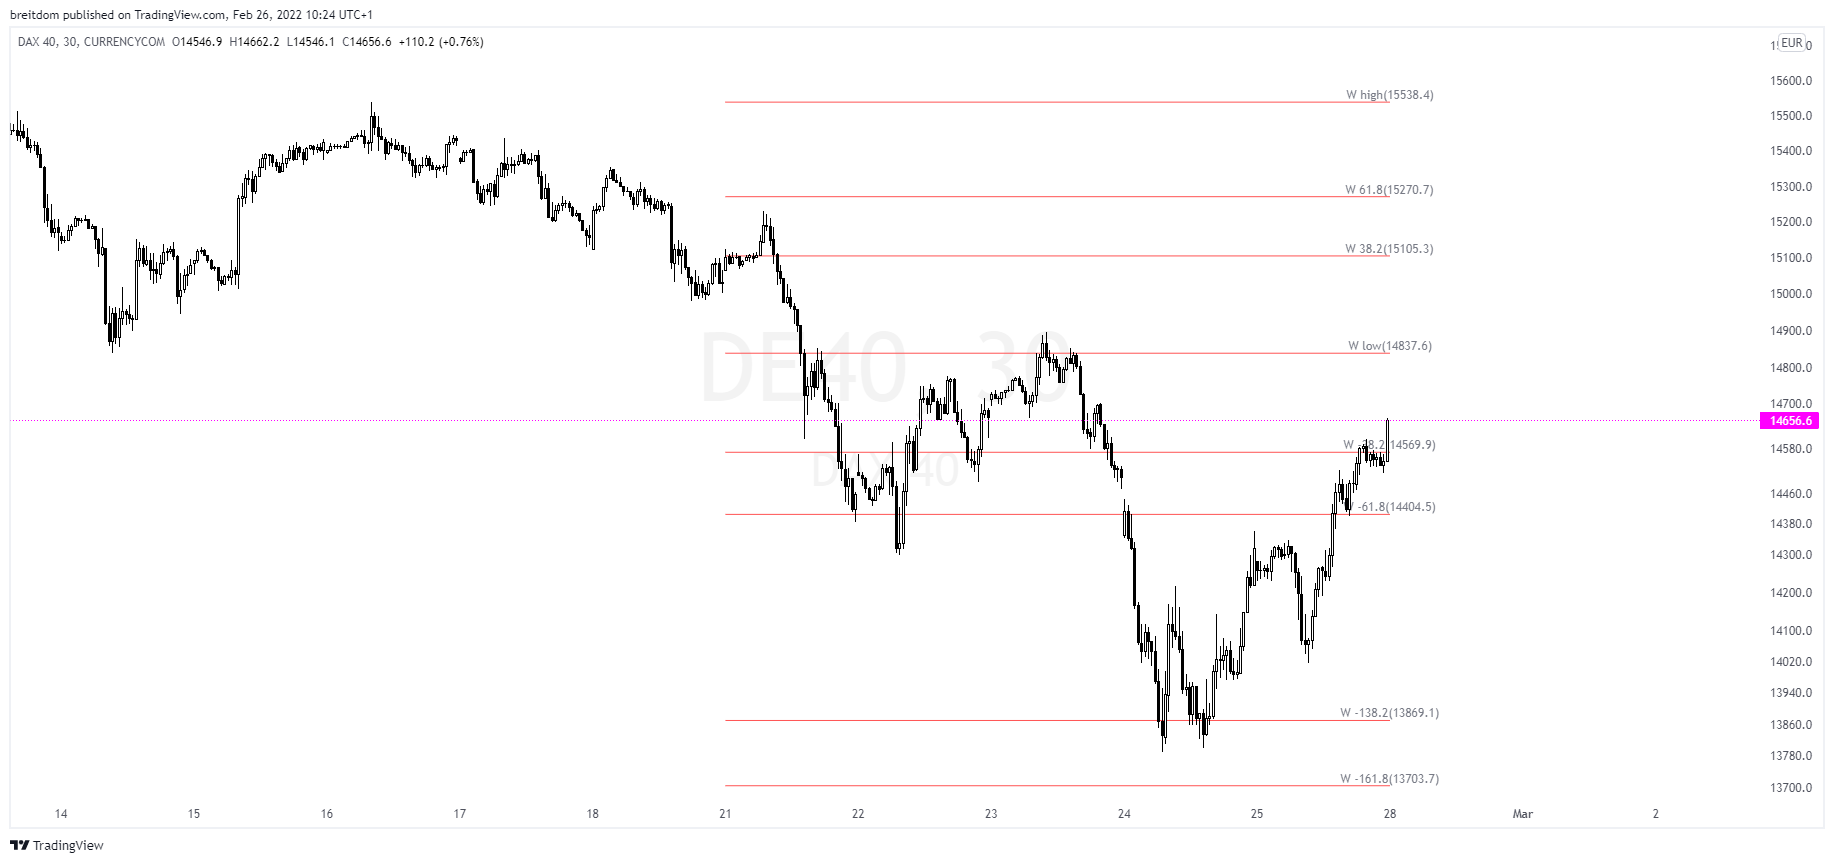
    I need the following indicator:
    The high and low from the previous week should be taken and fibonacci levels (incl. extension) should be able to be set based on this range.
    From this horizontal lines should be plotted. The line starts at the time of the week change and is to be drawn through for a desired distance to the current time.

    If there is a need for more information, please provide feedback.

    Thank you very much!

    Best regards

    indicator_only.png indicator_only.png
    #188910 quote
    JC_BywanJC_Bywan
    Moderator
    Master

    Hi,

    Don’t know how many ext you wanted, you can easily add more if needed by using same principle in lines 21-40. You can change N value at the beginning to customise the display of digits after comma.

    defparam drawonlastbaronly=true
    
    once N=1 // number of digits displayed after coma
    
    if opendayofweek[1]>opendayofweek then
    barstart=barindex
    WprevH=hh
    WprevL=ll
    Wrange=WprevH-WprevL
    ll=low
    hh=high
    endif
    ll=min(ll,low)
    hh=max(hh,high)
    
    DRAWSEGMENT(barstart, WprevH, barindex, WprevH) coloured(255,0,0) 
    DRAWSEGMENT(barstart, WprevL, barindex, WprevL) coloured(255,0,0)
    DRAWTEXT("W Low #WprevL#", barindex, WprevL)
    DRAWTEXT("W High #WprevH#", barindex, WprevH)
    
    F382=round(WprevL+0.382*Wrange,N)
    F618=round(WprevL+0.618*Wrange,N)
    F1382=round(WprevL+1.382*Wrange,N)
    F1618=round(WprevL+1.618*Wrange,N)
    M382=round(WprevL-0.382*Wrange,N)
    M618=round(WprevL-0.618*Wrange,N)
    
    DRAWSEGMENT(barstart, F382, barindex, F382) coloured(255,0,0) style(dottedline,1)
    DRAWSEGMENT(barstart, F618, barindex, F618) coloured(255,0,0) style(dottedline,1)
    DRAWSEGMENT(barstart, F1382, barindex, F1382) coloured(255,0,0) style(dottedline,1)
    DRAWSEGMENT(barstart, F1618, barindex, F1618) coloured(255,0,0) style(dottedline,1)
    DRAWSEGMENT(barstart, M382, barindex, M382) coloured(255,0,0) style(dottedline,1)
    DRAWSEGMENT(barstart, M618, barindex, M618) coloured(255,0,0) style(dottedline,1)
    
    DRAWTEXT("W 38.2% #F382#", barindex, F382)
    DRAWTEXT("W 61.8% #F618#", barindex, F618)
    DRAWTEXT("W 138.2% #F1382#", barindex, F1382)
    DRAWTEXT("W 161.8% #F1618#", barindex, F1618)
    DRAWTEXT("W 38.2% #M382#", barindex, M382)
    DRAWTEXT("W 61.8% #M618#", barindex, M618)
    
    return
    breitdom thanked this post
    #188920 quote
    breitdombreitdom
    Participant
    New

    Wow, that was so fast!

    Many, many thanks

Viewing 3 posts - 1 through 3 (of 3 total)

  • You must be logged in to reply to this topic.

ProRealAI ProRealAI New

Stuck on this ProBuilder code?

Describe what this topic is trying to build, in plain English, and ProRealAI writes the ProRealTime™ indicator, screener or system for you.

Available in 7 languages
Try ProRealAI

Weekly High/Low + Fib Levels


ProBuilder: Indikatoren & Custom Tools

New Reply
Author
author-avatar
breitdom @breitdom Participant
Summary

This topic contains 2 replies,
has 2 voices, and was last updated by breitdombreitdom

4 years, 6 months ago.

Topic Details
Forum: ProBuilder: Indikatoren & Custom Tools
Language: German
Started: 02/26/2022
Status: Active
Attachments: 1 files
ProRealCode ProRealCode
Loading...

