Wanted help to integrate two Indicators

Viewing 6 posts - 1 through 6 (of 6 total)
  • Author
    Posts
  • #121946 quote
    ZigoZigo
    Participant
    Master

    What I want to do is, depending on the trend Up:Higher Tops and higher bottems integration of indicator 3 into indicator 1

    if the trend is Down: Lower tops and lower bottems integration of indicator 3 into indicator 2

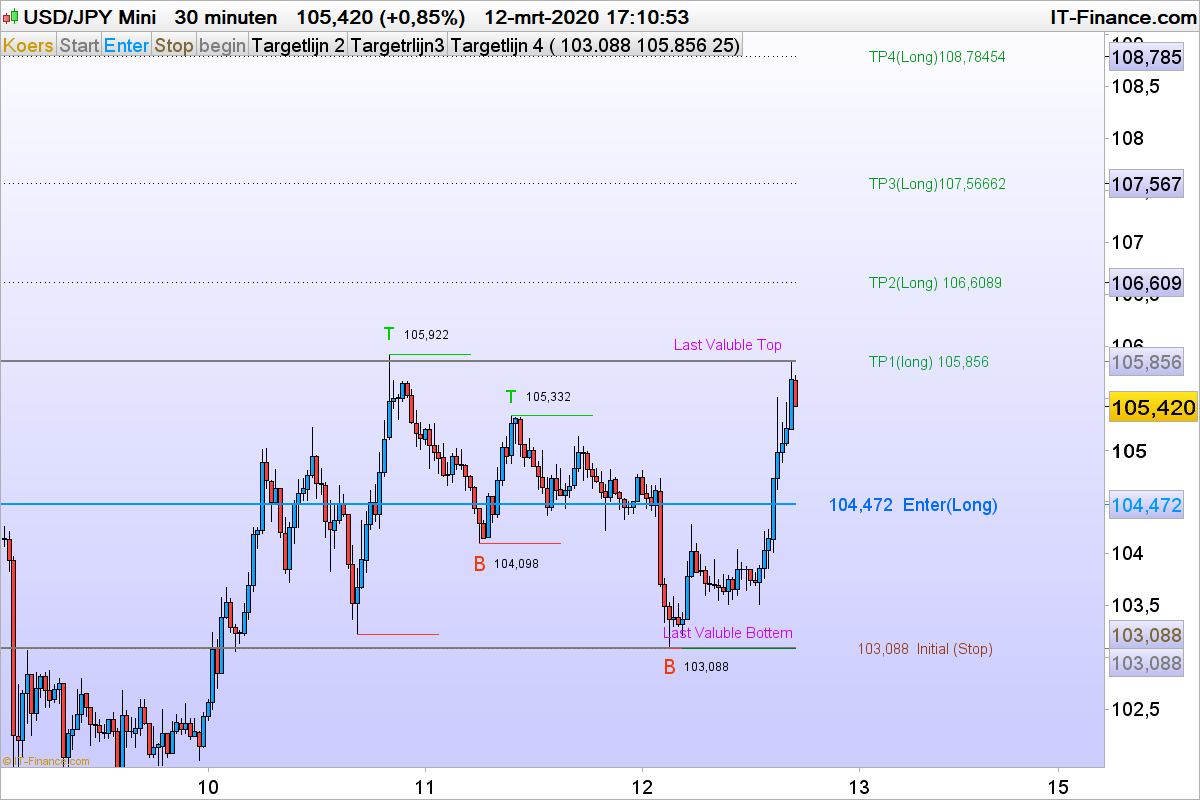
    It is working already, but if I see that there will be a new top, I need to wait till the new top is formed and then fill in the value as a Indicator Parameter.

    In the topic 50% Retrace I show 3 indicators:

    1.  LongTrade Intention (Showing: Entry, stop and targets)
    2.  ShortTrade Intention (Showing: Entry, Stop and targets)
    3.  Top – Bottem 3.0 (PreviousTop; PreviousBotten)
    USDJPY-30-minuten.png USDJPY-30-minuten.png
    #121952 quote
    ZigoZigo
    Participant
    Master
    Defparam DRAWONLASTBARONLY =true
    defparam CALCULATEONLASTBARS = 300
    
    once r=25
    
    Top=t
    Bodem=b
    V=top-bodem
    
    // instappen
    EL=b+0.50*v
    DRAWTEXT("                                               #el# Enter(Long)", barindex, el,dialog, standard, 18)coloured(0,105,255,255)
    
    st=b
    DRAWSEGMENT(barindex, st, barindex[r], st)coloured(0,125,25,255)
    DRAWTEXT("                                                                 #b# Initial (Stop)", barindex, St,dialog,standard,15)coloured(150,55,25,255)
    
    TP0=t
    Drawtext("Last Valuble Top", barindex[15],1.0015*TP0, dialog,standard, 15)coloured(205,0,255,255)
    
    TP1=b+v
    DRAWTEXT("                                                                    TP1(long) #TP1#", barindex, TP1, dialog, standard, 15)coloured(0,155,50,255)
    
    TP2=b+1.272*V
    DRAWTEXT("                                                                       TP2(Long) #TP2#", barindex,TP2, dialog,standard,15)coloured(0,155,20,255)
    
    TP3=b+1.618*v
    DRAWTEXT("                                                                        TP3(Long)#TP3#", barindex,TP3, dialog, standard,15)coloured(0,155,25,255)
    
    TP4= B+2.058*v
    DRAWTEXT("                                                                        TP4(Long)#TP4#", barindex, TP4, dialog, standard,15)coloured(0,155,25,255)
    
    begin=bodem
    Drawtext("Last Valuble Bottem", barindex[15],1.0015* begin, dialog,standard, 15)coloured(205,0,255,255)
    
    return begin coloured(125,125,125,255)style(line,2)as "Start", El coloured(0,155,250,255)style(line,2) as"Enter", St coloured(125,105,55,255)as"Stop",TP0 coloured(125,125,125,255)style(line, 2)as"begin", TP2 as"Targetlijn 2", TP3 as"Targetrlijn3", TP4 as"Targetlijn 4"
    #121953 quote
    ZigoZigo
    Participant
    Master
    Defparam DRAWONLASTBARONLY =true
    defparam CALCULATEONLASTBARS = 300
    
    top=t
    bodem=b
    V=top-bodem
    
    // instappen
    ESH=B+0.5*v
    DRAWHLINE(ESH)
    
    DRAWTEXT("                                        EnterShort=#ESH#", barindex, f*ESH ,dialog, standard, 25)coloured(55,155,250,255)
    
    st2=B+v
    DRAWSEGMENT(barindex[p], st2, barindex[q], st2)coloured(255,55,0,255)
    DRAWTEXT("                                        StopShort=#st2#", barindex, ST2, dialog, standard, 15)coloured(255,55,0,255)
    
    TP0=b
    DRAWSEGMENT(barindex[r],TP0, barindex[q], TP0)coloured(125,125,125,255)
    Drawtext("                                         Lowest=#b#", barindex[21], f*TP0, dialog,standard, 15)coloured(155,155,155,255)
    
    TPSH1=b
    
    DRAWSEGMENT(barindex[p], TPSH1, barindex[q], TPSH1)coloured(255,55,0,255)
    DRAWTEXT("                                       TP 1(Sh)=#TPSH1#", barindex, TPSH1,dialog, standard,15)coloured(255,55,0,255)
    
    TPSH2=t-1.272*V
    DRAWSEGMENT(barindex[p], TPSH2, barindex[q], TPSH2)coloured(255,55,0,255)
    DRAWTEXT("                                          TP 2(Sh)=#TPSH2#", barindex, TPSH2, dialog, standard, 15)coloured(255,55,0,255)
    
    TPSH3= t-1.618*v
    DRAWSEGMENT(barindex[p], TPSH3, barindex[q], TPSH3)coloured(255,55,0,255)
    DRAWTEXT("                                          TP 3(Sh)=#TPSH3#", barindex, TPSH3, dialog, standard, 15)coloured(255,55,0,255)
    
    TPSH4= 2.058-Target4*v
    DRAWSEGMENT(barindex[p], TPSH4, barindex[q], TPSH4)coloured(255,55,0,255)
    DRAWTEXT("                                          TP 4(Sh)=#TPSH4#", barindex, TPSH4, dialog, standard, 15)coloured(255,55,0,255)
    
    begin=top
    DRAWSEGMENT(barindex[r-(round(r/2))],top, barindex[q], top)coloured(125,125,125,255)
    Drawtext("                                         Highest#begin#", barindex[21],f* begin, dialog,Standard, 15)coloured(155,155,155,255)
    
    return top coloured(125,125,125,255)style(dottedline,1)as"Hoogste", ST2 coloured(205,155,55,255)style(dottedline,1) as"StopLoss", ESH coloured(55,55,255,255)style(dottedline,1) as"EnterShort", TPSH1 coloured(0,105,205,255)style(dottedline,1) as"Targetline 1", TPSH2 coloured(0,155,205,255)style(dottedline,1) as"Targetline 2", TPSH3 coloured(0,155,205,255)style(dottedline,1) as"Targetline 3", TPSH4 coloured(0,155,205,255)style(dottedline,1) as"Targetline 4", TP0 coloured(125,125,125,255)style(dottedline,1)as "bodem"
    #121954 quote
    ZigoZigo
    Participant
    Master
    once n = 7
    
    
    once lastpoint = 0
    
    if High[n] >= highest[2*n+1](high) then
    LH = 1
    Topy = High[n]
    Topx = barindex[n]
    
    //Previous Top
    
    PT=highest[n+1](high)
    DRAWSEGMENT(barindex, PT, barindex[n], PT)coloured(0,205,0,255)
    elsif Low[n] <= lowest[2*n+1](low)  then
    LL = -1
    Bottemy = low[n]
    Bottemx = barindex[n]
    PB=lowest[n+1](low)
    DRAWSEGMENT(barindex, PB, barindex[n], PB)coloured(255,55,55,255)
    else
    LL = 0
    LH = 0
    endif
    if LH>0 and (lastpoint=-1 or lastpoint=0) then
    DRAWTEXT("T",TOPx,TOPy+0.618*AverageTrueRange[14](close),Dialog,standard,18) coloured(0,205,0,255)
    DRAWTEXT("                          #PT#",topx,Topy+0.61*AverageTrueRange[14](close), Dialog,standard,12)
    lastpoint = 1
    lastX = TOPx
    lastY = TOPy
    
    endif
    
    if LL<0 and (lastpoint=1 or lastpoint=0) then
    DRAWTEXT("B",Bottemx,Bottemy-0.618*AverageTrueRange[14](close),Dialog,standard, 20) coloured(251,55,0,255)
    DRAWTEXT("                          #PB#", Bottemx, bottemy-0.618*AverageTrueRange[14](close), Dialog,standard, 12)
    lastpoint = -1
    lastX = Bottemx
    lastY = Bottemy
    endif
    
    RETURN lastX as"Last Top", LastY as "Last Bottem", PT as "Previous Top",PB as "Previous Bottem"
    #121955 quote
    ZigoZigo
    Participant
    Master

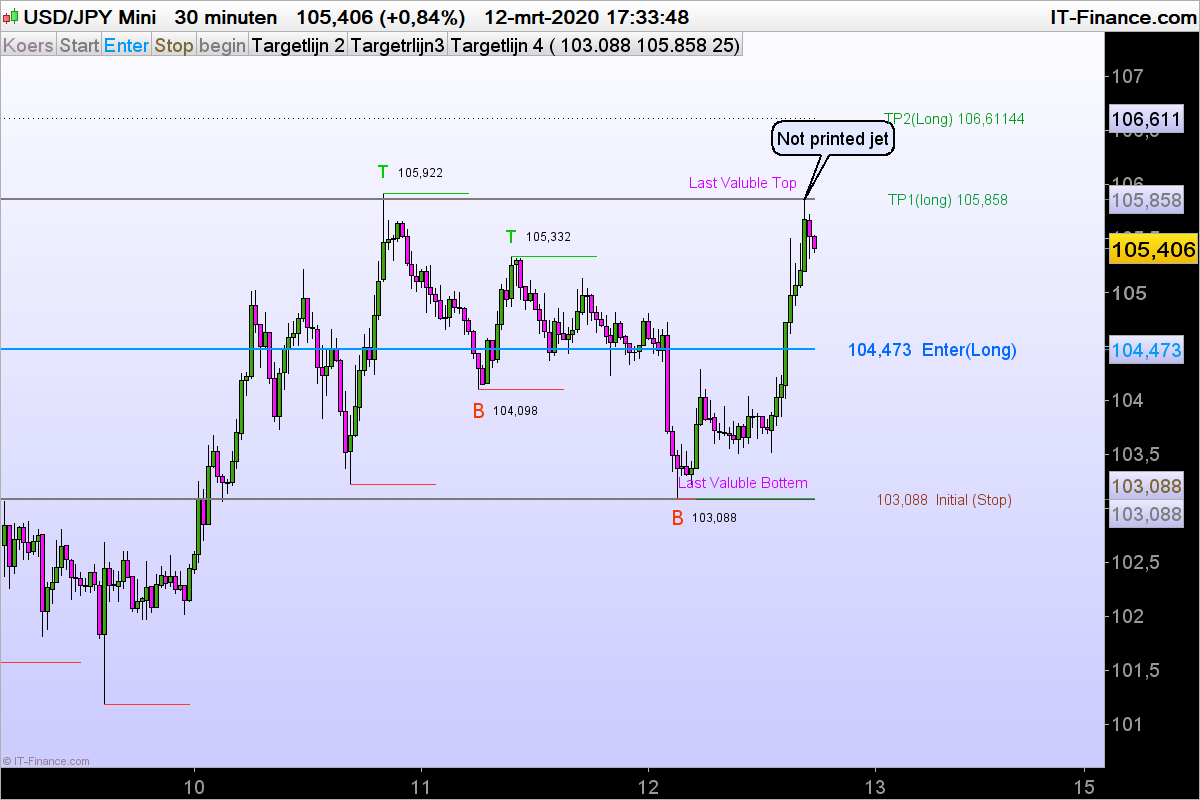
    The attachement will show you indicator 1 and 3. The last Top will be printed after (in this case) 7 bars.

    USDJPY-30-minuten-1.png USDJPY-30-minuten-1.png
    #121962 quote
    ZigoZigo
    Participant
    Master

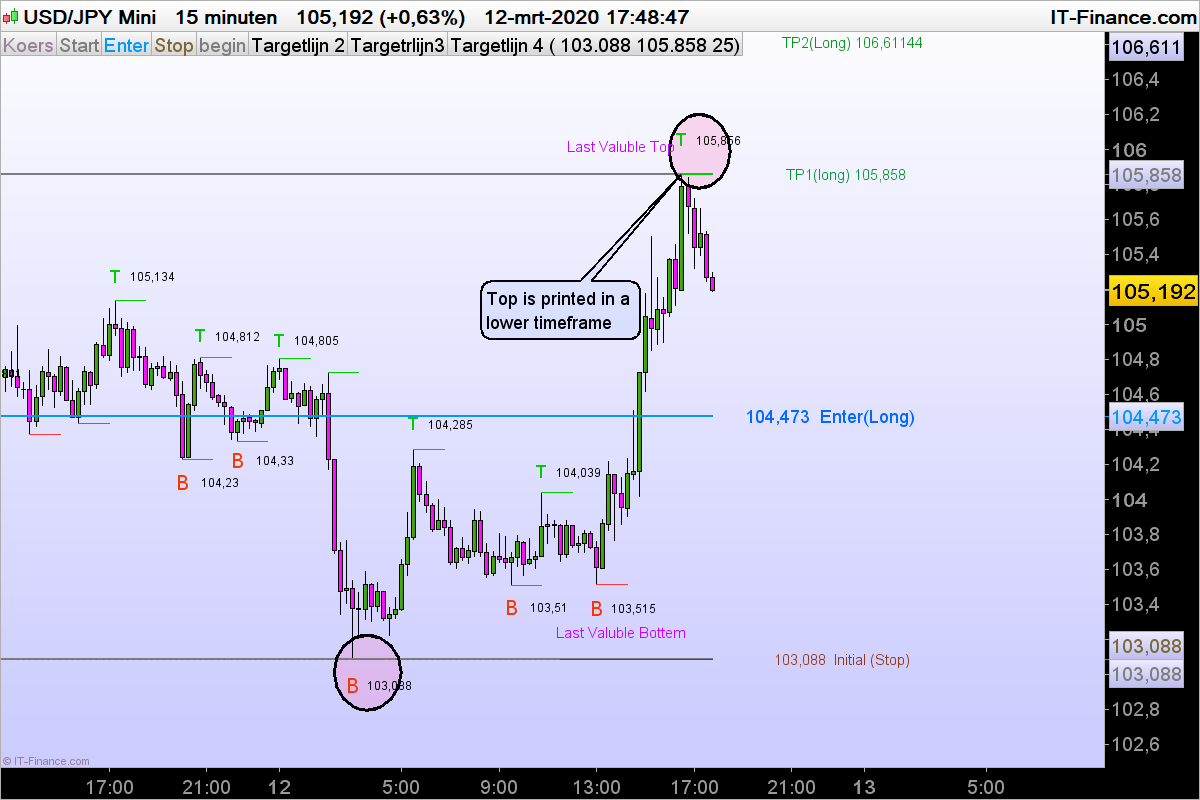
    The top is printed in a lower timeframe

    USDJPY-15-minuten.png USDJPY-15-minuten.png
Viewing 6 posts - 1 through 6 (of 6 total)
  • You must be logged in to reply to this topic.

ProRealAI ProRealAI New

Stuck on this ProBuilder code?

Describe what this topic is trying to build, in plain English, and ProRealAI writes the ProRealTime™ indicator, screener or system for you.

Available in 7 languages
Try ProRealAI

Wanted help to integrate two Indicators


ProBuilder: Indicators & Custom Tools

New Reply
Author
author-avatar
Zigo @zigo Participant
Summary

This topic contains 5 replies,
has 1 voice, and was last updated by ZigoZigo

6 years, 6 months ago.

Topic Details
Forum: ProBuilder: Indicators & Custom Tools
Language: English
Started: 03/12/2020
Status: Active
Attachments: 3 files
ProRealCode ProRealCode
Loading...