Volume Bear Bull Gabri 100

Viewing 12 posts - 1 through 12 (of 12 total)

  • Author
    Posts
  • #62763 quote
    supertitisupertiti
    Participant
    Master

    Bonsoir à tous

    Je met un graphe reflétant ce que je souhaiterais, c’est à dire garder les histogrammes tels quels ( couleurs ) mais les ramener sur une échelle de 0 à 100.

    Je le fais ici car dans la librairie je n’arrive pas à poster une image.

    l’idée c’est de voir la tendance en suivant le point de jonction des histogrammes verts et rouges.

    good evening everyone

    I put a graph reflecting what I would like, that is to say, keep the histograms as they are (colors) but bring them back to a scale of 0 to 100.

    I do it here because in the bookstore I can not post an image.

    the idea is to see the trend by following the junction point of the green and red histograms.

    Alai-n thanked this post
    histo-vol-100.jpg histo-vol-100.jpg
    #62768 quote
    gabrigabri
    Participant
    Master

    Try this


    period=22


    if close>=open then
    greenbarcount=1
    greenvolume=volume
    redbarcount=0
    redvolume=0
    else
    greenbarcount=0
    greenvolume=0
    redbarcount=1
    redvolume=volume
    endif
    //media volumi rossi e verdi per media mobile semplice
    mmred=summation[period](redvolume)/summation[period](redbarcount)
    mmgreen=summation[period](greenvolume)/summation[period](greenbarcount)
    
    
    den=mmred+mmgreen
    
    if den<>0 then
    rapp=100*mmred/den
    massimo=100
    else
    rapp=0
    massimo=0
    endif
    
    return massimo coloured (0,210,0) style (histogram), rapp coloured (210,0,0) style (histogram),50
    #62829 quote
    supertitisupertiti
    Participant
    Master


    Hello Gabri

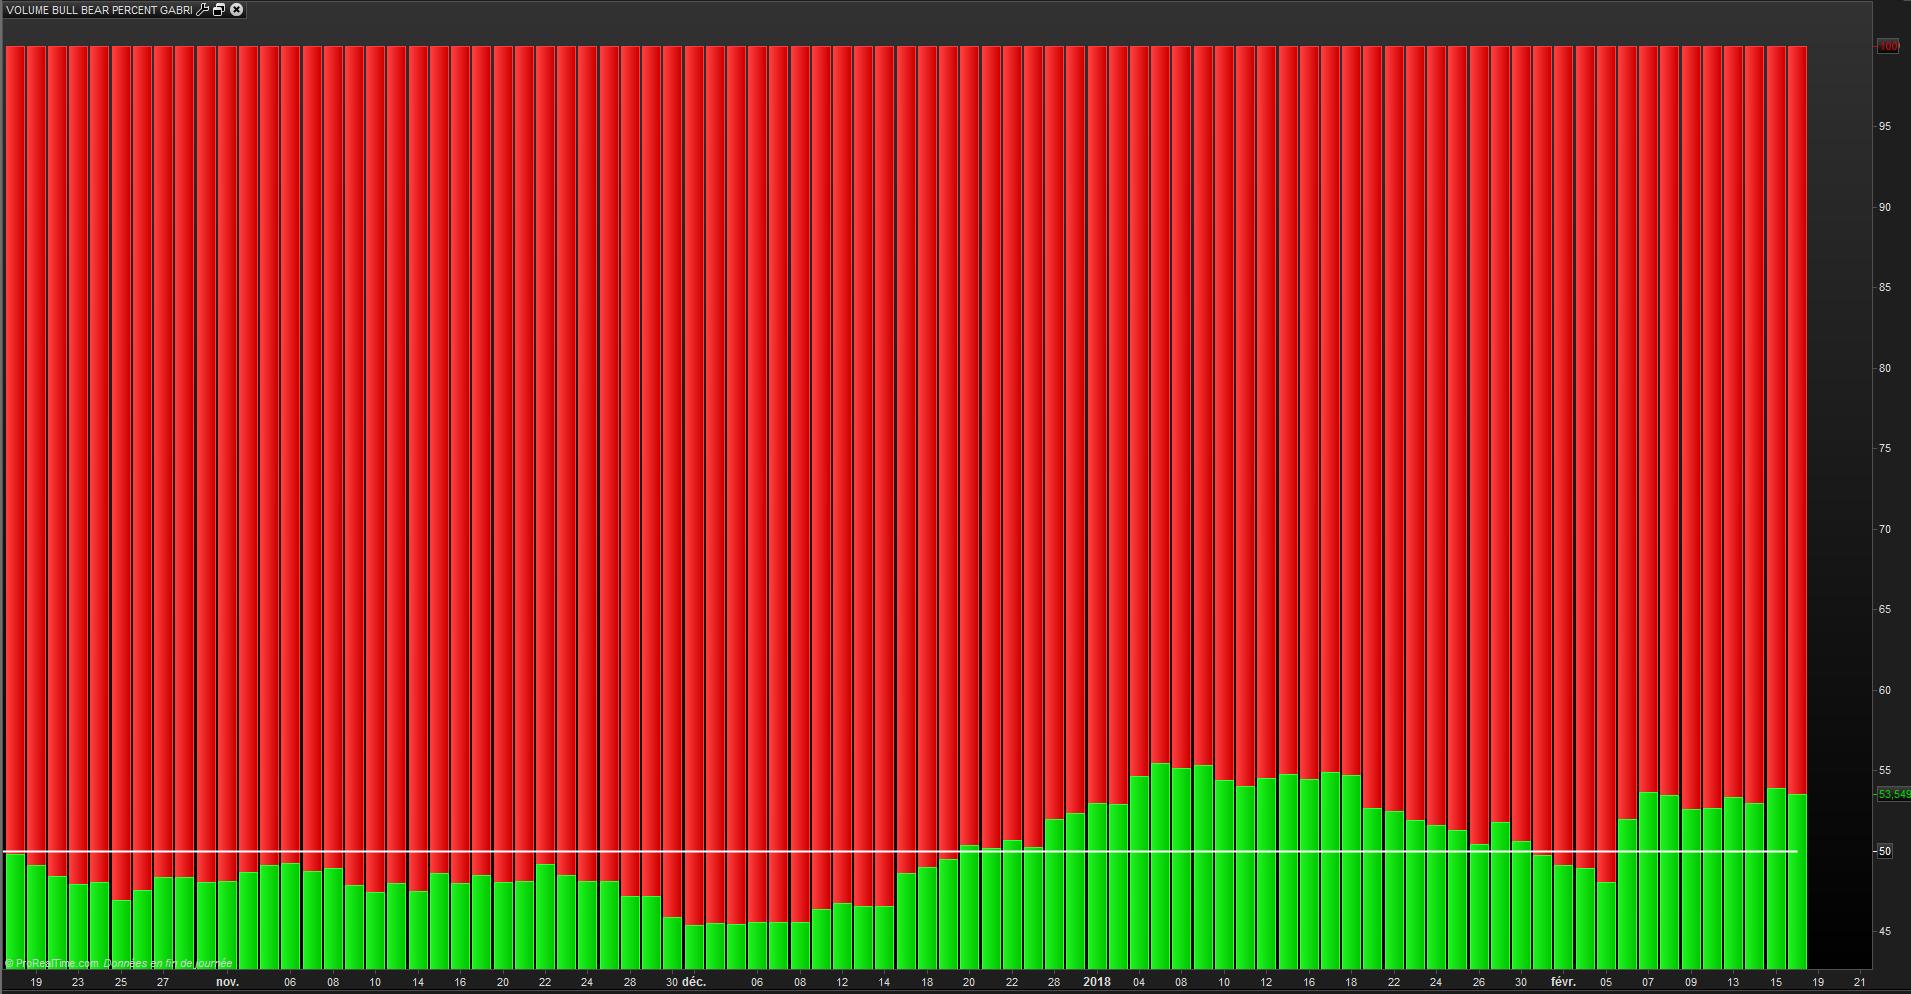
    The code corresponds to what I wanted. I took as reference period “period” = 11.

    One more thing: is it possible to have the green histograms at the bottom and the red ones at the top?

    thank you very much for your help.

    VOL-BEAR-BULL-GABRI.jpg VOL-BEAR-BULL-GABRI.jpg
    #62831 quote
    supertitisupertiti
    Participant
    Master

    Bonjour Gabri Le code correspond bien à ce que je souhaitais. J’ai pris comme période de référence “period”=11.

    Encore une chose : est-il possible d’avoir les histogrammes verts en bas et les rouges en haut ?

    merci beaucoup pour ton aide.

    Hello Gabri

    The code corresponds to what I wanted. I took as reference period “period” = 11.

    One more thing: is it possible to have the green histograms at the bottom and the red ones at the top?

    thank you very much for your help.

    #62849 quote
    gabrigabri
    Participant
    Master
    
    
    if den<>0 then
    rapp=100*mmgreen/den
    massimo=100
    else
    rapp=0
    massimo=0
    endif
     
    return rapp coloured (0,210,0) style (histogram), massimo coloured (210,0,0) style (histogram),50

    Try this

    #62859 quote
    supertitisupertiti
    Participant
    Master

    hi Gabri

    All the histogram are red !

    #62865 quote
    gabrigabri
    Participant
    Master

    Did you change only the lines between 23 to 31 from the original code?

    #62912 quote
    supertitisupertiti
    Participant
    Master

    Yes I only change this lines : 23 to 31

    #62915 quote
    NicolasNicolas
    Keymaster
    Legend

    @supertiti

    Please speak english in this thread, I spent a lot of time deleting all your french text … 👿

    #62946 quote
    gabrigabri
    Participant
    Master

    My bad, it was the order of the input, sorry now it should work!!

    period=22


    if close>=open then
    greenbarcount=1
    greenvolume=volume
    redbarcount=0
    redvolume=0
    else
    greenbarcount=0
    greenvolume=0
    redbarcount=1
    redvolume=volume
    endif
    //media volumi rossi e verdi per media mobile semplice
    mmred=summation[period](redvolume)/summation[period](redbarcount)
    mmgreen=summation[period](greenvolume)/summation[period](greenbarcount)
     
     
    den=mmred+mmgreen
    
    if den<>0 then
    rapp=100*mmgreen/den
    massimo=100
    else
    rapp=0
    massimo=0
    endif
     
    return massimo coloured (210,0,0) style (histogram),rapp coloured (0,210,0) style (histogram), 50
    #62965 quote
    supertitisupertiti
    Participant
    Master

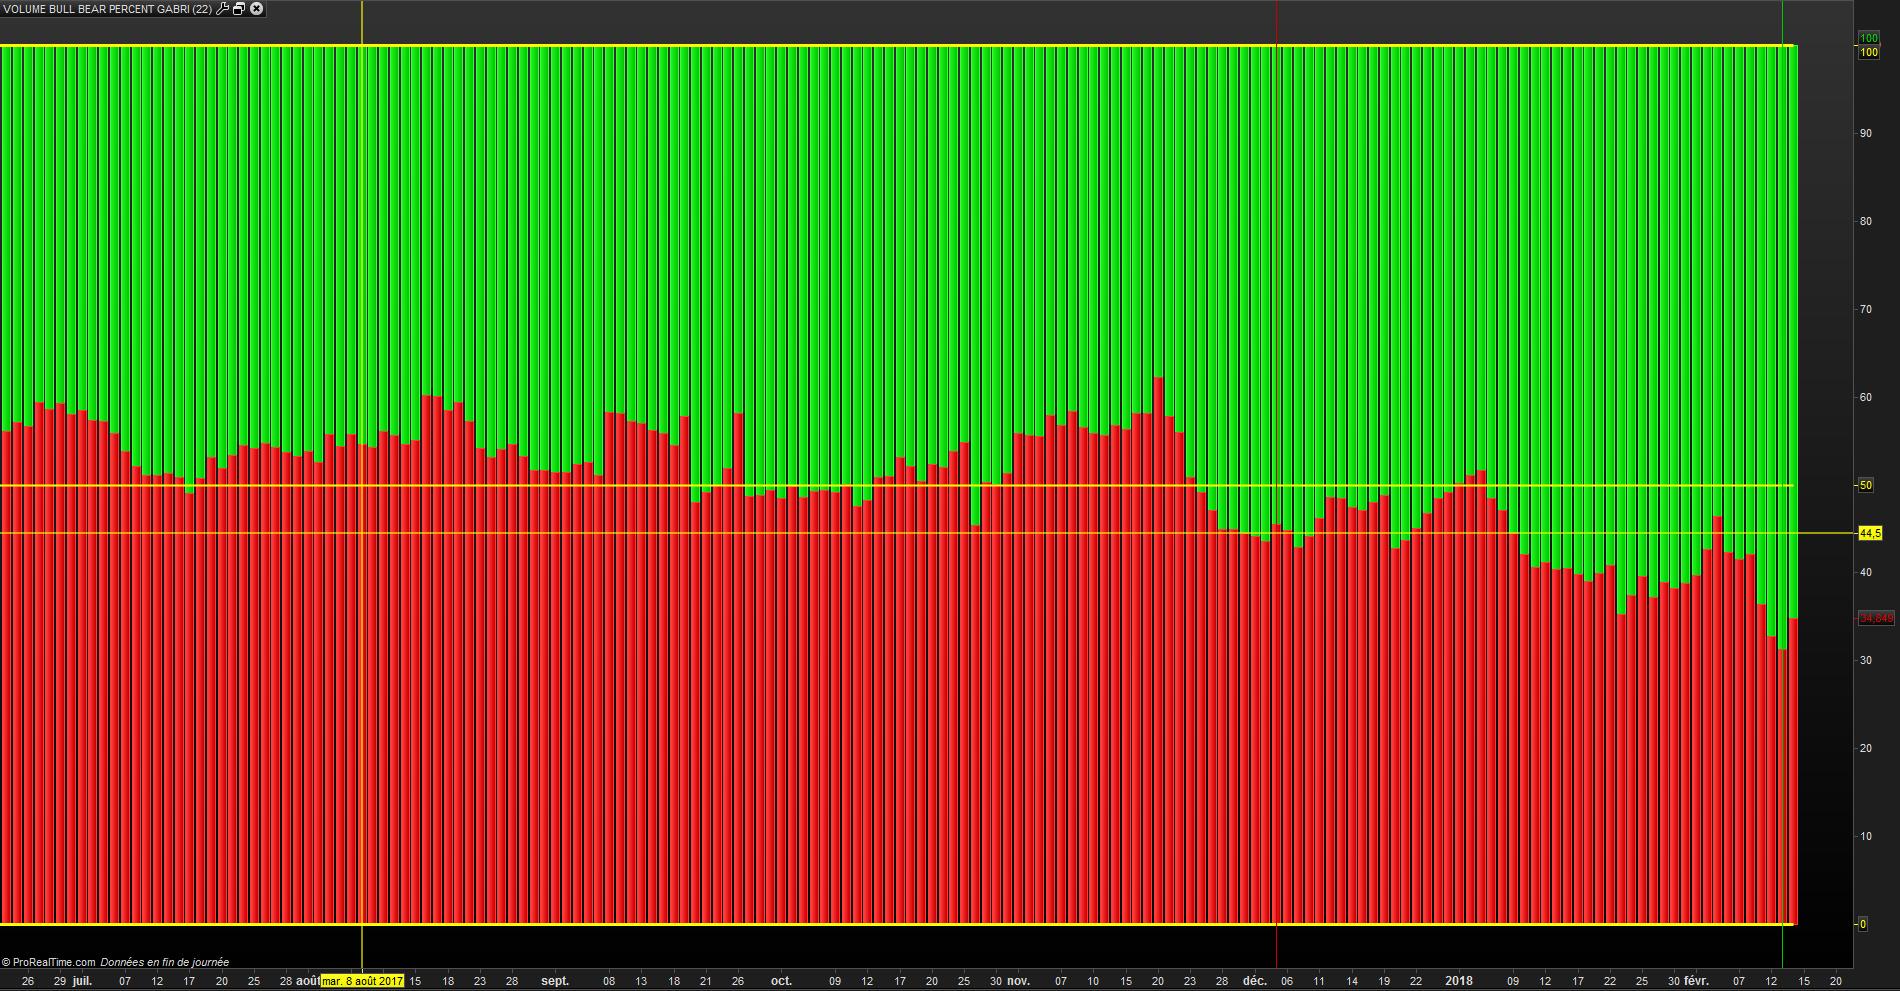
    <span id=”result_box” class=”” lang=”en”>Great ! <span class=””>exactly what I wanted</span>

    <span class=””>a big thank you Gabri</span>

    <span class=””>I attach a graph of the CAC40</span>

    <span class=””>have a nice week end</span></span>

    VOL-GABRI-OK.jpg VOL-GABRI-OK.jpg
    #62998 quote
    gabrigabri
    Participant
    Master

    Bullish volumes, bullish trend on the long but re-accumulation is ongoing….

Viewing 12 posts - 1 through 12 (of 12 total)
  • You must be logged in to reply to this topic.

ProRealAI ProRealAI New

Stuck on this ProBuilder code?

Describe what this topic is trying to build, in plain English, and ProRealAI writes the ProRealTime™ indicator, screener or system for you.

Available in 7 languages
Try ProRealAI

Volume Bear Bull Gabri 100


ProBuilder: Indicators & Custom Tools

New Reply
Author
author-avatar
supertiti @supertiti Participant
Summary

This topic contains 11 replies,
has 3 voices, and was last updated by gabrigabri

8 years, 7 months ago.

Topic Details
Forum: ProBuilder: Indicators & Custom Tools
Language: English
Started: 02/14/2018
Status: Active
Attachments: 3 files
ProRealCode ProRealCode
Loading...