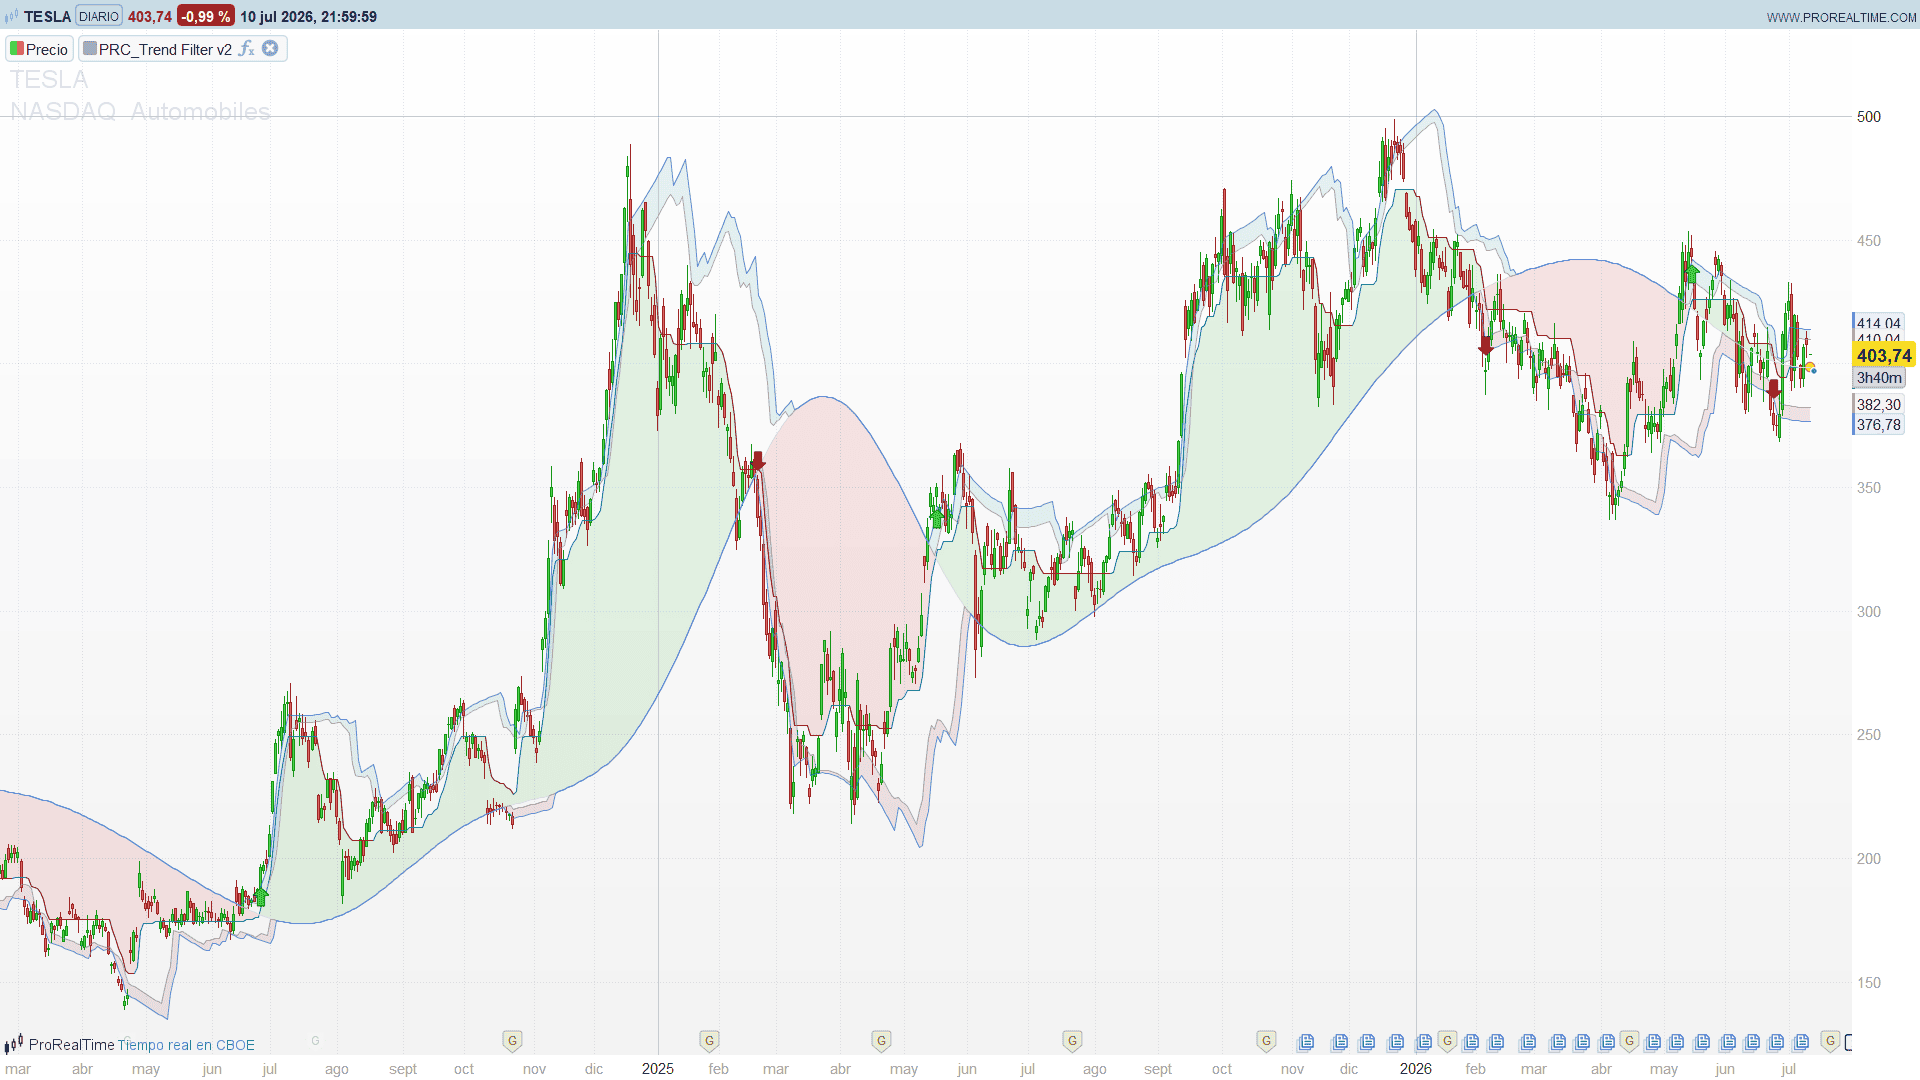
Good morning dears,
I found another interesting indicator on TW—especially regarding its "wave-like" moving average, but also the signals.
If possible, I’d like to have a version of it that works on our platform... can you help me?
here i copy the link:
https://www.tradingview.com/script/SPa7FILs-Trend-filter-v2-Jamallo/
and here there is the code:
//@version=5
// The K Line in this indicator applies a composite exponential-Gaussian kernel
// to a Vervoort Stop output (not raw price, unlike the ENW indicator).
// The kernel is NOT a true Nadaraya–Watson regression, NOT a true wavelet transform.
// It is a dual-kernel weighted MA:
// – Exponential recency decay (inspired by NW exponential kernel)
// – Center-biased Gaussian spatial envelope (inspired by Gaussian wavelet window)
// Bands use percentile ranking of price deviation from K line,
// replacing the fixed deviation scaling used in the ENW indicator.
indicator(“Trend filter v2 [Jamallo]”, overlay=true)
// =============================================================================
// INPUTS
// =============================================================================
// — A Line (Vervoort Stop) ————————————————
group_a = “A Line”
vPeriod = input.int(100, “ATR Period”, minval=1, group=group_a)
vMultiplier = input.float(1.0, “ATR Multiplier”, minval=0.1, step=0.1, group=group_a)
// — K Line (Vervoort Stop + Kernel) —————————————
group_k = “K Line”
vPeriodSignal = input.int(100, “ATR Period”, minval=1, group=group_k)
vMultiplierSignal = input.float(2.0, “ATR Multiplier”, minval=0.1, step=0.1, group=group_k)
kernelLenK = input.int(100, “Kernel Length”, minval=5, maxval=200, group=group_k)
kernelAlphaK = input.float(0.3, “Kernel Alpha”, minval=0.1, maxval=100, step=0.1, group=group_k)
// — Percentile Bands ——————————————————
group_pct = “Percentile Bands”
percentilePeriod = input.int(14, “Lookback”, minval=10, group=group_pct)
upperPercentile = input.int(80, “Inner Upper”, minval=50, maxval=99, group=group_pct)
lowerPercentile = input.int(80, “Inner Lower”, minval=50, maxval=99, group=group_pct)
outerUpperPercentile = input.int(95, “Outer Upper”, minval=50, maxval=99, group=group_pct)
outerLowerPercentile = input.int(95, “Outer Lower”, minval=50, maxval=99, group=group_pct)
// — A Line Coloring ——————————————————-
group_colors = “A Line Coloring”
colorCodeVervoort = input.bool(true, “Color Code”, group=group_colors)
bull_col = input.color(color.teal, “Bull”, inline=”c”, group=group_colors)
bear_col = input.color(color.maroon, “Bear”, inline=”c”, group=group_colors)
neutral_col = input.color(color.blue, “Neutral”, inline=”c”, group=group_colors)
// — Display —————————————————————
group_display = “Display”
showALine = input.bool(true, “A Line”, group=group_display)
showKLine = input.bool(true, “K Line”, group=group_display)
showRangeBands = input.bool(true, “Inner Bands”, group=group_display)
showOuterBands = input.bool(true, “Outer Bands”, group=group_display)
showAKCross = input.bool(true, “A/K Cross Signals”, group=group_display)
showTrendFill = input.bool(true, “Background Fill”, group=group_display)
// =============================================================================
// HEIKIN ASHI SMOOTHED PRICE
// =============================================================================
var float haClose = na
var float haOpen = na
haClose := (open + high + low + close) / 4.0
haOpen := na(haOpen[1]) ? (open + close) / 2.0 : (haOpen[1] + haClose[1]) / 2.0
haHigh = math.max(high, math.max(haOpen, haClose))
haLow = math.min(low, math.min(haOpen, haClose))
haPrice = (haOpen + haHigh + haLow + haClose) / 4.0
// =============================================================================
// VERVOORT STOP FUNCTION
// =============================================================================
f_vervoort(int period, float multiplier) =>
v_atr = ta.atr(period)
loss = multiplier * v_atr
var float v_stop = 0.0
var bool trend_is_up = true
if bar_index == 0
v_stop := haClose – loss
trend_is_up := true
else
float prev_v_stop = nz(v_stop[1], haClose – loss)
trend_is_up := haClose > prev_v_stop
if trend_is_up
v_stop := math.max(prev_v_stop, haPrice – loss)
else
v_stop := math.min(prev_v_stop, haPrice + loss)
if trend_is_up and haClose < v_stop
trend_is_up := false
v_stop := haPrice + loss
else if not trend_is_up and haClose > v_stop
trend_is_up := true
v_stop := haPrice – loss
v_stop
// =============================================================================
// COMPOSITE KERNEL FUNCTION
// =============================================================================
f_compositeKernel(series float src, int len, float alpha) =>
float sum = 0.0
float weightSum = 0.0
float center = len / 2.0
for i = 0 to len – 1
float x = float(i)
float price = src[len – 1 – i]
float dist = math.abs(x – center)
float recencyWeight = math.exp(-alpha * (len – 1 – i) / len)
float localWeight = math.exp(-math.pow(dist / (len / 3), 2))
float weight = recencyWeight * localWeight
sum += price * weight
weightSum += weight
weightSum > 0 ? sum / weightSum : src
// =============================================================================
// CALCULATIONS
// =============================================================================
float a = f_vervoort(vPeriod, vMultiplier)
float k_raw = f_vervoort(vPeriodSignal, vMultiplierSignal)
float k = f_compositeKernel(k_raw, kernelLenK, kernelAlphaK)
// =============================================================================
// A LINE COLORING LOGIC
// =============================================================================
var int trendState = 0
aLineSlope = a – nz(a[1], a)
if haClose > a and aLineSlope > 0
trendState := 1
else if haClose < a and aLineSlope < 0
trendState := -1
line_color_complex = colorCodeVervoort ? (trendState == 1 ? bull_col : trendState == -1 ? bear_col : neutral_col) : neutral_col
// =============================================================================
// PERCENTILE BANDS
// =============================================================================
deviationUp = math.max(haPrice – k, 0)
deviationDown = math.max(k – haPrice, 0)
upperThreshold = ta.percentile_nearest_rank(deviationUp, percentilePeriod, upperPercentile)
lowerThreshold = ta.percentile_nearest_rank(deviationDown, percentilePeriod, lowerPercentile)
upperThreshold2 = ta.percentile_nearest_rank(deviationUp, percentilePeriod, outerUpperPercentile)
lowerThreshold2 = ta.percentile_nearest_rank(deviationDown, percentilePeriod, outerLowerPercentile)
upper = k + upperThreshold
lower = k – lowerThreshold
upper2 = k + upperThreshold2
lower2 = k – lowerThreshold2
// =============================================================================
// PLOTTING
// =============================================================================
kColor = color.new(color.white, 30)
outerColor = color.new(color.blue, 50)
innerBandColor = color.new(color.gray, 50)
trendFillSimple = showTrendFill ? (a > k ? color.new(color.green, 95) : color.new(color.red, 95)) : na
upperBandFill = color.new(#008080, 90)
lowerBandFill = color.new(#800020, 90)
aPlot = plot(showALine ? a : na, “A Line (Vervoort)”, color=line_color_complex, linewidth=1)
kPlot = plot(showKLine ? k : na, “K Line (Vervoort + Kernel)”, color=kColor, linewidth=1)
upperPlot = plot(showRangeBands ? upper : na, “Upper Band”, color=innerBandColor, linewidth=1)
lowerPlot = plot(showRangeBands ? lower : na, “Lower Band”, color=innerBandColor, linewidth=1)
upper2Plot = plot(showOuterBands ? upper2 : na, “Outer Upper Band”, color=outerColor, linewidth=1)
lower2Plot = plot(showOuterBands ? lower2 : na, “Outer Lower Band”, color=outerColor, linewidth=1)
fill(aPlot, kPlot, color=trendFillSimple, title=”Trend Fill”)
fill(upper2Plot, upperPlot, color=upperBandFill, title=”Upper Band Fill”)
fill(lowerPlot, lower2Plot, color=lowerBandFill, title=”Lower Band Fill”)
// Signals
longSignal = ta.crossover(a, k)
shortSignal = ta.crossunder(a, k)
plotshape(showAKCross and longSignal, “Long Signal”, shape.triangleup, location.belowbar, color.new(color.green, 0), size=size.small)
plotshape(showAKCross and shortSignal, “Short Signal”, shape.triangledown, location.abovebar, color.new(color.red, 0), size=size.small)
————————————————————————————————————————————————————————————-Thank you and have a good, fresh Sunday!