Translate indicators please.

Viewing 11 posts - 1 through 11 (of 11 total)

  • Author
    Posts
  • #203557 quote
    LinkLink
    Participant
    Senior

    Good.


    I would like to translate this indicator code(s) into prorealtime language.

    #203558 quote
    LinkLink
    Participant
    Senior

    //

    // @author Jadbrother modified by gero modified by ChaosTrader63

    //

    //@version=3

    // @BGColor mod by goku972

    study(title = “RCI 3 Lines”, shorttitle = “RCI3lines+BG”)

    itvs = input(9, “short interval”)

    itvm = input(26, “middle interval”)

    itvl = input(52, “long interval”)

    lengthSlope = input(1)

    src = input(close, “source”)

    upperband=input(title=”High line[%]”,defval=80,type=integer)

    lowerband=input(title=”Low line[%]”,defval=-80,type=integer)

    middleband=input(title=”Middle line[%]”,defval=-0,type=integer)

    ord(seq, idx, itv) =>

    p = seq[idx]

    o = 1

    s = 0

    for i = 0 to itv – 1

    if p < seq[i]

    o := o + 1

    else

    if p == seq[i]

    s := s+1

    o+(s-1)/2.0

    o

    d(itv) =>

    sum = 0.0

    for i = 0 to itv – 1

    sum := sum + pow((i + 1) – ord(src, i, itv), 2)

    sum

    rci(itv) => (1.0 – 6.0 * d(itv) / (itv * (itv * itv – 1.0))) * 100.0

    hline(upperband,color=red,linestyle=dashed)

    hline(lowerband,color=red,linestyle=dashed)

    hline(middleband,color=green,linestyle=dashed)

    plot(rci(itvs), title = “RCI short”, color = red)

    plot(rci(itvm), title = “RCI middle”, color = blue)

    plot(rci(itvl), title = “RCI long”, color = green)

    //BG Color by RCI Long Line

    //bgcolor(falling(rci(itvl), lengthSlope) ? maroon : (rising(rci(itvl), lengthSlope) ? green : black), transp=70)

    //BG Color by RCI Middle Line

    //bgcolor(falling(rci(itvm), lengthSlope) ? maroon : (rising(rci(itvm), lengthSlope) ? green : black), transp=70)

    //BG Color by RCI Short Line

    bgcolor(falling(rci(itvs), lengthSlope) ? maroon : (rising(rci(itvs), lengthSlope) ? green : black), transp=70)

    #203559 quote
    LinkLink
    Participant
    Senior

    //

    // @author Jadbrother modified by gero, optimized by yuza

    //

    //@version=3

    study(title = “RCI3lines optimized”, shorttitle = “RCI3lines opt”)

    itvs = input(9, “short interval”)

    itvm = input(26, “middle interval”)

    itvl = input(52, “long interval”)

    src = input(close, “source”)

    res = input(9, “resolution”, minval=9)

    upperband=input(title=”High line[%]”,defval=80,type=integer)

    lowerband=input(title=”Low line[%]”,defval=-80,type=integer)

    dmul = 600 / res / (res*res-1)

    ord(seq, idx, itv) =>

    p = seq[idx]

    o = 0.5

    for i = 0 to res-1

    d = (p – seq[i*itv])

    o := o + ((d<0) ? 1 : ((d==0) ? 0.5 : 0))

    o

    d(itv) =>

    sum = 0.0

    step = itv/res

    for i = 0 to res-1

    x = (i + 1) – ord(src, i*step, step)

    sum := sum + x*x

    sum

    rci(itv) => sma(100.0 – dmul * d(itv), ceil(itv/res))

    hline(upperband,color=gray,linestyle=dashed)

    hline(lowerband,color=gray,linestyle=dashed)

    plot(rci(itvs), title = “RCI short”, color = red)

    plot(rci(itvm), title = “RCI middle”, color = blue)

    plot(rci(itvl), title = “RCI long”, color = green)

    #203596 quote
    NicolasNicolas
    Keymaster
    Legend

    Please post description and screenshots, thank you.

    #203599 quote
    LinkLink
    Participant
    Senior
    #203600 quote
    LinkLink
    Participant
    Senior
    #203743 quote
    NicolasNicolas
    Keymaster
    Legend

    “Please post description and screenshots, thank you.” = please copy paste description and add pictures in our website. I can help for sure, but please lend an hand first! 😉

    #215782 quote
    nachovelhernachovelher
    Participant
    New

    Hi there,

    I’m also interested in that indicator, I think it is quite interesting. I’m sorry the guy who opened this post didn’t have better manners.

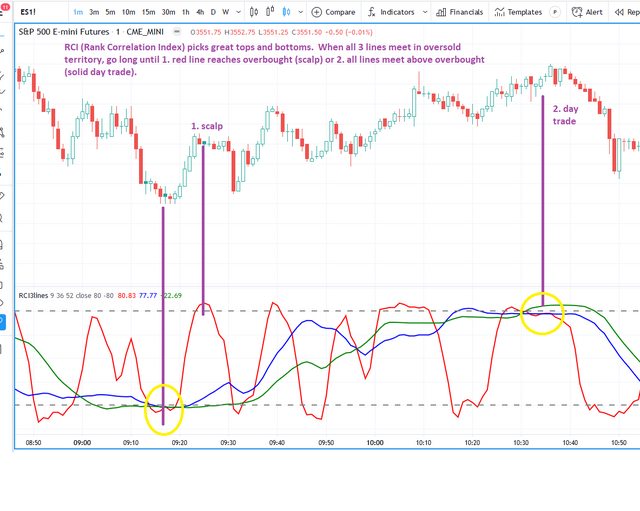
    I attach you a screenshot of the indicator, if you need something else let me know.


    Thank you,

    Nacho

    DT4SUQDl.jpg DT4SUQDl.jpg
    #216024 quote
    nachovelhernachovelher
    Participant
    New

    Hello,

    I have found this code through the web too, not sure if it can be useful to you:


    #
    # RCI_3_Lines is simply 3 instances of the Spearman indicator
    # set to lengths 9, 36 and 52.  I eliminated the Spearman Average line.
    # pieced together by @RickKennedy, thinkscript.com, 2020/11/22
    
    declare lower;
    
    input price = close;
    input length_9 = 9;
    input length_36 = 36;
    input length_52 = 52;
    input averageLength = 3;
    input over_bought = 80;
    input over_sold = -80;
    input showBreakoutSignals =yes;
    
    # instance 9 length
    assert(length_9 >= 2, "'length' must be greater than or equal to 2: " + length_9);
    
    def sumSqr9 = fold i9 = 0 to length_9 with sum9 do
    sum9 + Sqr((length_9 - i9) - fold j9 = 0 to length_9 with rank9
    do rank9 + if GetValue(price, i9, length_9 - 1) > GetValue(price, length_9 - j9 - 1) or GetValue(price, i9) == GetValue(price, length_9 - j9 - 1) and i9 <= length_9 - j9 - 1 then 1 else 0);
    
    
    # instance 36 length
    assert(length_36 >= 2, "'length' must be greater than or equal to 2: " + length_36);
    
    def sumSqr36 = fold i36 = 0 to length_36 with sum36 do
    sum36 + Sqr((length_36 - i36) - fold j36 = 0 to length_36 with rank36
    do rank36 + if GetValue(price, i36, length_36 - 1) > GetValue(price, length_36 - j36 - 1) or GetValue(price, i36) == GetValue(price, length_36 - j36 - 1) and i36 <= length_36 - j36 - 1 then 1 else 0);
    
    
    # instance 52 length
    assert(length_52 >= 2, "'length' must be greater than or equal to 2: " + length_52);
    
    def sumSqr52 = fold i52 = 0 to length_52 with sum52 do
    sum52 + Sqr((length_52 - i52) - fold j52 = 0 to length_52 with rank52
    do rank52 + if GetValue(price, i52, length_52 - 1) > GetValue(price, length_52 - j52 - 1) or GetValue(price, i52) == GetValue(price, length_52 - j52 - 1) and i52 <= length_52 - j52 - 1 then 1 else 0);
    
    
    # plots
    plot Spearman9 = 100 * (1 - 6 * sumSqr9 / (length_9 * (Sqr(length_9) - 1)));
    plot Spearman36 = 100 * (1 - 6 * sumSqr36 / (length_36 * (Sqr(length_36) - 1)));
    plot Spearman52 = 100 * (1 - 6 * sumSqr52 / (length_52 * (Sqr(length_52) - 1)));
    
    plot OverBought = over_bought;
    #plot ZeroLine = 0;
    plot OverSold = over_sold;
    
    Spearman9.SetDefaultColor(GetColor(9));
    Spearman36.SetDefaultColor(GetColor(5));
    Spearman52.SetDefaultColor(GetColor(6));
    OverBought.SetDefaultColor(GetColor(3));
    #ZeroLine.SetDefaultColor(GetColor(3));
    OverSold.SetDefaultColor(GetColor(3));
    
    Thank you
    #216102 quote
    NicolasNicolas
    Keymaster
    Legend

    I believe this is the same indicator as RCI but with 3 different periods, please see available codes here:

    https://www.prorealcode.com/topic/rci-indicator-conversion/

    #216163 quote
    nachovelhernachovelher
    Participant
    New

    Thank you Nicolas, that’s exactly what I was looking for, really appreciate it.

Viewing 11 posts - 1 through 11 (of 11 total)
  • You must be logged in to reply to this topic.

ProRealAI ProRealAI New

Stuck on this ProBuilder code?

Describe what this topic is trying to build, in plain English, and ProRealAI writes the ProRealTime™ indicator, screener or system for you.

Available in 7 languages
Try ProRealAI

Translate indicators please.


ProOrder: Automated Strategies & Backtesting

New Reply
Author
author-avatar
Link @tony-manero Participant
Summary

This topic contains 10 replies,
has 3 voices, and was last updated by nachovelhernachovelher

3 years, 3 months ago.

Topic Details
Forum: ProOrder: Automated Strategies & Backtesting
Language: English
Started: 11/04/2022
Status: Active
Attachments: 1 files
ProRealCode ProRealCode
Loading...