signals ichimoku detector

Viewing 3 posts - 1 through 3 (of 3 total)
  • Author
    Posts
  • #139624 quote
    jacquesgermainjacquesgermain
    Participant
    Veteran

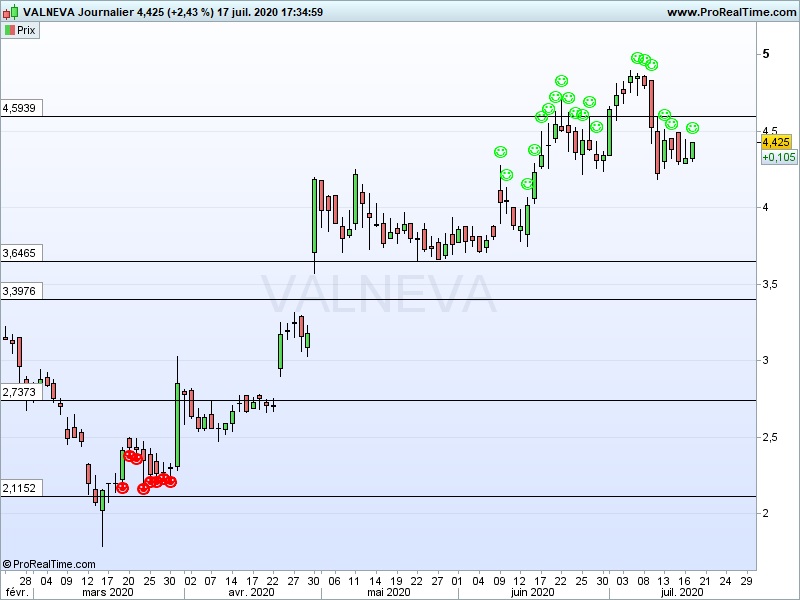
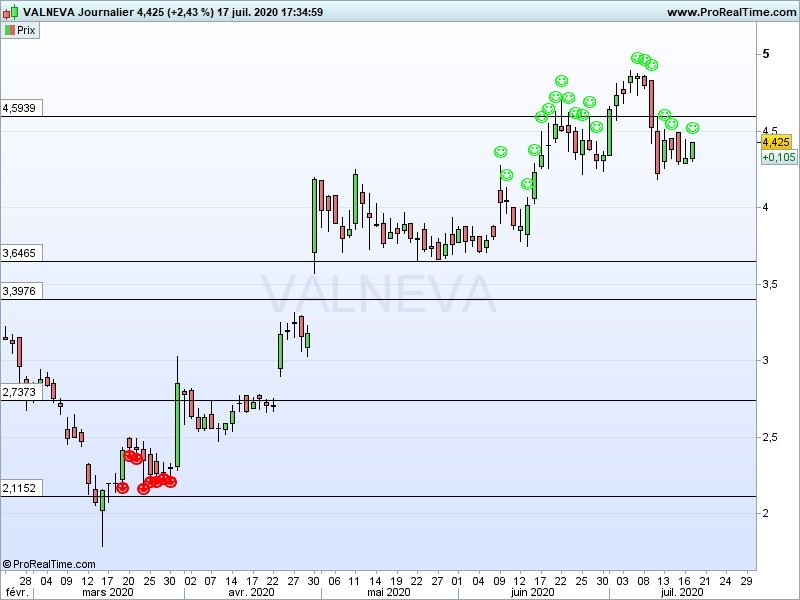
    This indicator epured to easily see when there is bullish or bearisch signs using Ichimoku :
    – BULLISH signal : GREEN”☺” when the price is above TS+above the Cloud+SMA200 > cloud

    – BEARISH signal : RED “☺” when the price is below TS+below the Cloud+SMA200 < cloud

    Thanks to cristofer ,This indicator is inspired by his work  “Ichimoku bearish screener” and “Ichimoku bullish screener”.

    signal-ichimoku-detector-15951721084l8pc.jpg signal-ichimoku-detector-15951721084l8pc.jpg signal-ichimoku-detector-15951721084l8pc1.jpg signal-ichimoku-detector-15951721084l8pc1.jpg
    #139744 quote
    NicolasNicolas
    Keymaster
    Legend

    Hi, thanks for sharing your indicator, but I can’t see any code attached to your post? Is it possible to add it in your reply please? Would be great, thanks 🙂

    #139750 quote
    jacquesgermainjacquesgermain
    Participant
    Veteran

    Hi Nicolas code attached to my post ,thank you for your excellent work !

    TS=(highest[9](high) + highest[9](low))/2
    KS=(highest[26](high) + lowest[26](low))/2
    SpanA= (ts+ks)/2
    SpanB=(highest[52](high) + lowest[52](low))/2
    Minspan=min(SpanA[26],SpanB[26])
    Maxspan=max(spanA[26],SpanB[26])
    // This checks for bullishsigns using Ichimoku
    // A very strong bullish sign is when price is above TS,
    // and price is above the Cloud,
    // and SMA200 > cloud
    
    a1= ts > ks
    b1= close > maxspan
    
    sma200 = Average[200](Close)
    
    priceOverMA = Close > sma200
    cloudOverMA = min(spanA[26], spanB[26]) > sma200
    priceOverKS = Close > KS
    
    Long = a1 AND b1 AND priceOverMA AND cloudOverMA AND priceOverKS
    If long then
    
    DRAWTEXT("☺", barindex,high+0.02*high,SansSerif,Bold,16)coloured(0,300,0)
    endif
    // This checks for bearish signs using Ichimoku
    // A very strong bearish sign is when price is bellow TS,
    // and price is bellow the Cloud,
    // and SMA200 > cloud
    TS=(highest[9](high) + highest[9](low))/2
    KS=(highest[26](high) + lowest[26](low))/2
     
    a3= ts < ks
     
    SpanA= (ts+ks)/2
    SpanB=(highest[52](high) + lowest[52](low))/2
     
    Minspan=min(spanA[26],SpanB[26])
     
    b3= close < minspan
     
    sma200 = Average[200](Close)
    priceUnderMA = sma200 > Close
    cloudUnderMA = max(spanA, spanB) < sma200
     
    priceUnderKS = Close < KS
     
    short = a3 AND b3 AND priceUnderMA AND cloudUnderMA AND priceUnderKS
    
    If Short then
    DRAWTEXT("☻", barindex,low-Low*0.02,SansSerif,Bold,16)coloured(255,0,0)
    endif
    RETURN
    Nicolas thanked this post
    signal-ichimoku-1.itf
Viewing 3 posts - 1 through 3 (of 3 total)
  • You must be logged in to reply to this topic.

ProRealAI ProRealAI New

Stuck on this ProBuilder code?

Describe what this topic is trying to build, in plain English, and ProRealAI writes the ProRealTime™ indicator, screener or system for you.

Available in 7 languages
Try ProRealAI

signals ichimoku detector


ProBuilder: Indicators & Custom Tools

New Reply
Author
Summary

This topic contains 2 replies,
has 2 voices, and was last updated by jacquesgermainjacquesgermain
6 years, 2 months ago.

Topic Details
Forum: ProBuilder: Indicators & Custom Tools
Language: English
Started: 07/21/2020
Status: Active
Attachments: 2 files
ProRealCode ProRealCode
Loading...