



 ProRealCode - Trading & Coding with ProRealTime™


request translation 5 indicators form pinecode
-
AuthorPosts
-
Hi, there are some indicators that I want to translate from pine code to prorealcode. The first, I called tandem, is done for US futures. The second is done fore dax future in Frankfurt’s session (8:00-22:00). For the reason that Trading view can’t see this session in the upper timeframes ( weekly and monthly tf), I did input values to calculate the levels. Please I would translate these indicators in prorealcode.the third is an indicator that I called oblique. after there is the “oblique areas” At the end there is an indicator called shadow zones.
Thanks
//@version=6
indicator(“TANDEM MULTILIVELLO – SPREAD ZONE FULL (DEFINITIVE)”, overlay=true, max_lines_count=500, max_labels_count=500, max_boxes_count=500)
// ======================================================
// INPUT VISIBILITÀ TIMEFRAME
// ======================================================
showDaily = input.bool(true, “Mostra Daily”)
showWeekly = input.bool(true, “Mostra Weekly”)
showMonthly = input.bool(true, “Mostra Monthly”)
// Opzioni per attivare/disattivare i due modelli simultaneamente
showSettlement = input.bool(true, “Mostra Livelli SETTLEMENT (Standard)”)
showRealClose = input.bool(true, “Mostra Livelli REAL CLOSE (Last Price)”)
fillOpacity = input.int(85, “Trasparenza Zona Colore (0-100)”, minval=0, maxval=100)
// Input per spostare l’orario di inizio Daily
h_start = input.int(15, “Ora Inizio Daily (HH)”, minval=0, maxval=23)
m_start = input.int(30, “Minuti Inizio Daily (MM)”, minval=0, maxval=59)
// Importante per allineamento orario segmenti
tz_input = input.string(“Europe/Rome”, “Fuso Orario Grafico”, options=[“Europe/Rome”, “Exchange”, “UTC”, “America/New_York”])
// Colori di contrasto scelti per i livelli sdoppiati del Real Close
color_d_close = color.gray
color_w_close = color.green
color_m_close = color.red
// ======================================================
// FUNZIONE CALCOLO LIVELLI TANDEM
// ======================================================
f_levels(H, L, O, C, H1, L1) =>
maxOC = math.max(O, C)
minOC = math.min(O, C)
absOC = math.abs(C – O)
mu = H + (H – L1)
xi = mu – (H – maxOC)
beta = xi – absOC
alfa = beta – (minOC – L)
psi = H + (H – H1)
smu = L – (H1 – L)
sxi = smu + (minOC – L)
sbeta = sxi + absOC
salfa = sbeta + (H – maxOC)
spsi = L + (L – L1)
[mu, xi, beta, alfa, psi, smu, sxi, sbeta, salfa, spsi]
// ======================================================
// FUNZIONE DISEGNO INTELLIGENTE CON RIEMPIMENTO ZONA
// ======================================================
f_draw_smart(val_s, val_r, txt, base_col, close_col, style, width, start_t, end_t, show_s, show_r, opacity) =>
line return_void = na
if not na(val_s) and not na(val_r)
is_equal = math.abs(val_s – val_r) < 0.00001
if is_equal
if show_s or show_r
line.new(start_t, val_s, end_t, val_s, xloc=xloc.bar_time, color=base_col, style=style, width=width)
label.new(math.round((start_t + end_t) / 2), val_s, txt + ” “ + str.tostring(val_s, format.mintick), xloc=xloc.bar_time, style=label.style_none, textcolor=base_col, size=size.small)
else
line ln_s = na
line ln_r = na
if show_s
ln_s := line.new(start_t, val_s, end_t, val_s, xloc=xloc.bar_time, color=base_col, style=style, width=width)
label.new(math.round((start_t + end_t) / 2), val_s, txt + ” (Sett) “ + str.tostring(val_s, format.mintick), xloc=xloc.bar_time, style=label.style_none, textcolor=base_col, size=size.small)
if show_r
ln_r := line.new(start_t, val_r, end_t, val_r, xloc=xloc.bar_time, color=close_col, style=style, width=width)
label.new(math.round((start_t + end_t) / 2), val_r, txt + ” (Close) “ + str.tostring(val_r, format.mintick), xloc=xloc.bar_time, style=label.style_none, textcolor=close_col, size=size.small)
if show_s and show_r and not na(ln_s) and not na(ln_r)
linefill.new(ln_s, ln_r, color.new(close_col, opacity))
return_void
// ======================================================
// LOGICA TEMPORALE ORIZZONTALE (Ancoraggi sul grafico)
// ======================================================
tz = tz_input == “Exchange” ? syminfo.timezone : tz_input
int y_now = year(timenow, tz)
int m_now = month(timenow, tz)
int d_now = dayofmonth(timenow, tz)
// Struttura Daily con break mobile alle 15:30
int ref_1530 = timestamp(tz, y_now, m_now, d_now, h_start, m_start)
int offset_days = (timenow >= ref_1530) ? 0 : 1
int d0_start = ref_1530 – (offset_days * 86400000)
if dayofweek(d0_start, tz) == dayofweek.saturday
d0_start := d0_start – 86400000
if dayofweek(d0_start, tz) == dayofweek.sunday
d0_start := d0_start – 172800000
int d0_end = d0_start + ((dayofweek(d0_start, tz) == dayofweek.friday) ? 3 : 1) * 86400000
int d1_start = d0_start – ((dayofweek(d0_start, tz) == dayofweek.monday) ? 3 : 1) * 86400000
int d1_end = d0_start
// Struttura standard Week e Month (partenza 00:00)
w0_start = request.security(syminfo.tickerid, “W”, time)
w0_end = request.security(syminfo.tickerid, “W”, time_close)
w1_start = request.security(syminfo.tickerid, “W”, time[1])
w1_end = w0_start
m0_start = request.security(syminfo.tickerid, “M”, time)
m0_end = request.security(syminfo.tickerid, “M”, time_close)
m1_start = request.security(syminfo.tickerid, “M”, time[1])
m1_end = m0_start
// ======================================================
// DATA REQUEST COMPLETA (Estesa a [1], [2], [3] per il Daily)
// ======================================================
// 1. MODELLO SETTLEMENT (Dati standard di TradingView)
[dH1, dL1, dO1, dC1, dH2, dL2, dO2, dC2, dH3, dL3] = request.security(syminfo.tickerid, “D”, [high[1], low[1], open[1], close[1], high[2], low[2], open[2], close[2], high[3], low[3]], lookahead=barmerge.lookahead_on)
[wH1, wL1, wO1, wC1, wH2, wL2, wO2, wC2, wH3, wL3] = request.security(syminfo.tickerid, “W”, [high[1], low[1], open[1], close[1], high[2], low[2], open[2], close[2], high[3], low[3]], lookahead=barmerge.lookahead_on)
[mH1, mL1, mO1, mC1, mH2, mL2, mO2, mC2, mH3, mL3] = request.security(syminfo.tickerid, “M”, [high[1], low[1], open[1], close[1], high[2], low[2], open[2], close[2], high[3], low[3]], lookahead=barmerge.lookahead_on)
// 2. MODELLO REAL MARKET (True Last Price intraday storico ricorsivo)
f_get_real_data() =>
d_change = ta.change(time(“D”)) != 0
w_change = ta.change(time(“W”)) != 0
m_change = ta.change(time(“M”)) != 0
var float dO1 = na, var float dH1 = na, var float dL1 = na, var float dC1 = na
var float dO2 = na, var float dH2 = na, var float dL2 = na, var float dC2 = na
var float dO3 = na, var float dH3 = na, var float dL3 = na, var float dC3 = na
var float cur_dO = na, var float cur_dH = na, var float cur_dL = na
if d_change or na(cur_dH)
dO3 := dO2, dH3 := dH2, dL3 := dL2, dC3 := dC2
dO2 := dO1, dH2 := dH1, dL2 := dL1, dC2 := dC1
dO1 := cur_dO, dH1 := cur_dH, dL1 := cur_dL, dC1 := close[1]
cur_dO := open, cur_dH := high, cur_dL := low
else
cur_dH := math.max(cur_dH, high)
cur_dL := math.min(cur_dL, low)
var float wO1 = na, var float wH1 = na, var float wL1 = na, var float wC1 = na
var float wO2 = na, var float wH2 = na, var float wL2 = na, var float wC2 = na
var float wO3 = na, var float wH3 = na, var float wL3 = na, var float wC3 = na
var float cur_wO = na, var float cur_wH = na, var float cur_wL = na
if w_change or na(cur_wH)
wO3 := wO2, wH3 := wH2, wL3 := wL2, wC3 := wC2
wO2 := wO1, wH2 := wH1, wL2 := wL1, wC2 := wC1
wO1 := cur_wO, wH1 := cur_wH, wL1 := cur_wL, wC1 := close[1]
cur_wO := open, cur_wH := high, cur_wL := low
else
cur_wH := math.max(cur_wH, high)
cur_wL := math.min(cur_wL, low)
var float mO1 = na, var float mH1 = na, var float mL1 = na, var float mC1 = na
var float mO2 = na, var float mH2 = na, var float mL2 = na, var float mC2 = na
var float mO3 = na, var float mH3 = na, var float mL3 = na, var float mC3 = na
var float cur_mO = na, var float cur_mH = na, var float cur_mL = na
if m_change or na(cur_mH)
mO3 := mO2, mH3 := mH2, mL3 := mL2, mC3 := mC2
mO2 := mO1, mH2 := mH1, mL2 := mL1, mC2 := mC1
mO1 := cur_mO, mH1 := cur_mH, mL1 := cur_mL, mC1 := close[1]
cur_mO := open, cur_mH := high, cur_mL := low
else
cur_mH := math.max(cur_mH, high)
cur_mL := math.min(cur_mL, low)
[dH1, dL1, dO1, dC1, dH2, dL2, dO2, dC2, dH3, dL3,
wH1, wL1, wO1, wC1, wH2, wL2, wO2, wC2, wH3, wL3,
mH1, mL1, mO1, mC1, mH2, mL2, mO2, mC2, mH3, mL3]
[tdH1, tdL1, tdO1, tdC1, tdH2, tdL2, tdO2, tdC2, tdH3, tdL3,
twH1, twL1, twO1, twC1, twH2, twL2, twO2, twC2, twH3, twL3,
tmH1, tmL1, tmO1, tmC1, tmH2, tmL2, tmO2, tmC2, tmH3, tmL3] = request.security(syminfo.tickerid, “60”, f_get_real_data(), lookahead=barmerge.lookahead_on)
// ======================================================
// CALCOLO LIVELLI COERENTE (MATRICE SCALATA INDIETRO)
// ======================================================
// — MODELLO SETTLEMENT (STANDARD) —
// OGGI (D0) dalle 15:30 -> Usa Ieri [1] e L’altro Ieri [2]
[dmu_s, dxi_s, dbeta_s, dalfa_s, dpsi_s, dsmu_s, dsxi_s, dsbeta_s, dsalfa_s, dspsi_s] = f_levels(dH1, dL1, dO1, dC1, dH2, dL2)
// IERI (D1) dalle 15:30 -> Usa L’altro Ieri [2] e 3 Giorni Fa [3]
[dmu1_s, dxi1_s, dbeta1_s, dalfa1_s, dpsi1_s, dsmu1_s, dsxi1_s, dsbeta1_s, dsalfa1_s, dspsi1_s] = f_levels(dH2, dL2, dO2, dC2, dH3, dL3)
// WEEK e MONTH (Mantengono l’ancoraggio standard richiesto)
[wmu_s, wxi_s, wbeta_s, walfa_s, wpsi_s, wsmu_s, wsxi_s, wsbeta_s, wsalfa_s, wspsi_s] = f_levels(wH1, wL1, wO1, wC1, wH2, wL2)
[wmu1_s, wxi1_s, wbeta1_s, walfa1_s, wpsi1_s, wsmu1_s, wsxi1_s, wsbeta1_s, wsalfa1_s, wspsi1_s] = f_levels(wH2, wL2, wO2, wC2, wH3, wL3)
[mmu_s, mxi_s, mbeta_s, malfa_s, mpsi_s, msmu_s, msxi_s, msbeta_s, msalfa_s, mspsi_s] = f_levels(mH1, mL1, mO1, mC1, mH2, mL2)
[mmu1_s, mxi1_s, mbeta1_s, malfa1_s, mpsi1_s, msmu1_s, msxi1_s, msbeta1_s, msalfa1_s, mspsi1_s] = f_levels(mH2, mL2, mO2, mC2, mH3, mL3)
// — MODELLO REAL CLOSE (LAST PRICE) —
// OGGI (D0) dalle 15:30 -> Usa Ieri [1] e L’altro Ieri [2]
[dmu_r, dxi_r, dbeta_r, dalfa_r, dpsi_r, dsmu_r, dsxi_r, dsbeta_r, dsalfa_r, dspsi_r] = f_levels(tdH1, tdL1, tdO1, tdC1, tdH2, tdL2)
// IERI (D1) dalle 15:30 -> Usa L’altro Ieri [2] e 3 Giorni Fa [3]
[dmu1_r, dxi1_r, dbeta1_r, dalfa1_r, dpsi1_r, dsmu1_r, dsxi1_r, dsbeta1_r, dsalfa1_r, dspsi1_r] = f_levels(tdH2, tdL2, tdO2, tdC2, tdH3, tdL3)
[wmu_r, wxi_r, wbeta_r, walfa_r, wpsi_r, wsmu_r, wsxi_r, wsbeta_r, wsalfa_r, wspsi_r] = f_levels(twH1, twL1, twO1, twC1, twH2, twL2)
[wmu1_r, wxi1_r, wbeta1_r, walfa1_r, wpsi1_r, wsmu1_r, wsxi1_r, wsbeta1_r, wsalfa1_r, wspsi1_r] = f_levels(twH2, twL2, twO2, twC2, twH3, twL3)
[mmu_r, mxi_r, mbeta_r, malfa_r, mpsi_r, msmu_r, msxi_r, msbeta_r, msalfa_r, mspsi_r] = f_levels(tmH1, tmL1, tmO1, tmC1, tmH2, tmL2)
[mmu1_r, mxi1_r, mbeta1_r, malfa1_r, mpsi1_r, msmu1_r, msxi1_r, msbeta1_r, msalfa1_r, mspsi1_r] = f_levels(tmH2, tmL2, tmO2, tmC2, tmH3, tmL3)
// ======================================================
// RENDER ATTIVO SUL GRAFICO (LAST BAR ONLY)
// ======================================================
if barstate.islast
// ————————————————–
// DAILY (Segmenti mobili h 15:30 allineati alle formule corrette)
// ————————————————–
if showDaily
blackCol = color.black, fadedBlack = color.new(color.black, 60), fadedGray = color.new(color.gray, 70)
// Oggi (D0) -> Parte dalle 15:30 di Oggi usando dati [1] e [2]
f_draw_smart(dmu_s, dmu_r, “μ”, blackCol, color_d_close, line.style_solid, 3, d0_start, d0_end, showSettlement, showRealClose, fillOpacity)
f_draw_smart(dxi_s, dxi_r, “ξ”, blackCol, color_d_close, line.style_solid, 1, d0_start, d0_end, showSettlement, showRealClose, fillOpacity)
f_draw_smart(dbeta_s, dbeta_r, “β”, blackCol, color_d_close, line.style_dashed, 1, d0_start, d0_end, showSettlement, showRealClose, fillOpacity)
f_draw_smart(dalfa_s, dalfa_r, “α”, blackCol, color_d_close, line.style_dotted, 1, d0_start, d0_end, showSettlement, showRealClose, fillOpacity)
f_draw_smart(dpsi_s, dpsi_r, “ψ”, color.gray, color_d_close, line.style_solid, 2, d0_start, d0_end, showSettlement, showRealClose, fillOpacity)
f_draw_smart(dsmu_s, dsmu_r, “/μ”, blackCol, color_d_close, line.style_solid, 3, d0_start, d0_end, showSettlement, showRealClose, fillOpacity)
f_draw_smart(dsxi_s, dsxi_r, “/ξ”, blackCol, color_d_close, line.style_solid, 1, d0_start, d0_end, showSettlement, showRealClose, fillOpacity)
f_draw_smart(dsbeta_s, dsbeta_r, “/β”, blackCol, color_d_close, line.style_dashed, 1, d0_start, d0_end, showSettlement, showRealClose, fillOpacity)
f_draw_smart(dsalfa_s, dsalfa_r, “/α”, blackCol, color_d_close, line.style_dotted, 1, d0_start, d0_end, showSettlement, showRealClose, fillOpacity)
f_draw_smart(dspsi_s, dspsi_r, “/ψ”, color.gray, color_d_close, line.style_solid, 2, d0_start, d0_end, showSettlement, showRealClose, fillOpacity)
// Ieri (D1) -> Parte dalle 15:30 di Ieri usando dati [2] e [3]
f_draw_smart(dmu1_s, dmu1_r, “μ₁”, fadedBlack, color_d_close, line.style_solid, 2, d1_start, d1_end, showSettlement, showRealClose, fillOpacity)
f_draw_smart(dxi1_s, dxi1_r, “ξ₁”, fadedBlack, color_d_close, line.style_solid, 1, d1_start, d1_end, showSettlement, showRealClose, fillOpacity)
f_draw_smart(dbeta1_s, dbeta1_r, “β₁”, fadedBlack, color_d_close, line.style_dashed, 1, d1_start, d1_end, showSettlement, showRealClose, fillOpacity)
f_draw_smart(dalfa1_s, dalfa1_r, “α₁”, fadedBlack, color_d_close, line.style_dotted, 1, d1_start, d1_end, showSettlement, showRealClose, fillOpacity)
f_draw_smart(dpsi1_s, dpsi1_r, “ψ₁”, fadedGray, color_d_close, line.style_solid, 1, d1_start, d1_end, showSettlement, showRealClose, fillOpacity)
f_draw_smart(dsmu1_s, dsmu1_r, “/μ₁”, fadedBlack, color_d_close, line.style_solid, 2, d1_start, d1_end, showSettlement, showRealClose, fillOpacity)
f_draw_smart(dsxi1_s, dsxi1_r, “/ξ₁”, fadedBlack, color_d_close, line.style_solid, 1, d1_start, d1_end, showSettlement, showRealClose, fillOpacity)
f_draw_smart(dsbeta1_s, dsbeta1_r, “/β₁”, fadedBlack, color_d_close, line.style_dashed, 1, d1_start, d1_end, showSettlement, showRealClose, fillOpacity)
f_draw_smart(dsalfa1_s, dsalfa1_r, “/α₁”, fadedBlack, color_d_close, line.style_dotted, 1, d1_start, d1_end, showSettlement, showRealClose, fillOpacity)
f_draw_smart(dspsi1_s, dspsi1_r, “/ψ₁”, fadedGray, color_d_close, line.style_solid, 1, d1_start, d1_end, showSettlement, showRealClose, fillOpacity)
// ————————————————–
// WEEKLY
// ————————————————–
if showWeekly
greenCol = color.green, fadedGreen = color.new(color.green, 60)
f_draw_smart(wmu_s, wmu_r, “W μ”, greenCol, color_w_close, line.style_solid, 3, w0_start, w0_end, showSettlement, showRealClose, fillOpacity)
f_draw_smart(wxi_s, wxi_r, “W ξ”, greenCol, color_w_close, line.style_solid, 1, w0_start, w0_end, showSettlement, showRealClose, fillOpacity)
f_draw_smart(wbeta_s, wbeta_r, “W β”, greenCol, color_w_close, line.style_dashed, 1, w0_start, w0_end, showSettlement, showRealClose, fillOpacity)
f_draw_smart(walfa_s, walfa_r, “W α”, greenCol, color_w_close, line.style_dotted, 1, w0_start, w0_end, showSettlement, showRealClose, fillOpacity)
f_draw_smart(wpsi_s, wpsi_r, “W ψ”, greenCol, color_w_close, line.style_solid, 2, w0_start, w0_end, showSettlement, showRealClose, fillOpacity)
f_draw_smart(wsmu_s, wsmu_r, “W /μ”, greenCol, color_w_close, line.style_solid, 3, w0_start, w0_end, showSettlement, showRealClose, fillOpacity)
f_draw_smart(wsxi_s, wsxi_r, “W /ξ”, greenCol, color_w_close, line.style_solid, 1, w0_start, w0_end, showSettlement, showRealClose, fillOpacity)
f_draw_smart(wsbeta_s, wsbeta_r, “W /β”, greenCol, color_w_close, line.style_dashed, 1, w0_start, w0_end, showSettlement, showRealClose, fillOpacity)
f_draw_smart(wsalfa_s, wsalfa_r, “W /α”, greenCol, color_w_close, line.style_dotted, 1, w0_start, w0_end, showSettlement, showRealClose, fillOpacity)
f_draw_smart(wspsi_s, wspsi_r, “W /ψ”, greenCol, color_w_close, line.style_solid, 2, w0_start, w0_end, showSettlement, showRealClose, fillOpacity)
f_draw_smart(wmu1_s, wmu1_r, “W μ₁”, fadedGreen, color_w_close, line.style_solid, 2, w1_start, w1_end, showSettlement, showRealClose, fillOpacity)
f_draw_smart(wxi1_s, wxi1_r, “W ξ₁”, fadedGreen, color_w_close, line.style_solid, 1, w1_start, w1_end, showSettlement, showRealClose, fillOpacity)
f_draw_smart(wbeta1_s, wbeta1_r, “W β₁”, fadedGreen, color_w_close, line.style_dashed, 1, w1_start, w1_end, showSettlement, showRealClose, fillOpacity)
f_draw_smart(walfa1_s, walfa1_r, “W α₁”, fadedGreen, color_w_close, line.style_dotted, 1, w1_start, w1_end, showSettlement, showRealClose, fillOpacity)
f_draw_smart(wpsi1_s, wpsi1_r, “W ψ₁”, fadedGreen, color_w_close, line.style_solid, 1, w1_start, w1_end, showSettlement, showRealClose, fillOpacity)
f_draw_smart(wsmu1_s, wsmu1_r, “W /μ₁”, fadedGreen, color_w_close, line.style_solid, 2, w1_start, w1_end, showSettlement, showRealClose, fillOpacity)
f_draw_smart(wsxi1_s, wsxi1_r, “W /ξ₁”, fadedGreen, color_w_close, line.style_solid, 1, w1_start, w1_end, showSettlement, showRealClose, fillOpacity)
f_draw_smart(wsbeta1_s, wsbeta1_r, “W /β₁”, fadedGreen, color_w_close, line.style_dashed, 1, w1_start, w1_end, showSettlement, showRealClose, fillOpacity)
f_draw_smart(wsalfa1_s, wsalfa1_r, “W /α₁”, fadedGreen, color_w_close, line.style_dotted, 1, w1_start, w1_end, showSettlement, showRealClose, fillOpacity)
f_draw_smart(wspsi1_s, wspsi1_r, “W /ψ₁”, fadedGreen, color_w_close, line.style_solid, 1, w1_start, w1_end, showSettlement, showRealClose, fillOpacity)
// ————————————————–
// MONTHLY
// ————————————————–
if showMonthly
redCol = color.red, fadedRed = color.new(color.red, 60)
f_draw_smart(mmu_s, mmu_r, “M μ”, redCol, color_m_close, line.style_solid, 3, m0_start, m0_end, showSettlement, showRealClose, fillOpacity)
f_draw_smart(mxi_s, mxi_r, “M ξ”, redCol, color_m_close, line.style_solid, 1, m0_start, m0_end, showSettlement, showRealClose, fillOpacity)
f_draw_smart(mbeta_s, mbeta_r, “M β”, redCol, color_m_close, line.style_dashed, 1, m0_start, m0_end, showSettlement, showRealClose, fillOpacity)
f_draw_smart(malfa_s, malfa_r, “M α”, redCol, color_m_close, line.style_dotted, 1, m0_start, m0_end, showSettlement, showRealClose, fillOpacity)
f_draw_smart(mpsi_s, mpsi_r, “M ψ”, redCol, color_m_close, line.style_solid, 2, m0_start, m0_end, showSettlement, showRealClose, fillOpacity)
f_draw_smart(msmu_s, msmu_r, “M /μ”, redCol, color_m_close, line.style_solid, 3, m0_start, m0_end, showSettlement, showRealClose, fillOpacity)
f_draw_smart(msxi_s, msxi_r, “M /ξ”, redCol, color_m_close, line.style_solid, 1, m0_start, m0_end, showSettlement, showRealClose, fillOpacity)
f_draw_smart(msbeta_s, msbeta_r, “M /β”, redCol, color_m_close, line.style_dashed, 1, m0_start, m0_end, showSettlement, showRealClose, fillOpacity)
f_draw_smart(msalfa_s, msalfa_r, “M /α”, redCol, color_m_close, line.style_dotted, 1, m0_start, m0_end, showSettlement, showRealClose, fillOpacity)
f_draw_smart(mspsi_s, mspsi_r, “M /ψ”, redCol, color_m_close, line.style_solid, 2, m0_start, m0_end, showSettlement, showRealClose, fillOpacity)
f_draw_smart(mmu1_s, mmu1_r, “M μ₁”, fadedRed, color_m_close, line.style_solid, 2, m1_start, m1_end, showSettlement, showRealClose, fillOpacity)
f_draw_smart(mxi1_s, mxi1_r, “M ξ₁”, fadedRed, color_m_close, line.style_solid, 1, m1_start, m1_end, showSettlement, showRealClose, fillOpacity)
f_draw_smart(mbeta1_s, mbeta1_r, “M β₁”, fadedRed, color_m_close, line.style_dashed, 1, m1_start, m1_end, showSettlement, showRealClose, fillOpacity)
f_draw_smart(malfa1_s, malfa1_r, “M α₁”, fadedRed, color_m_close, line.style_dotted, 1, m1_start, m1_end, showSettlement, showRealClose, fillOpacity)
f_draw_smart(mpsi1_s, mpsi1_r, “M ψ₁”, fadedRed, color_m_close, line.style_solid, 1, m1_start, m1_end, showSettlement, showRealClose, fillOpacity)
f_draw_smart(msmu1_s, msmu1_r, “M /μ₁”, fadedRed, color_m_close, line.style_solid, 2, m1_start, m1_end, showSettlement, showRealClose, fillOpacity)
f_draw_smart(msxi1_s, msxi1_r, “M /ξ₁”, fadedRed, color_m_close, line.style_solid, 1, m1_start, m1_end, showSettlement, showRealClose, fillOpacity)
f_draw_smart(msbeta1_s, msbeta1_r, “M /β₁”, fadedRed, color_m_close, line.style_dashed, 1, m1_start, m1_end, showSettlement, showRealClose, fillOpacity)
f_draw_smart(msalfa1_s, msalfa1_r, “M /α₁”, fadedRed, color_m_close, line.style_dotted, 1, m1_start, m1_end, showSettlement, showRealClose, fillOpacity)
f_draw_smart(mspsi1_s, mspsi1_r, “M /ψ₁”, fadedRed, color_m_close, line.style_solid, 1, m1_start, m1_end, showSettlement, showRealClose, fillOpacity)
//@version=5
indicator(“dax multitf sexione 8:00–22:00 – ANCORAGGIO FISSO 15:30 CRONOLOGICO”, overlay=true, max_lines_count=500, max_labels_count=500)
// ==========================================
// 1. INPUT MANUALI (Valori di default mantenuti identici)
// ==========================================
gM = “— MENSILE (HOCL da visualizzazione 8:00 am – 22:00 pm) —“
hma = input.float(25494.0, “H Corrente”, group=gM, inline=“m1”, display=display.none)
oma = input.float(25179.0, “O Corrente”, group=gM, inline=“m1”, display=display.none)
cma = input.float(24462.0, “C Corrente”, group=gM, inline=“m1”, display=display.none)
lma = input.float(23674.0, “L Corrente”, group=gM, inline=“m1”, display=display.none)
h1m = input.float(24966.0, “H Passato “, group=gM, inline=“m2”, display=display.none)
o1m = input.float(24387.0, “O Passato “, group=gM, inline=“m2”, display=display.none)
c1m = input.float(23272.0, “C Passato “, group=gM, inline=“m2”, display=display.none)
l1m = input.float(22848.0, “L Passato “, group=gM, inline=“m2”, display=display.none)
h2m = input.float(25113.0, “H -2 Per.”, group=gM, inline=“m3”, display=display.none)
o2m = input.float(25007.0, “O -2 Per.”, group=gM, inline=“m3”, display=display.none)
c2m = input.float(22837.0, “C -2 Per.”, group=gM, inline=“m3”, display=display.none)
l2m = input.float(22057.0, “L -2 Per.”, group=gM, inline=“m3”, display=display.none)
gW = “— SETTIMANALE (HOCL da visualizzazione 8:00 am – 22:00 pm) —“
hwa = input.float(25494.0, “H Corrente”, group=gW, inline=“w1”, display=display.none)
owa = input.float(25192.0, “O Corrente”, group=gW, inline=“w1”, display=display.none)
cwa = input.float(25179.0, “C Corrente”, group=gW, inline=“w1”, display=display.none)
lwa = input.float(25015.0, “L Corrente”, group=gW, inline=“w1”, display=display.none)
h1w = input.float(25000.0, “H Passato “, group=gW, inline=“w2”, display=display.none)
o1w = input.float(24970.0, “O Passato “, group=gW, inline=“w2”, display=display.none)
c1w = input.float(23780.0, “C Passato “, group=gW, inline=“w2”, display=display.none)
l1w = input.float(23674.0, “L Passato “, group=gW, inline=“w2”, display=display.none)
h2w = input.float(24545.0, “H -2 Per.”, group=gW, inline=“w3”, display=display.none)
o2w = input.float(24334.0, “O -2 Per.”, group=gW, inline=“w3”, display=display.none)
c2w = input.float(23990.0, “C -2 Per.”, group=gW, inline=“w3”, display=display.none)
l2w = input.float(23906.0, “L -2 Per.”, group=gW, inline=“w3”, display=display.none)
gD = “— GIORNALIERO (HOCL da visualizzazione 8:00 am – 22:00 pm) —“
hda = input.float(25243.0, “H Corrente”, group=gD, inline=“d1”, display=display.none)
oda = input.float(25204.0, “O Corrente”, group=gD, inline=“d1”, display=display.none)
cda = input.float(25179.0, “C Corrente”, group=gD, inline=“d1”, display=display.none)
lda = input.float(25063.0, “L Corrente”, group=gD, inline=“d1”, display=display.none)
h1d = input.float(25294.0, “H Passato “, group=gD, inline=“d2”, display=display.none)
o1d = input.float(25136.0, “O Passato “, group=gD, inline=“d2”, display=display.none)
c1d = input.float(25099.0, “C Passato “, group=gD, inline=“d2”, display=display.none)
l1d = input.float(25015.0, “L Passato “, group=gD, inline=“d2”, display=display.none)
h2d = input.float(25441.0, “H -2 Per.”, group=gD, inline=“d3”, display=display.none)
o2d = input.float(25325.0, “O -2 Per.”, group=gD, inline=“d3”, display=display.none)
c2d = input.float(25258.0, “C -2 Per.”, group=gD, inline=“d3”, display=display.none)
l2d = input.float(25154.0, “L -2 Per.”, group=gD, inline=“d3”, display=display.none)
// ==========================================
// 2. DICHIARAZIONE FUNZIONI GLOBALI (Risolto Errore di Sintassi)
// ==========================================
f_sort_hocl(v1, v2, v3, v4) =>
arr = array.new_float(4)
array.set(arr, 0, v1)
array.set(arr, 1, v2)
array.set(arr, 2, v3)
array.set(arr, 3, v4)
array.sort(arr, order.descending)
[array.get(arr, 0), array.get(arr, 1), array.get(arr, 2), array.get(arr, 3)]
f_calc(H_cur, O_cur, C_cur, L_cur, H_pas, O_pas, C_pas, L_pas) =>
if H_cur == 0 or L_pas == 0
[0.0, 0.0, 0.0, 0.0, 0.0, 0.0, 0.0, 0.0, 0.0, 0.0]
else
[H, maxOC, minOC, L] = f_sort_hocl(H_cur, O_cur, C_cur, L_cur)
float absOC = maxOC – minOC
float UpperSh = H – maxOC
float LowerSh = minOC – L
[H1, maxOC1, minOC1, L1] = f_sort_hocl(H_pas, O_pas, C_pas, L_pas)
_mu = H + (H – L1)
_xi = _mu – UpperSh
_be = _xi – absOC
_al = _be – LowerSh
_ps = H + (H – H1)
_smu = L – (H1 – L)
_sxi = _smu + LowerSh
_sbe = _sxi + absOC
_sa = _sbe + UpperSh
_sp = L + (L – L1)
[_mu, _xi, _be, _al, _ps, _smu, _sxi, _sbe, _sa, _sp]
draw_l(v, s, e, lbl, col, st, show_condition) =>
if not na(v) and v != 0.0 and show_condition
line.new(s, v, e, v, xloc=xloc.bar_time, color=col, style=st, width=2)
mid_time = math.round((s + e) / 2)
label.new(mid_time, v, lbl + ” “ + str.tostring(v, format.mintick), xloc=xloc.bar_time, style=label.style_none, textcolor=col, size=size.small, textalign=text.align_center)
draw_group(mu, xi, be, al, ps, smu, sxi, sbe, sa, sp, s, e, lbl_suff, col, show_condition) =>
draw_l(mu, s, e, “μ” + lbl_suff, col, line.style_solid, show_condition)
draw_l(xi, s, e, “ξ” + lbl_suff, col, line.style_solid, show_condition)
draw_l(be, s, e, “β” + lbl_suff, col, line.style_dashed, show_condition)
draw_l(al, s, e, “α” + lbl_suff, col, line.style_dotted, show_condition)
draw_l(ps, s, e, “ψ” + lbl_suff, col, line.style_solid, show_condition)
draw_l(smu, s, e, “/μ” + lbl_suff, col, line.style_solid, show_condition)
draw_l(sxi, s, e, “/ξ” + lbl_suff, col, line.style_solid, show_condition)
draw_l(sbe, s, e, “/β” + lbl_suff, col, line.style_dashed, show_condition)
draw_l(sa, s, e, “/α” + lbl_suff, col, line.style_dotted, show_condition)
draw_l(sp, s, e, “/ψ” + lbl_suff, col, line.style_solid, show_condition)
// ==========================================
// 3. FILTRI VISIBILITÀ TIMEFRAME
// ==========================================
int tfMinuti = timeframe.isseconds ? 0 : (timeframe.isminutes ? timeframe.multiplier : (timeframe.isdaily ? 1440 : (timeframe.isweekly ? 10080 : 43200)))
bool mostra_D = tfMinuti <= 1440
bool mostra_W = tfMinuti <= 10080
bool mostra_M = true
// ==========================================
// 4. ESECUZIONE LOGICA E DISEGNO (Solo sull’ultima barra)
// ==========================================
if barstate.islast
// — GIORNALIERO (Ancoraggio Fisso ore 15:30) —
d0_s = timestamp(syminfo.timezone, year, month, dayofmonth, 15, 30, 0)
d0_e = d0_s + 86400000
giorni_indietro = (dayofweek == 2) ? 3 : 1
d1_s = d0_s – (giorni_indietro * 86400000)
// — SETTIMANALE (Naturale: Lunedì alle ore 00:00) —
giorni_da_lunedi = (dayofweek == 1) ? 6 : (dayofweek – 2)
w0_s = timestamp(syminfo.timezone, year, month, dayofmonth, 0, 0, 0) – (giorni_da_lunedi * 86400000)
w0_e = w0_s + (7 * 86400000)
w1_s = w0_s – (7 * 86400000)
// — MENSILE (Naturale: Giorno 1 alle ore 00:00) —
m0_s = timestamp(syminfo.timezone, year, month, 1, 0, 0, 0)
annoSucc = (month == 12) ? year + 1 : year
meseSucc = (month == 12) ? 1 : month + 1
m0_e = timestamp(syminfo.timezone, annoSucc, meseSucc, 1, 0, 0, 0)
annoPrec = (month == 1) ? year – 1 : year
mesePrec = (month == 1) ? 12 : month – 1
m1_s = timestamp(syminfo.timezone, annoPrec, mesePrec, 1, 0, 0, 0)
// — CALCOLO E DISEGNO GIORNALIERO —
[muD0, xiD0, beD0, alD0, psD0, smD0, sxD0, sbD0, saD0, spD0] = f_calc(hda, oda, cda, lda, h1d, o1d, c1d, l1d)
[muD1, xiD1, beD1, alD1, psD1, smD1, sxD1, sbD1, saD1, spD1] = f_calc(h1d, o1d, c1d, l1d, h2d, o2d, c2d, l2d)
draw_group(muD0, xiD0, beD0, alD0, psD0, smD0, sxD0, sbD0, saD0, spD0, d0_s, d0_e, “”, color.black, mostra_D)
draw_group(muD1, xiD1, beD1, alD1, psD1, smD1, sxD1, sbD1, saD1, spD1, d1_s, d0_s, “₁”, color.gray, mostra_D)
// — CALCOLO E DISEGNO SETTIMANALE —
[muW0, xiW0, beW0, alW0, psW0, smW0, sxW0, sbW0, saW0, spW0] = f_calc(hwa, owa, cwa, lwa, h1w, o1w, c1w, l1w)
[muW1, xiW1, beW1, alW1, psW1, smW1, sxW1, sbW1, saW1, spW1] = f_calc(h1w, o1w, c1w, l1w, h2w, o2w, c2w, l2w)
draw_group(muW0, xiW0, beW0, alW0, psW0, smW0, sxW0, sbW0, saW0, spW0, w0_s, w0_e, ” W”, color.green, mostra_W)
draw_group(muW1, xiW1, beW1, alW1, psW1, smW1, sxW1, sbW1, saW1, spW1, w1_s, w0_s, ” W₁”, color.new(color.green, 40), mostra_W)
// — CALCOLO E DISEGNO MENSILE —
[muM0, xiM0, beM0, alM0, psM0, smM0, sxM0, sbM0, saM0, spM0] = f_calc(hma, oma, cma, lma, h1m, o1m, c1m, l1m)
[muM1, xiM1, beM1, alM1, psM1, smM1, sxM1, sbM1, saM1, spM1] = f_calc(h1m, o1m, c1m, l1m, h2m, o2m, c2m, l2m)
draw_group(muM0, xiM0, beM0, alM0, psM0, smM0, sxM0, sbM0, saM0, spM0, m0_s, m0_e, ” M”, color.red, mostra_M)
draw_group(muM1, xiM1, beM1, alM1, psM1, smM1, sxM1, sbM1, saM1, spM1, m1_s, m0_s, ” M₁”, color.new(color.red, 40), mostra_M)
//@version=6
indicator(“OBLIQUE “, overlay=true, max_boxes_count = 500)
AssetInput = input.string(“FDAX1!”, “Lista di asset che rispondono 8-22 (separati da virgola, no spaces) ,es.: FDAX1!”)
prezzoSplittati = str.split(AssetInput, “,” )
segnali = input.bool( true , ” attiva segnali “)
var bool Market822 = false
var int memNewDay = na
var int memorLastBar = na
var int hS = 0
var int mS = 0
showdebug = input.bool( true , “show datas “)
if array.size(prezzoSplittati)>0 and bar_index == 1 and timeframe.in_seconds() <= 3600
for k = 0 to array.size(prezzoSplittati) – 1
s = str.trim(array.get(prezzoSplittati, k))
if str.tostring(s) == syminfo.ticker
Market822 := true
log.info(“questo asset è richiesto a candele 8-22”)
break
//orari di settlement specifici
if syminfo.ticker == “FDAX1!”
hS := 21
mS := 30
else
hS := 23
mS := 30
// — settlement
settlement_val = request.security(syminfo.tickerid, “D”, close[1], lookahead=barmerge.lookahead_on)
// — 1. CONFIGURAZIONE —
string market_tz = “Europe/Rome”
int tf_minutes = timeframe.isintraday ? timeframe.multiplier : 1440
bool show_drawings = tf_minutes <= 30
var bool modifyMLB = true
// — 2. MEMORIA STORICA (Madre) —
var float min_d2 = na
var int idx_min_d2 = na
var float max_d2 = na
var int idx_max_d2 = na
var float min_d1 = na
var int idx_min_d1 = na
var float max_d1 = na
var int idx_max_d1 = na
var float d0_max = 0.0
var int d0_idx_max = na
var float d0_min = 1e10
var int d0_idx_min = na
// — 3. DATI OHLS D1 (Fissi) —
var float d1_o = na
var int d1_o_idx = na
var float d1_h = na
var int d1_h_idx = na
var float d1_l = na
var int d1_l_idx = na
var float d1_s = na
var int d1_s_idx = na
var float d0_o = na
var int d0_o_idx = na
int current_day = dayofmonth(time, market_tz)
bool is_new_day = current_day != dayofmonth(time[1], market_tz)
if is_new_day
memNewDay := 1
if showdebug
line.new(
bar_index, low – 1000,
bar_index, high + 1000,
color=color.yellow,
width=1,
style=line.style_dashed,
extend=extend.both)
//FILTRO ORARIO
h = hour(time[0], market_tz)
m = minute(time[0], market_tz)
// —- salvo ll’ultima barra del giorno che serve se non trovo quella del settlement
if modifyMLB == true
memorLastBar := bar_index
inSession = not Market822 or ((h > 8 or (h == 8 and m >= 0)) and (h < 22 or (h == 22 and m == 0)))
if h == hS and m == mS
memorLastBar := bar_index
modifyMLB := false
if memNewDay == 1 and inSession
modifyMLB := true
memNewDay := 0
d1_o := d0_o
d1_o_idx := d0_o_idx
d1_h := d0_max
d1_h_idx := d0_idx_max
d1_l := d0_min
d1_l_idx := d0_idx_min
d1_s := settlement_val
d1_s_idx := memorLastBar
min_d2 := min_d1
idx_min_d2 := idx_min_d1
max_d2 := max_d1
idx_max_d2 := idx_max_d1
min_d1 := d1_l
idx_min_d1 := d1_l_idx
max_d1 := d1_h
idx_max_d1 := d1_h_idx
d0_o := open
d0_o_idx := bar_index
d0_max := high
d0_idx_max := bar_index
d0_min := low
d0_idx_min := bar_index
else
if inSession
if high > d0_max
d0_max := high
d0_idx_max := bar_index
if low < d0_min
d0_min := low
d0_idx_min := bar_index
if na(d0_o)
d0_o := open
d0_o_idx := bar_index
// — 4. DISEGNO —
if barstate.islast and not na(min_d2) and show_drawings
float slope_asc = (max_d1 – min_d2) / (idx_max_d1 – idx_min_d2)
float slope_desc = –(math.abs((min_d1 – max_d2) / (idx_min_d1 – idx_max_d2)))
// Segmenti Madre (partono da D1)
line.new(idx_max_d1, max_d1, idx_max_d1 + 100, max_d1 + (slope_asc * 100), color=color.green, width=3)
line.new(idx_min_d1, min_d1, idx_min_d1 + 100, min_d1 + (slope_desc * 100), color=color.red, width=3)
// =========================================================================
// PARALLELE ASCENDENTI (VERDI)
// =========================================================================
line.new(d1_o_idx, d1_o, d1_o_idx + 100, d1_o + (slope_asc * 100), color=color.green, width=1, style=line.style_dashed)
line.new(d1_h_idx, d1_h, d1_h_idx + 100, d1_h + (slope_asc * 100), color=color.green, width=3, style=line.style_solid)
line.new(d1_l_idx, d1_l, d1_l_idx + 100, d1_l + (slope_asc * 100), color=color.green, width=1, style=line.style_dotted)
line.new(d1_s_idx, d1_s, d1_s_idx + 100, d1_s + (slope_asc * 100), color=color.green, width=1, style=line.style_solid)
// =========================================================================
// PARALLELE DISCENDENTI (ROSSE)
// =========================================================================
line.new(d1_s_idx, d1_s, d1_s_idx + 100, d1_s + (slope_desc * 100), color=color.red, width=1, style=line.style_solid)
line.new(d1_h_idx, d1_h, d1_h_idx + 100, d1_h + (slope_desc * 100), color=color.red, width=1, style=line.style_dotted)
line.new(d1_o_idx, d1_o, d1_o_idx + 100, d1_o + (slope_desc * 100), color=color.red, width=1, style=line.style_dashed)
line.new(d1_l_idx, d1_l, d1_l_idx + 100, d1_l + (slope_desc * 100), color=color.red, width=3, style=line.style_solid)
// Etichette
if showdebug
label.new(d1_o_idx, d1_o, “O”, color=color.blue, style=label.style_label_down, textcolor=color.white)
label.new(d1_h_idx, d1_h, “H”, color=color.red, style=label.style_label_down, textcolor=color.white)
label.new(d1_l_idx, d1_l, “L”, color=color.green, style=label.style_label_up, textcolor=color.white)
label.new(d1_s_idx, d1_s, “S”, color=color.orange, style=label.style_label_up, textcolor=color.white)
//————————————————–
// CALCOLO LINEE REALTIME
//————————————————–
float slope_asc_rt = na
float slope_desc_rt = na
if not na(min_d2)
den_asc_rt = idx_max_d1 – idx_min_d2
den_desc_rt = idx_min_d1 – idx_max_d2
if den_asc_rt != 0 and den_desc_rt != 0
slope_asc_rt := (max_d1 – min_d2) / den_asc_rt
slope_desc_rt := (min_d1 – max_d2) / den_desc_rt
//@version=6
indicator(“OBLIQUE – Area Giorno Corrente – Definitivo”, overlay=true)
colorareaD = input.color(color.new(color.gray, 85), “Colore Area D”)
daytoshowarea = input.int( 5 , ” Giorni da visualizzare “)
// — 1. CONFIGURAZIONE —
bool show_drawings = timeframe.isintraday and timeframe.multiplier <= 30
var int bars_to_end = na
// — 2. MEMORIA E LOGICA —
var float d2_min = na
var int d2_idx_min = na
var float d2_max = na
var int d2_idx_max = na
var float d1_min = na
var int d1_idx_min = na
var float d1_max = na
var int d1_idx_max = na
var float d0_min = 1e10
var int d0_idx_min = na
var float d0_max = -1e10
var int d0_idx_max = na
var bool isfirstcycle = false
var int counter1 = 0
var int lenghtday = 0
// ARRAYS PER LO STORICO (Gestione dei 10 giorni)
var line[] history_lines = array.new_line()
var linefill[] history_fills = array.new_linefill()
// Riferimenti alle linee del giorno corrente
var line line_min = na
var line line_max = na
var linefill fill_area = na
// Recupero l’indice di inizio del giorno corrente
int start_of_day_idx = ta.valuewhen(ta.change(time(“D”, “GMT+2”)) != 0, bar_index, 0)
bool is_new_day = ta.change(time(“D”, “GMT+2”)) != 0
if is_new_day and isfirstcycle == false
isfirstcycle := true
if isfirstcycle and lenghtday == 0
counter1 := counter1 + 1
if is_new_day and lenghtday == 0 and counter1 > 1
lenghtday := counter1
bars_to_end := lenghtday-1
if is_new_day
log.error(“lunghezza giorno : “ + str.tostring(bars_to_end))
// Se esiste già un canale del giorno precedente, lo “congeliamo” e lo spostiamo nello storico
if not na(line_min)
array.push(history_lines, line_min)
array.push(history_lines, line_max)
array.push(history_fills, fill_area)
// Se lo storico supera i 10 giorni (10 fill), eliminiamo le linee e il fill più vecchi (Logica FIFO)
if array.size(history_fills) > daytoshowarea-1
line.delete(array.shift(history_lines))
line.delete(array.shift(history_lines))
linefill.delete(array.shift(history_fills))
d2_min := d1_min
d2_idx_min := d1_idx_min
d2_max := d1_max
d2_idx_max := d1_idx_max
d1_min := d0_min
d1_idx_min := d0_idx_min
d1_max := d0_max
d1_idx_max := d0_idx_max
d0_min := low
d0_idx_min := bar_index
d0_max := high
d0_idx_max := bar_index
else
if low < d0_min
d0_min := low
d0_idx_min := bar_index
if high > d0_max
d0_max := high
d0_idx_max := bar_index
// — 3. DISEGNO (Ancorato a oggi) —
// — 3. LOGICA DI DISEGNO AVANZATA —
float slope_min = (d1_min – d2_min) / (d1_idx_min – d2_idx_min)
float slope_max = (d1_max – d2_max) / (d1_idx_max – d2_idx_max)
float y_start_min = d2_min + (slope_min * (start_of_day_idx – d2_idx_min))
float y_start_max = d2_max + (slope_max * (start_of_day_idx – d2_idx_max))
if show_drawings and not na(d2_min)
if is_new_day
// È iniziato un nuovo giorno: creiamo le nuove linee grafiche correnti
line_min := line.new(start_of_day_idx, y_start_min, start_of_day_idx + bars_to_end, y_start_min + (slope_min * (bar_index + bars_to_end – start_of_day_idx)), color=colorareaD, width=2)
line_max := line.new(start_of_day_idx, y_start_max, start_of_day_idx + bars_to_end, y_start_max + (slope_max * (bar_index + bars_to_end – start_of_day_idx)), color=colorareaD, width=2)
fill_area := linefill.new(line_max, line_min, color=colorareaD)
//@version=6
indicator(“Shadow Zones – Infinite Body Memory V6”, overlay=true, max_boxes_count=500)
// — Input —
colorRes = input.color(color.new(color.red, 85), “Colore Resistenze”)
colorSup = input.color(color.new(color.green, 85), “Colore Supporti”)
// — Variabili di Sessione (Record Giornalieri) —
is_new_day = ta.change(time(“D”)) != 0
var float dHighBody = 0.0
var float dLowBody = 1.0e10
if is_new_day
dHighBody := 0.0
dLowBody := 1.0e10
cAlto = math.max(open, close)
cBasso = math.min(open, close)
// — Strutture Dati —
type Zone
box b
float level // Il livello del body da monitorare
bool active
// Array persistenti (non resettati)
var zonesR = array.new<Zone>()
var zonesS = array.new<Zone>()
// — 1. GESTIONE RESISTENZE (ROSSA) —
// Ogni candela controlla TUTTE le zone rosse attive in memoria
if array.size(zonesR) > 0
for i = 0 to array.size(zonesR) – 1
z = array.get(zonesR, i)
if z.active
// Se il corpo attuale supera il livello originale del body della zona
if cAlto > z.level
box.set_right(z.b, bar_index)
z.active := false
else
// Altrimenti continua a estendere a destra
box.set_right(z.b, bar_index)
// Se la candela attuale è un record giornaliero, crea una nuova zona
if cAlto >= dHighBody
if high > cAlto
box nb = box.new(bar_index, high, bar_index, cAlto, border_color=color.new(color.red, 100), bgcolor=colorRes)
array.push(zonesR, Zone.new(nb, cAlto, true))
dHighBody := cAlto
// — 2. GESTIONE SUPPORTI (VERDE) —
// Ogni candela controlla TUTTE le zone verdi attive in memoria
if array.size(zonesS) > 0
for i = 0 to array.size(zonesS) – 1
z = array.get(zonesS, i)
if z.active
// Se il corpo attuale scende sotto il livello originale del body della zona
if cBasso < z.level
box.set_right(z.b, bar_index)
z.active := false
else
// Altrimenti continua a estendere a destra
box.set_right(z.b, bar_index)
// Se la candela attuale è un record giornaliero, crea una nuova zona
if cBasso <= dLowBody
if low < cBasso
box nb = box.new(bar_index, cBasso, bar_index, low, border_color=color.new(color.green, 100), bgcolor=colorSup)
array.push(zonesS, Zone.new(nb, cBasso, true))
dLowBody := cBasso
// — 3. PULIZIA AUTOMATICA —
// Rimuoviamo solo le zone più vecchie se superiamo il limite tecnico di TradingView (500 box)
if array.size(zonesR) + array.size(zonesS) > 450
if array.size(zonesR) > array.size(zonesS)
z_old = array.remove(zonesR, 0)
box.delete(z_old.b)
else
z_old = array.remove(zonesS, 0)
box.delete(z_old.b)
for tandem and Dax indicator – too much long -you can do 3 separated indicators for each one: first daily, after weekly and at last monthly. thanks
Hello. To better assist you, it would be helpful if you could add an image of each indicator. I would also appreciate it if you could create a separate post for each indicator. Thank you for your understanding.
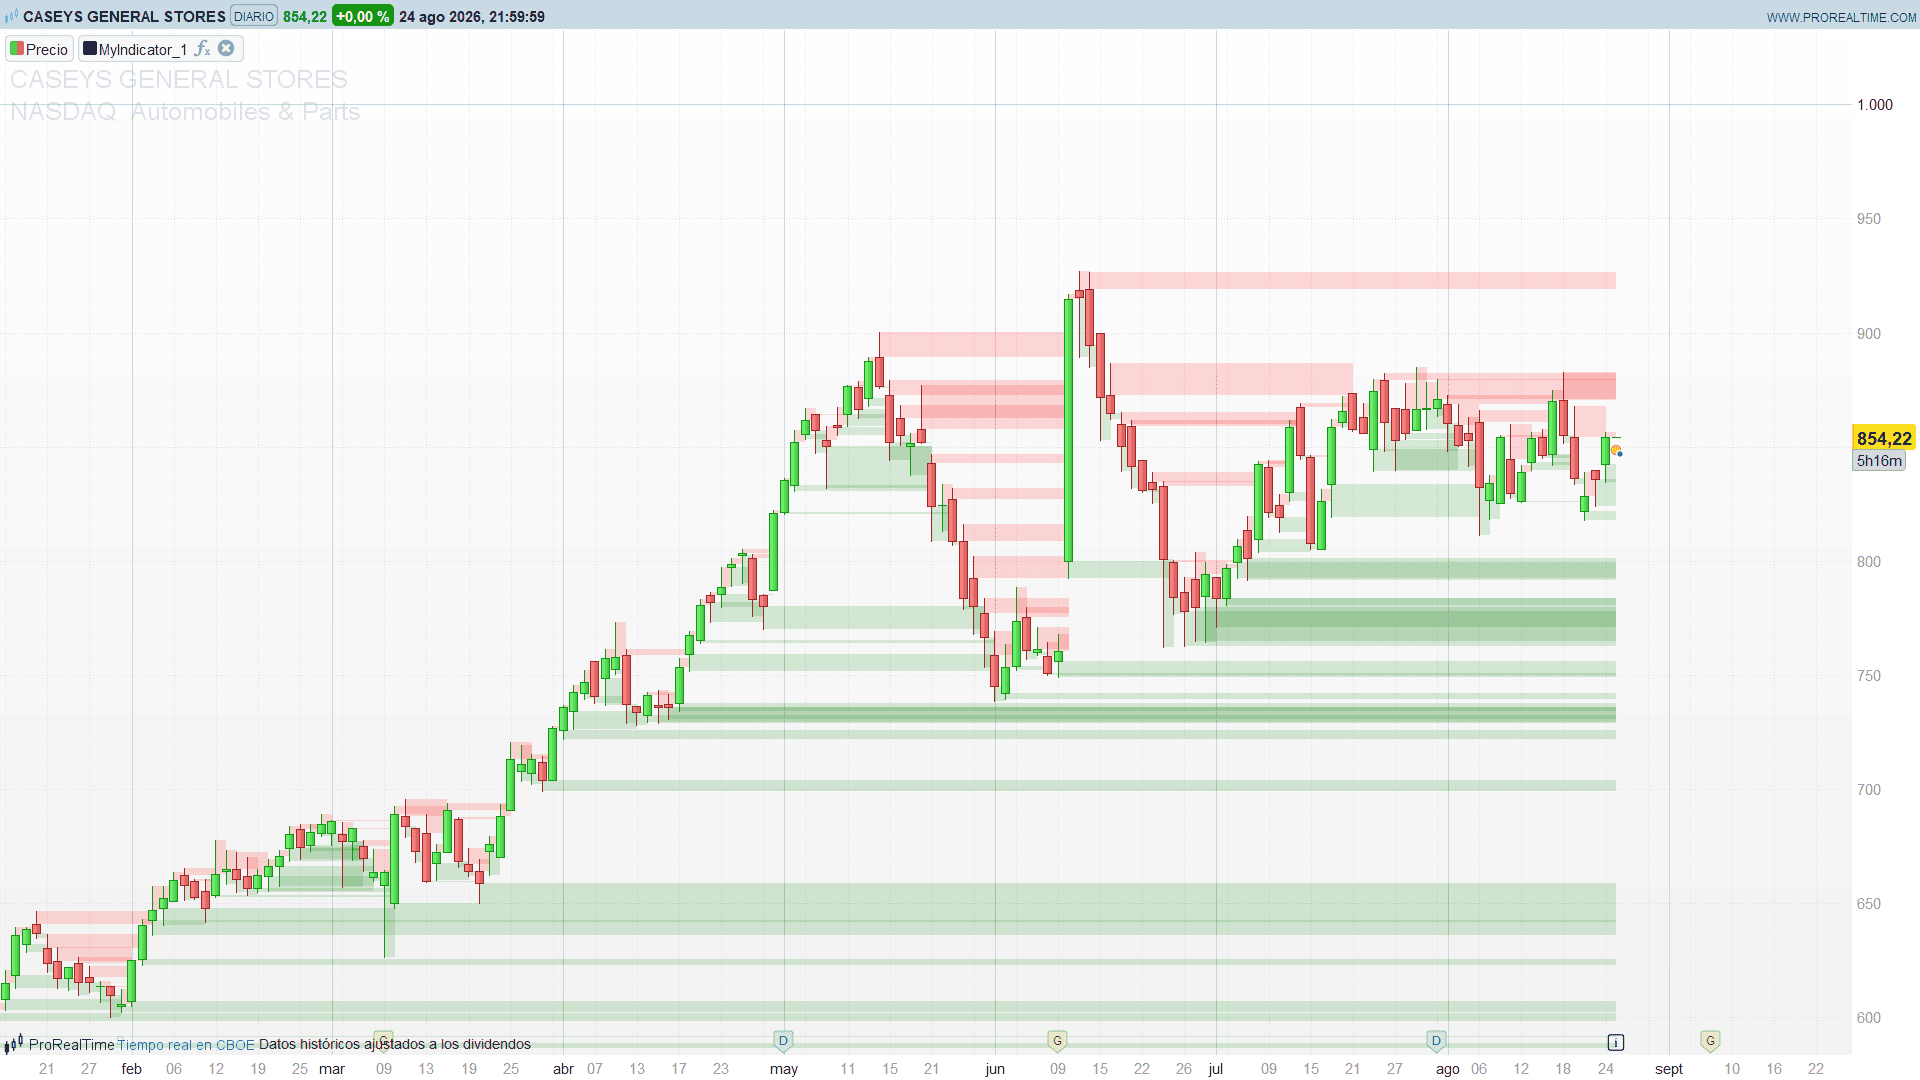
Meanwhile, here’s the shadow zones indicator.
//----------------------------------------------------------------------// // PRC_Shadow Zones - Infinite Body Memory // version = 1 // 25.08.2026 // Ivan Gonzalez @ www.prorealcode.com // Sharing ProRealTime knowledge //----------------------------------------------------------------------// // Every candle that sets a new intraday record for its BODY and leaves a // shadow behind paints that shadow as a zone. The zone keeps extending to // the right until a later BODY closes past the base of the shadow - that // is the moment the market "digests" what was once only a wick. // red : upper shadow of a new daily body-high record (resistance) // green : lower shadow of a new daily body-low record (support) // A zone frozen in the past stays on the chart as a record of where the // digestion happened. Apply on the price chart (overlay). // // Real-time stability: the live bar is recalculated on EVERY TICK and the // $ arrays do NOT rewind between ticks (scalars do). A zone killed by an // intrabar spike would stay dead even if price pulled back. So the whole // engine runs once per bar on the last CLOSED bar, behind a guard that // lives inside an array. Cost: the indicator is one bar behind. //----------------------------------------------------------------------// DEFPARAM drawonlastbaronly = true //-----Settings---------------------------------------------------------// maxZones = 150 // Zones kept per side (they are all repainted each bar) zoneAlpha = 38 // Fill opacity 0..255 (38 = the 85% transparency of the original) fuseSunday = 1 // 1 = a Sunday session belongs to Monday (futures). 0 = crypto 24/7 //-----Colours----------------------------------------------------------// resR = 255 resG = 0 resB = 0 supR = 0 supG = 128 supB = 0 //-----Persistent state: arrays only------------------------------------// // $gs[0] last processed bar (one-pass-per-bar guard) // $gs[1] nRes filled slots of the resistance ring buffer // $gs[2] wRes last written slot of the resistance ring buffer // $gs[3] nSup filled slots of the support ring buffer // $gs[4] wSup last written slot of the support ring buffer // $gs[5] dHiBody running daily record of the body high // $gs[6] dLoBody running daily record of the body low // $gs[7] resMin lower bound of the levels of the live resistance zones // $gs[8] supMax upper bound of the levels of the live support zones bigNum = 1000000000 IF barindex = 0 THEN $gs[0] = 0 - 1 $gs[1] = 0 $gs[2] = 0 $gs[3] = 0 $gs[4] = 0 $gs[5] = 0 - bigNum $gs[6] = bigNum $gs[7] = bigNum $gs[8] = 0 - bigNum ENDIF //-----Engine: one pass per bar, on the last CLOSED bar------------------// IF barindex >= 2 AND barindex > $gs[0] THEN $gs[0] = barindex pIdx = barindex - 1 pHi = high[1] pLo = low[1] cTop = max(open[1], close[1]) cBot = min(open[1], close[1]) // New day. A Sunday session is glued to Monday unless the instrument // trades 24/7, otherwise Monday would inherit the thin Sunday range. newDay = 0 IF date[1] date[2] THEN newDay = 1 ENDIF IF fuseSunday = 1 AND dayofweek[2] = 0 THEN newDay = 0 ENDIF nRes = $gs[1] wRes = $gs[2] nSup = $gs[3] wSup = $gs[4] dHiBody = $gs[5] dLoBody = $gs[6] resMin = $gs[7] supMax = $gs[8] IF newDay = 1 THEN dHiBody = 0 - bigNum dLoBody = bigNum ENDIF //-----(1) Resistances: bodies that eat an old upper shadow-----------// // The break level of a red zone IS its lower edge ($rzLo). Live levels // are non-increasing in creation order, so their minimum is enough to // know whether ANY of them can break on this bar: below it, skip. IF cTop > resMin THEN newMin = bigNum FOR i = 1 TO nRes DO IF $rzLive[i] = 1 THEN IF cTop > $rzLo[i] THEN $rzLive[i] = 0 $rzRight[i] = pIdx ELSE newMin = min(newMin, $rzLo[i]) ENDIF ENDIF NEXT resMin = newMin ENDIF //-----(2) Resistances: new daily body-high record--------------------// IF cTop >= dHiBody THEN IF pHi > cTop THEN wRes = wRes + 1 IF wRes > maxZones THEN wRes = 1 ENDIF IF nRes < maxZones THEN nRes = nRes + 1 ENDIF $rzLeft[wRes] = pIdx $rzHi[wRes] = pHi $rzLo[wRes] = cTop $rzRight[wRes] = pIdx $rzLive[wRes] = 1 resMin = min(resMin, cTop) ENDIF dHiBody = cTop ENDIF //-----(3) Supports: bodies that eat an old lower shadow--------------// IF cBot < supMax THEN newMax = 0 - bigNum FOR j = 1 TO nSup DO IF $szLive[j] = 1 THEN IF cBot < $szHi[j] THEN $szLive[j] = 0 $szRight[j] = pIdx ELSE newMax = max(newMax, $szHi[j]) ENDIF ENDIF NEXT supMax = newMax ENDIF //-----(4) Supports: new daily body-low record------------------------// IF cBot <= dLoBody THEN IF pLo maxZones THEN wSup = 1 ENDIF IF nSup < maxZones THEN nSup = nSup + 1 ENDIF $szLeft[wSup] = pIdx $szHi[wSup] = cBot $szLo[wSup] = pLo $szRight[wSup] = pIdx $szLive[wSup] = 1 supMax = max(supMax, cBot) ENDIF dLoBody = cBot ENDIF $gs[1] = nRes $gs[2] = wRes $gs[3] = nSup $gs[4] = wSup $gs[5] = dHiBody $gs[6] = dLoBody $gs[7] = resMin $gs[8] = supMax ENDIF //-----Repaint the whole map on the last bar-----------------------------// IF islastbarupdate THEN dRes = $gs[1] dSup = $gs[3] FOR i = 1 TO dRes DO IF $rzLive[i] = 1 THEN xr = barindex ELSE xr = $rzRight[i] ENDIF DRAWRECTANGLE($rzLeft[i], $rzHi[i], xr, $rzLo[i]) COLOURED(resR, resG, resB, 0) FILLCOLOR(resR, resG, resB, zoneAlpha) NEXT FOR j = 1 TO dSup DO IF $szLive[j] = 1 THEN xs = barindex ELSE xs = $szRight[j] ENDIF DRAWRECTANGLE($szLeft[j], $szHi[j], xs, $szLo[j]) COLOURED(supR, supG, supB, 0) FILLCOLOR(supR, supG, supB, zoneAlpha) NEXT ENDIF RETURN -
AuthorPosts
- You must be logged in to reply to this topic.

 New
New
Stuck on this ProBuilder code?
Describe what this topic is trying to build, in plain English, and ProRealAI writes the ProRealTime™ indicator, screener or system for you.


TradingView to ProRealTime Translation Center
Author

Summary
This topic contains 7 replies,
has 2 voices, and was last updated by  Iván González
4 weeks ago.
Topic Details
| Forum: | TradingView to ProRealTime Translation Center Forum |
| Started: | 08/16/2026 |
| Status: | Active |
| Attachments: | 1 files |
The information collected on this form is stored in a computer file by ProRealCode to create and access your ProRealCode profile. This data is kept in a secure database for the duration of the member's membership. They will be kept as long as you use our services and will be automatically deleted after 3 years of inactivity. Your personal data is used to create your private profile on ProRealCode. This data is maintained by SAS ProRealCode, 407 rue Freycinet, 59151 Arleux, France. If you subscribe to our newsletters, your email address is provided to our service provider "MailChimp" located in the United States, with whom we have signed a confidentiality agreement. This company is also compliant with the EU/Swiss Privacy Shield, and the GDPR. For any request for correction or deletion concerning your data, you can directly contact the ProRealCode team by email at privacy@prorealcode.com If you would like to lodge a complaint regarding the use of your personal data, you can contact your data protection supervisory authority.