Rectangles superposés

Viewing 5 posts - 1 through 5 (of 5 total)
  • Author
    Posts
  • #253376 quote
    Bernard13Bernard13
    Participant
    Senior

    Bonjour,
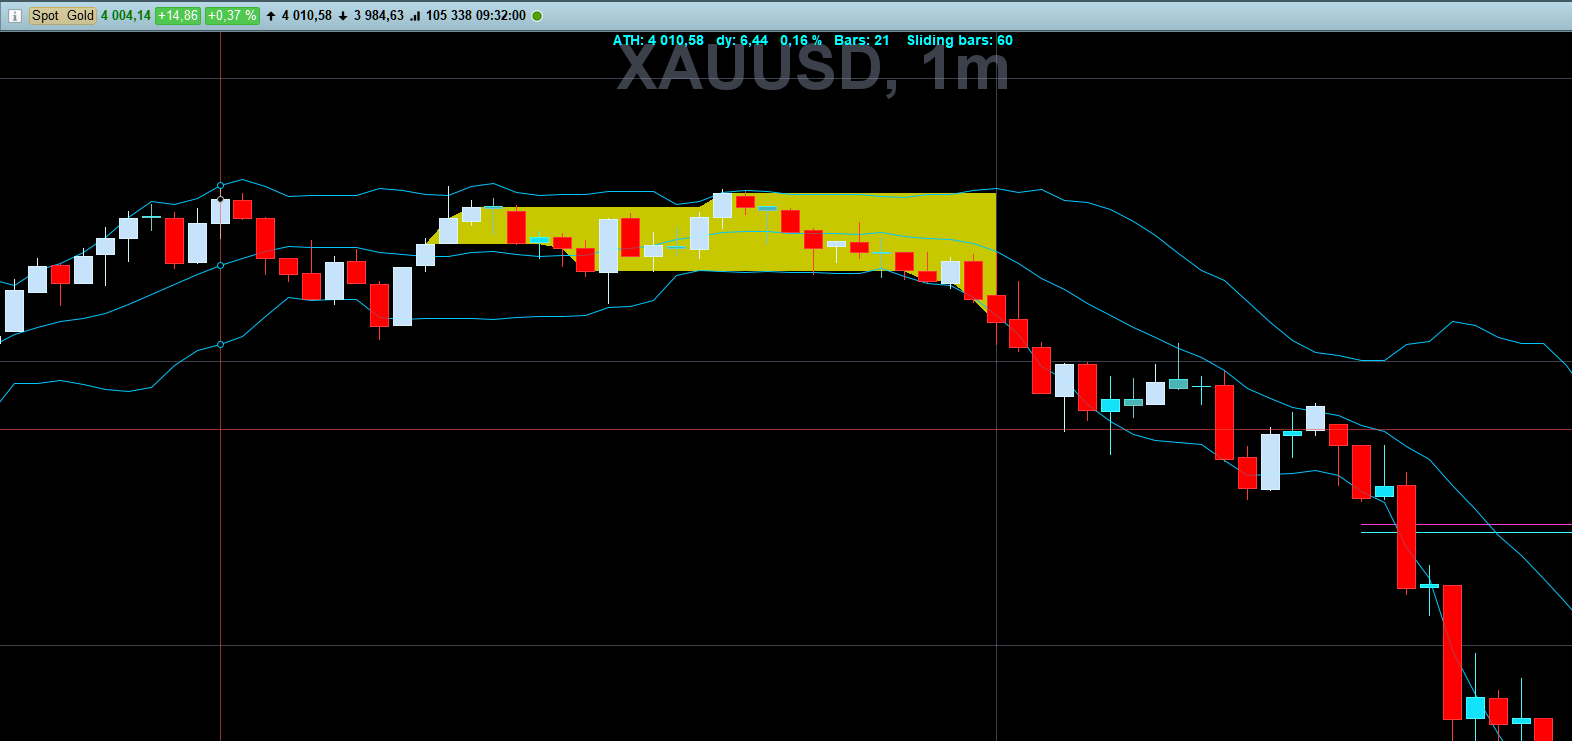
    Je ne sais pas comment m’y prendre pour transformer mon code ci-dessous afin d’obtenir sur le graph que les derniers rectangles des Ranges Bollinger sur l’historique et éviter ainsi les superpositions. Merci d’avance.

    // Bollinger Range
    
    //DEFPARAM DrawOnLastBarOnly= True // Force the graph to the right.   => Uniquement le dernier rectangle dessiné.
    DEFPARAM DrawOnLastBarOnly= False // No force the graph to the right. => Tous les rectangles mais tous repeints.
    
    Src= Close
    deltaRangeBB= 5 // Range de 5 points sur le Spot Gold: XAUUSD
    
    BBup= BollingerUp[20](close)
    BBdn= BollingerDown[20](close)
    RangeBB= BBup - BBdn // En points
    LenRange= LenRange + 1 // longueur du range
    
    IF RangeBB >= deltaRangeBB THEN
    lenRange= 1
    xRange= BarIndex
    ELSE // Range en court
    HH= Highest[LenRange](Src)
    LL= Lowest[LenRange](Src)
    DrawRectangle(xRange, LL, Barindex, HH) Coloured("Yellow", 50) BorderColor("Yellow", 0)
    ENDIF
    
    RETURN
    
    Bollinger-Range-Capture-decran-2025-11-06-170338.png Bollinger-Range-Capture-decran-2025-11-06-170338.png
    #253390 quote
    Iván GonzálezIván González
    Moderator
    Legend
    //DEFPARAM DrawOnLastBarOnly = False
    
    deltaRangeBB = 15
    period = 20
    
    BBup = BollingerUp[period](close)
    BBdn = BollingerDown[period](close)
    RangeBB = BBup - BBdn
    
    ONCE isInRange = 0
    ONCE xStartRange = 0
    ONCE HH = 0
    ONCE LL = 0
    
    IF RangeBB >= deltaRangeBB THEN
    
    IF isInRange = 1 THEN
    DrawRectangle(xStartRange, LL, BarIndex - 1, HH) COLOURED("Blue", 50) BorderColor("Blue", 0)
    ENDIF
     
    isInRange = 0
    
    ELSE
    
    IF isInRange = 0 THEN
    isInRange = 1
    xStartRange = BarIndex
    HH = high
    LL = low
    ELSE
    HH = MAX(HH, high)
    LL = MIN(LL, low)
    ENDIF
    ENDIF
    
    IF isInRange = 1 AND islastbarupdate THEN
    DrawRectangle(xStartRange, LL, BarIndex, HH) COLOURED("Blue", 50) BorderColor("Blue")
    ENDIF
    
    RETURN
    Bernard13 thanked this post
    #253391 quote
    Bernard13Bernard13
    Participant
    Senior

    Bonjour,
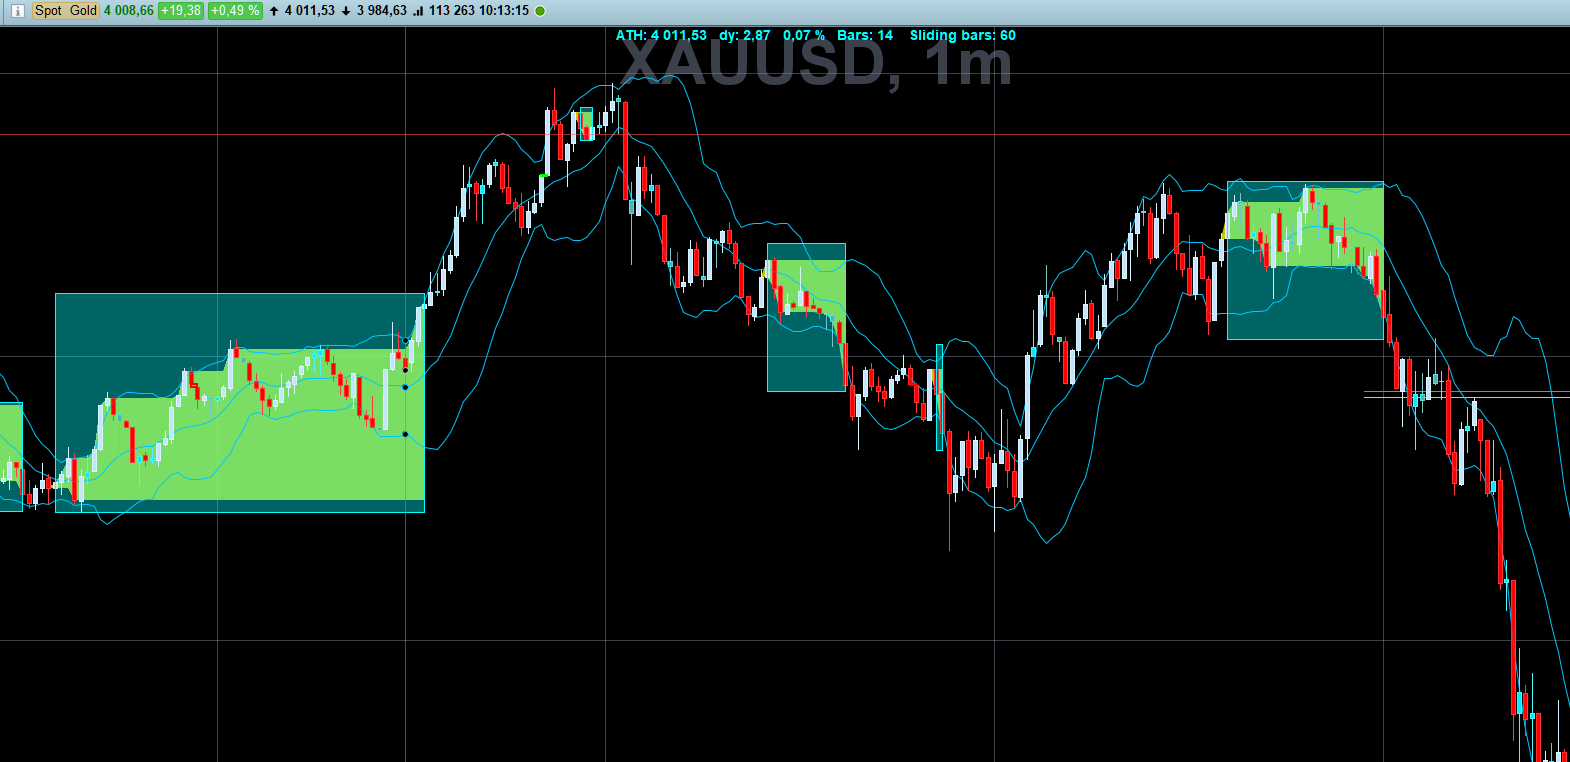
    Finalement, j’ai trouvé la solution sans passer par les DEFPARAM, ou un LookBack et des tableaux.
    C’est en forgeant, qu’on devient forgeron !
    Bon codage à Toutes et à Tous. 🙂

    // Bollinger Range

    //DEFPARAM DrawOnLastBarOnly= True // Force the graph to the right. => Uniquement le dernier rectangle dessiné.
    //DEFPARAM DrawOnLastBarOnly= False // No force the graph to the right. => Tous les rectangles mais tous repeint.

    src= Close
    //deltaRangeBB= 5 // Range de 5 points sur le Spot Gold: XAUUSD

    BBup= BollingerUp[pBB](src)
    BBdn= BollingerDown[pBB](src)
    RangeBB= BBup – BBdn // En points

    LenRange= LenRange + 1 // longueur du range

    IF RangeBB >= deltaRangeBB THEN // Extinction du Range
    lenRange= 1
    HH= Highest[LenRange](Src)
    LL= HH //Lowest[LenRange](Src) // Evite les bavures à 0 de ColorBetween
    a= 0
    ELSE // Range en court
    HH= Highest[LenRange](Src)
    LL= Lowest[LenRange](Src)
    a= 200
    ENDIF

    ColorBetween(HH,LL,”Yellow”,a)

    RETURN

    Iván González thanked this post
    Range-TEST-Capture-decran-2025-11-07-093215.png Range-TEST-Capture-decran-2025-11-07-093215.png
    #253393 quote
    Bernard13Bernard13
    Participant
    Senior

    Merci Ivan,
    Ce matin, nos publications se sont presque télescopées ! …
    Je vais expérimenter ta solution.

    Merci encore pour l’immense travail que tu fournis en publications et traductions sur ce site.

    #253394 quote
    Bernard13Bernard13
    Participant
    Senior

    Rebonjour Ivan,
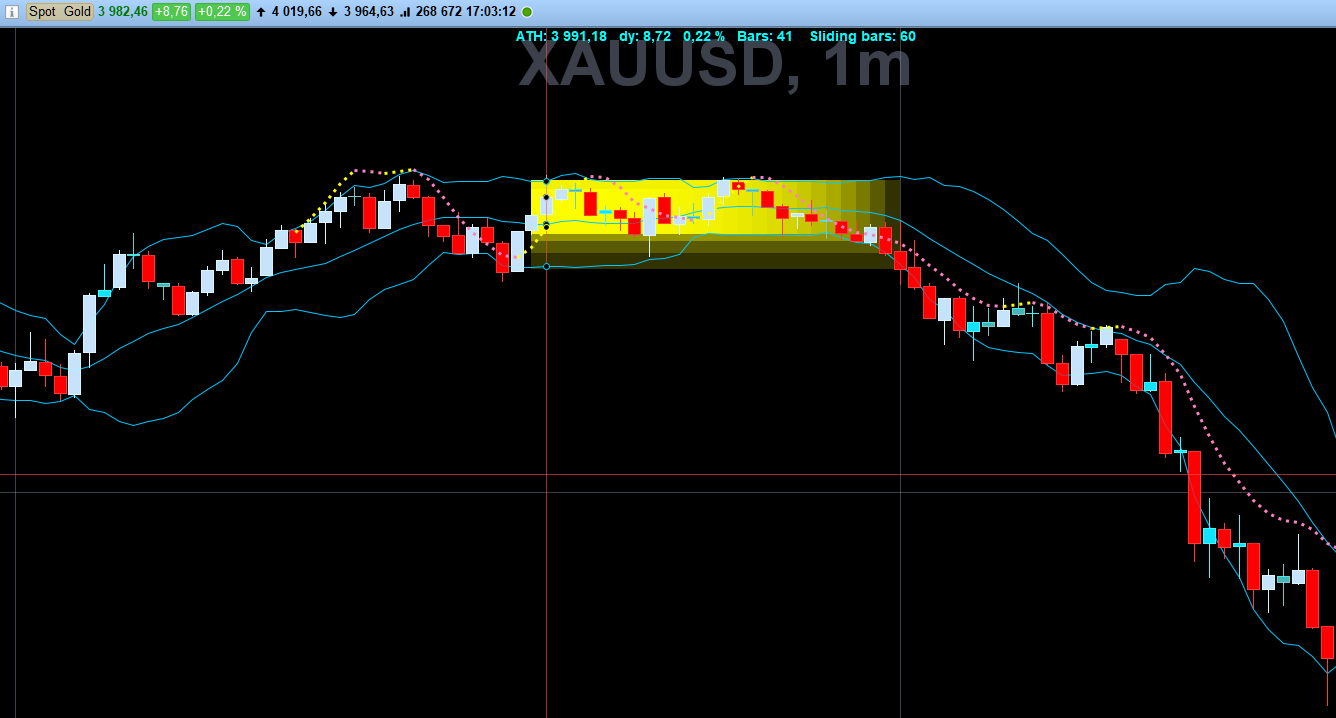
    Voici la superposition des 2 solutions: Rectangles / ColorBetween
    Bons Trades.

    Iván González thanked this post
    Test-Rectangle-ColorBetween-Capture-decran-2025-11-07-101331.png Test-Rectangle-ColorBetween-Capture-decran-2025-11-07-101331.png
Viewing 5 posts - 1 through 5 (of 5 total)

  • You must be logged in to reply to this topic.

ProRealAI ProRealAI New

Stuck on this ProBuilder code?

Describe what this topic is trying to build, in plain English, and ProRealAI writes the ProRealTime™ indicator, screener or system for you.

Available in 7 languages
Try ProRealAI

Rectangles superposés


ProBuilder : Indicateurs & Outils Personnalisés

New Reply
Author
author-avatar
Bernard13 @bernard13 Participant
Summary

This topic contains 4 replies,
has 2 voices, and was last updated by Bernard13Bernard13
10 months, 2 weeks ago.

Topic Details
Forum: ProBuilder : Indicateurs & Outils Personnalisés
Language: French
Started: 11/06/2025
Status: Active
Attachments: 3 files
ProRealCode ProRealCode
Loading...