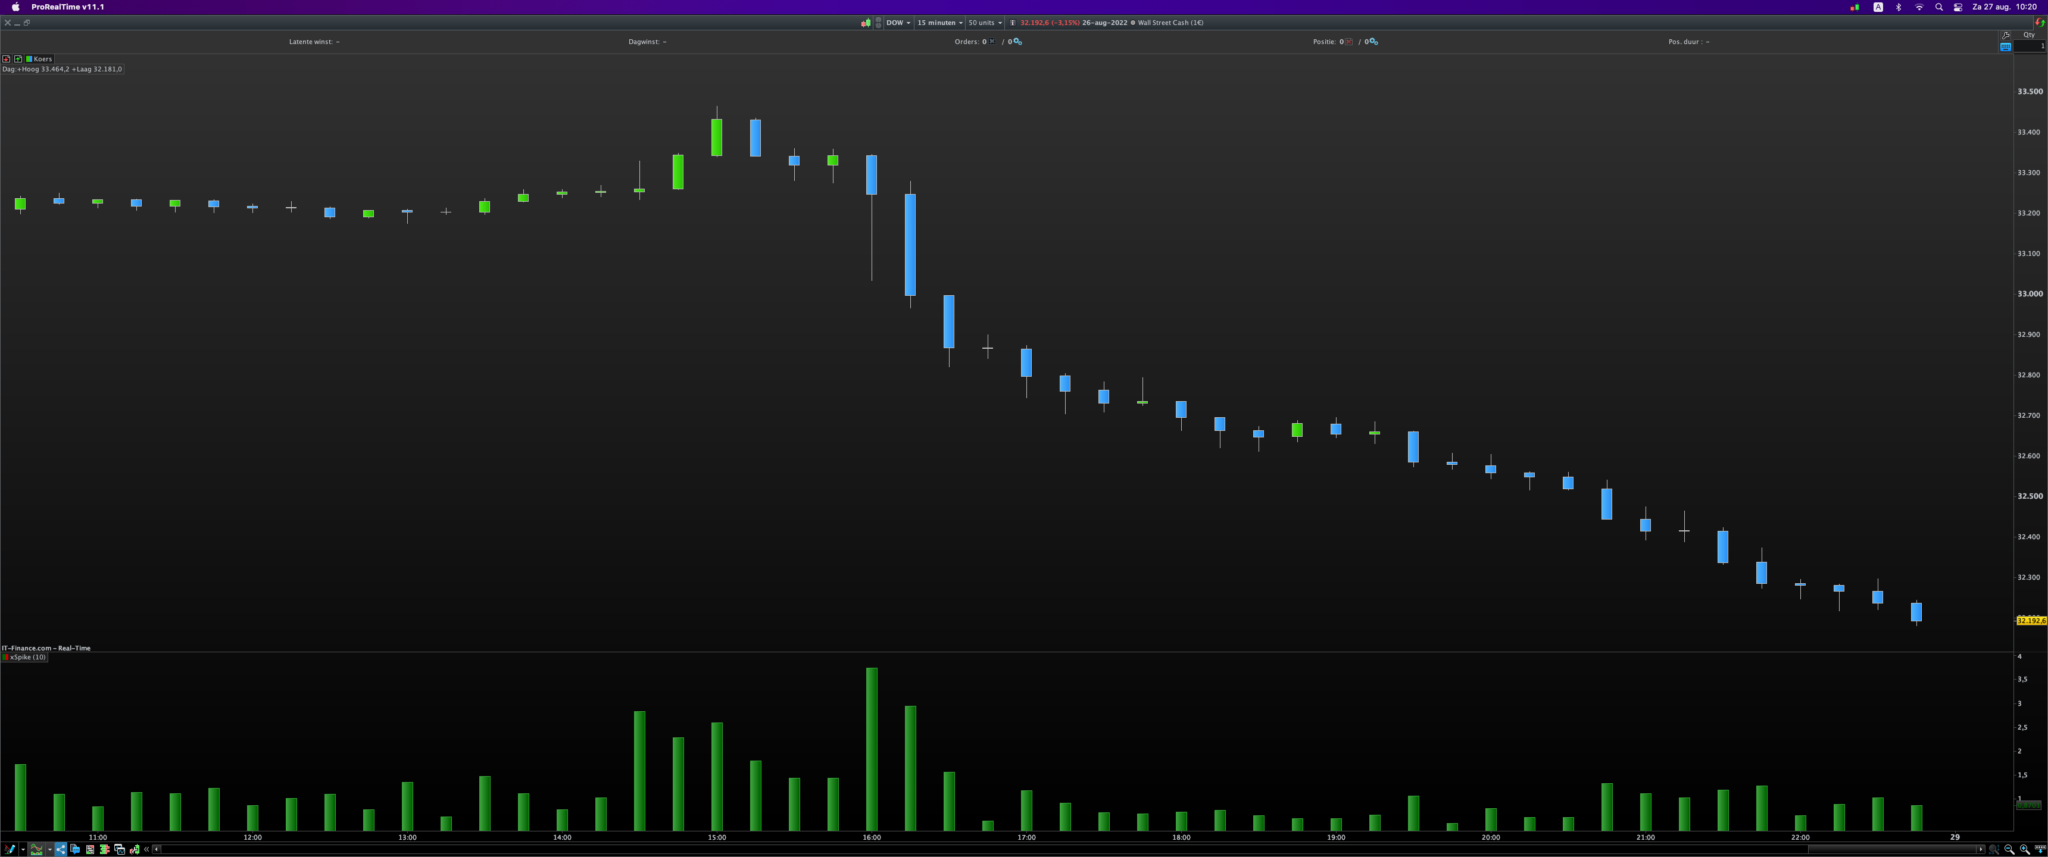
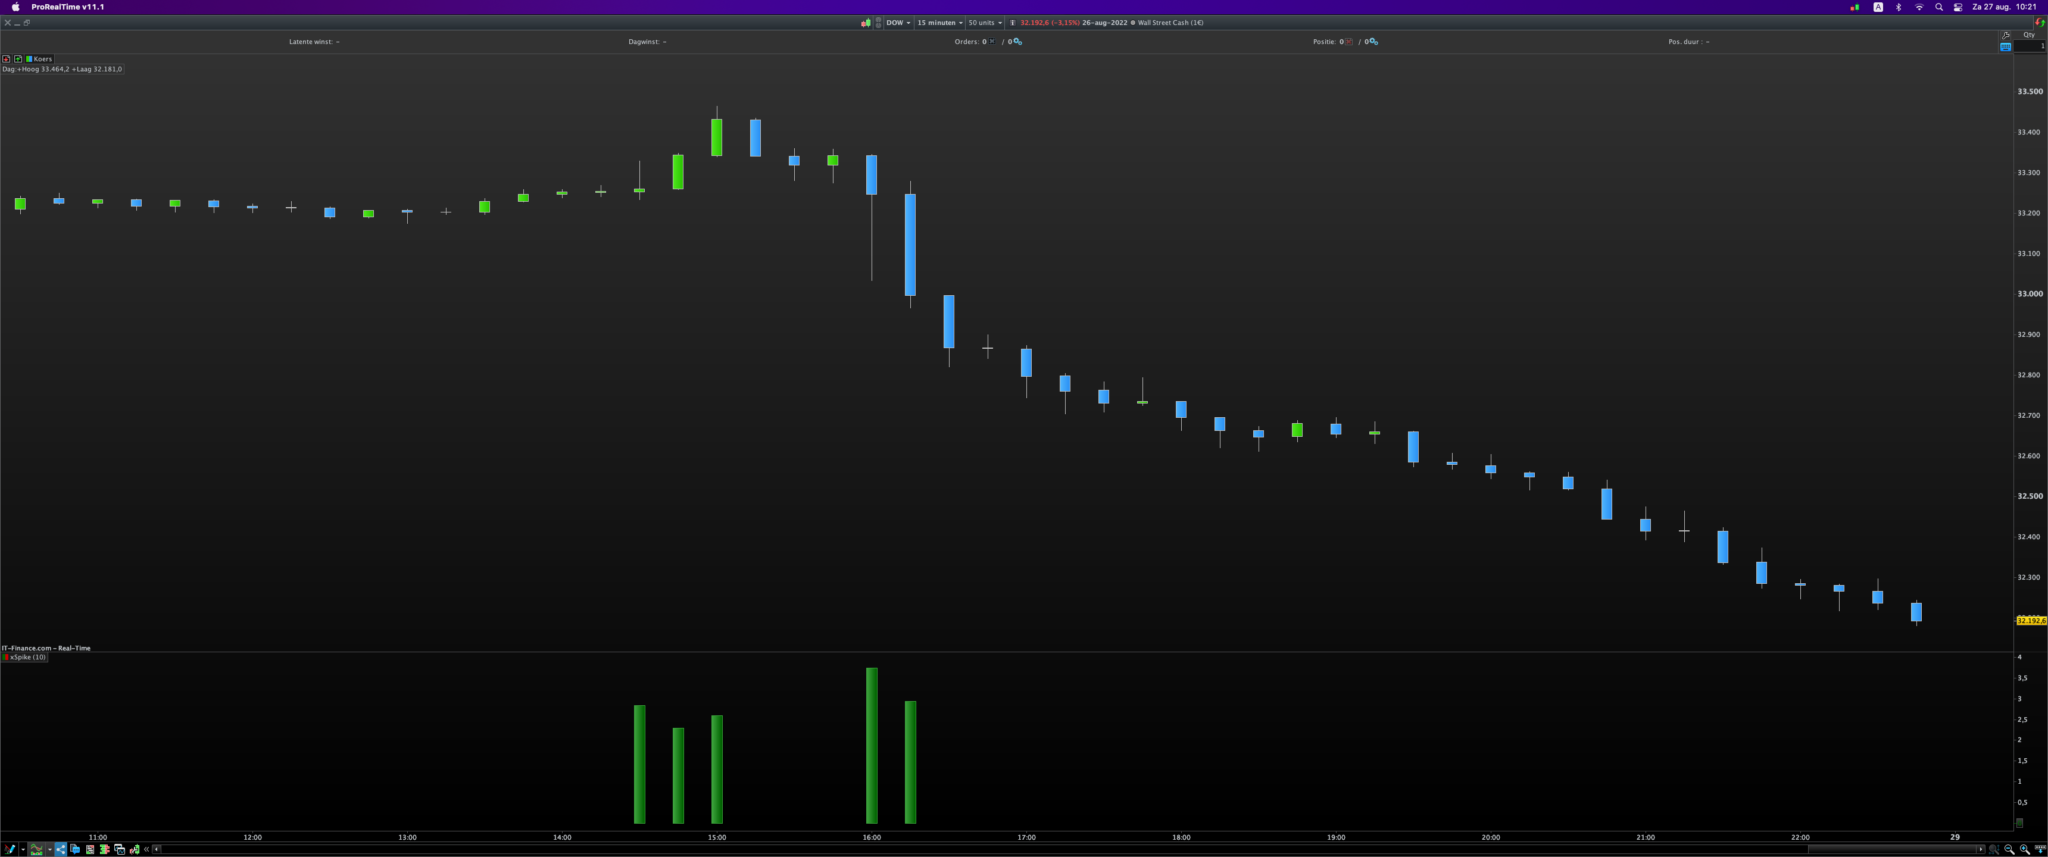
Price spike histogram bars showing multiple of ATR

Viewing 8 posts - 1 through 8 (of 8 total)

  • Author
    Posts
  • #199698 quote
    jwh145jwh145
    Participant
    New

    Hi,

    I am looking for an histogram indicator which provides bars when price moves by a multiple of its average true range over a certain number of days ie if the average true range is 5c and there is a current price range of 10c in the last 10 days then a spike bar will appear.

    Any assistance would be appreciated.

    Jonathan

    #199701 quote
    JSJS
    Participant
    Master
    ATR = AverageTrueRange[n](Close)
    
    xSpike = (Range / ATR)
    
    //If xSpike < 2 then
    //xSpike = 0
    //EndIf
    
    Return xSpike style (Histogram) as "xSpike"
    
    Hi @jwh145

    I used the “Range” here divided by the “ATR”.

    You can have this drawn in a histogram and if you only want to have a ratio greater than, for example, two than:

    xSpike = Range / ATR

    If Range/ATR < 2 then

    xSpike = 0

    EndIf

    jwh145 and Nicolas thanked this post
    Schermafbeelding-2022-08-27-om-10.21.26.png Schermafbeelding-2022-08-27-om-10.21.26.png Schermafbeelding-2022-08-27-om-10.20.49.png Schermafbeelding-2022-08-27-om-10.20.49.png
    #199732 quote
    jwh145jwh145
    Participant
    New
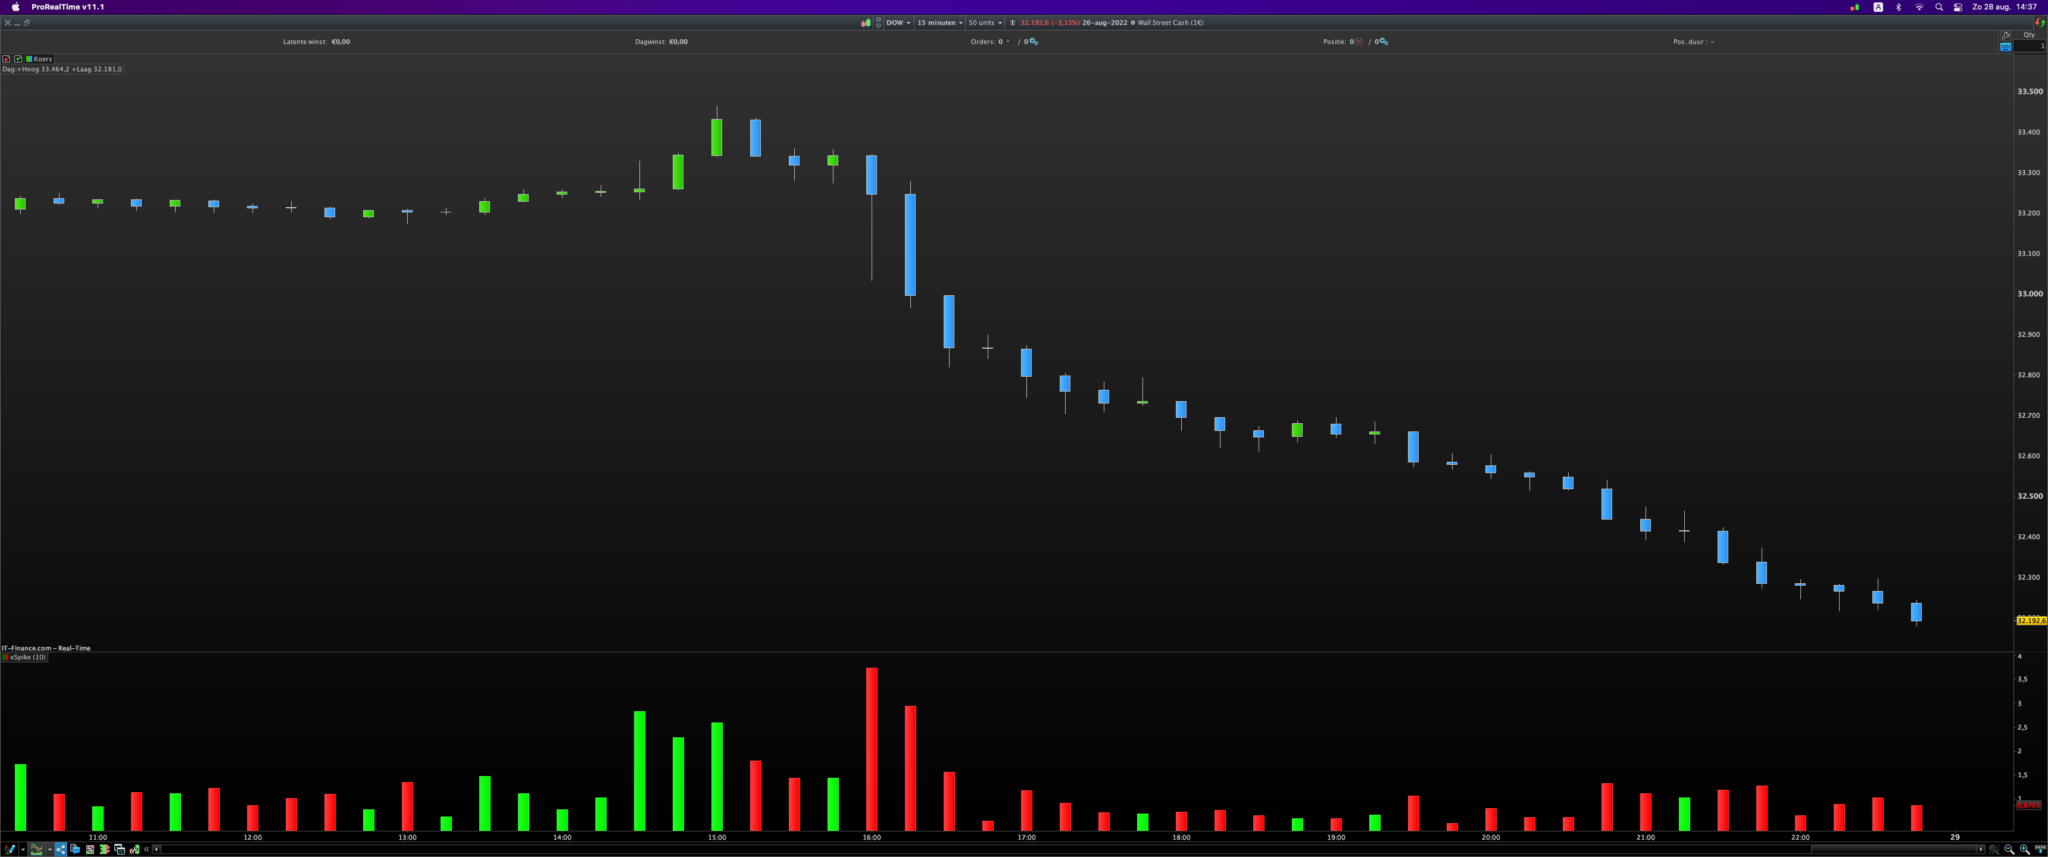
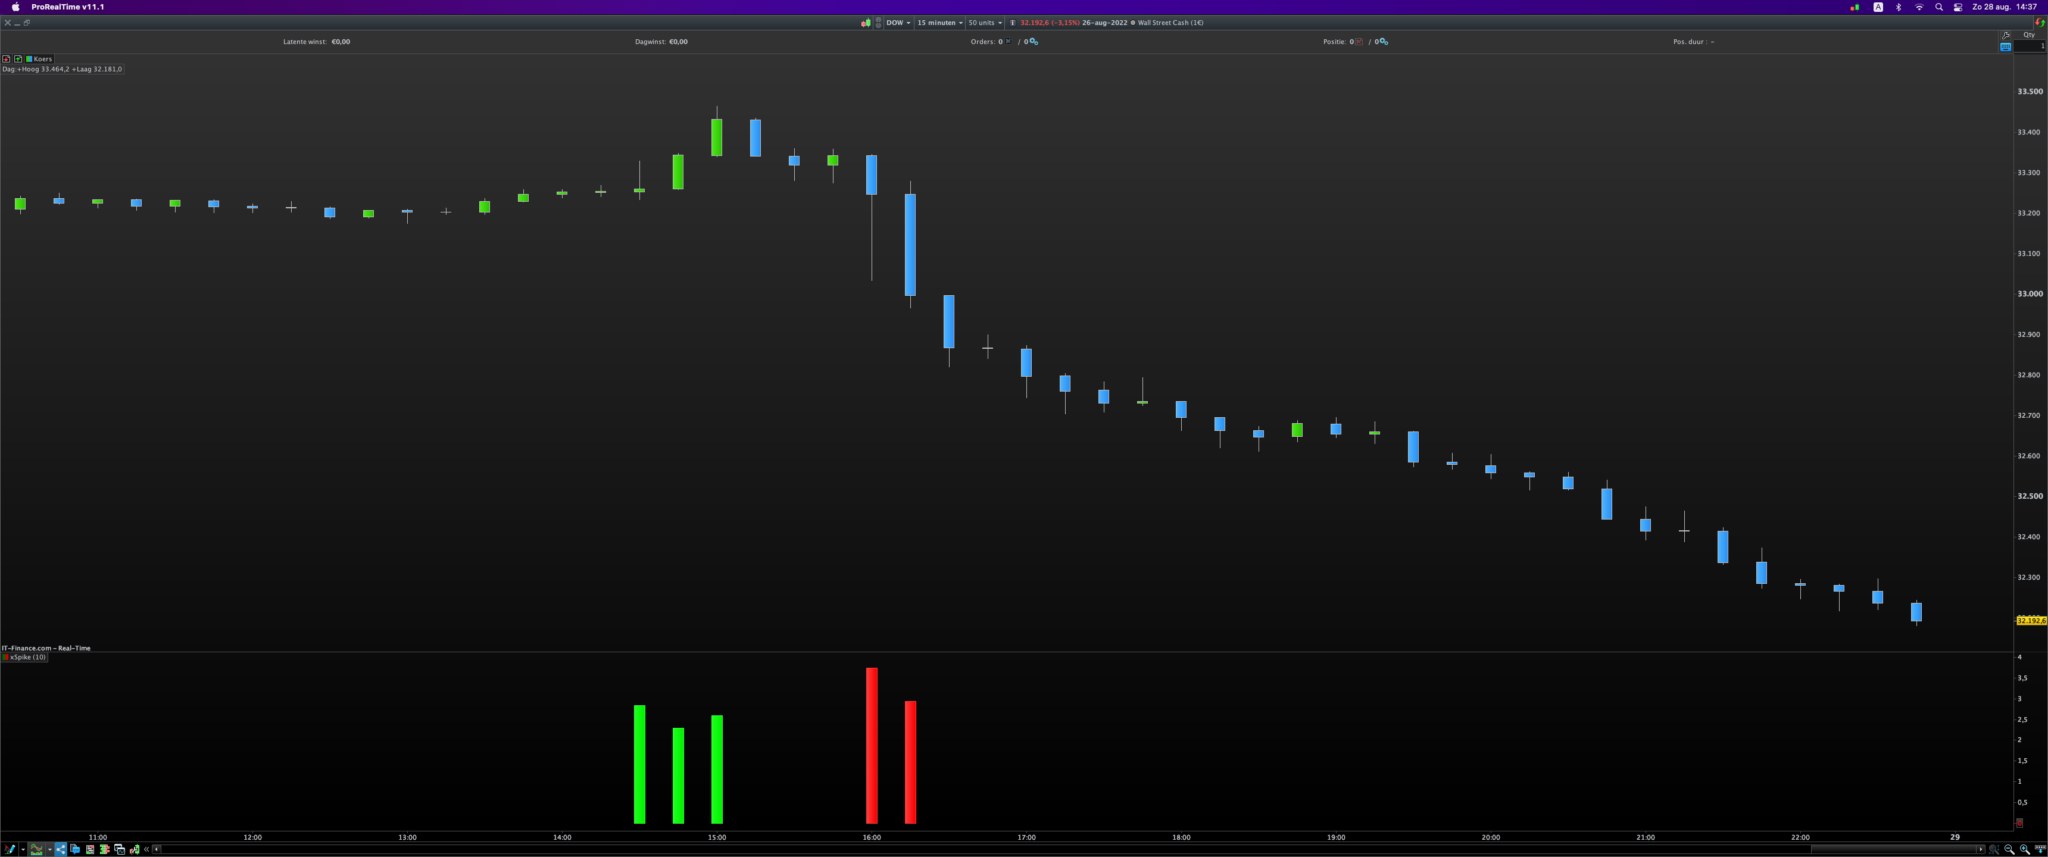
    Hi JS, Thanks for your help on this, much appreciated. Do you know if there is a way to color the bar say RED if it was lower close than open and Green if higher close than open? Cheers Jono
    #199749 quote
    JSJS
    Participant
    Master
    ONCE n = 10
    
    ATR = AverageTrueRange[n](Close)
    
    xSpike = (Range / ATR)
    
    If xSpike < 2 then
    xSpike = 0
    EndIf
    
    If Close < Open then
    R=255
    G=0
    B=0
    else
    R=0
    G=255
    B=0
    EndIf
    
    Return xSpike Coloured (R,G,B) style (Histogram) as "xSpike"
    
    Schermafbeelding-2022-08-28-om-14.37.29.png Schermafbeelding-2022-08-28-om-14.37.29.png Schermafbeelding-2022-08-28-om-14.37.08.png Schermafbeelding-2022-08-28-om-14.37.08.png
    #199784 quote
    jwh145jwh145
    Participant
    New
    Thanks JS!
    #200227 quote
    jwh145jwh145
    Participant
    New
    Hi JS, Do you happen to have or could provide code that screens for tickers up or down a certain % over a lookback period, eg up 25% over last 20 days? I can’t seem to see any screeners like this in the library. Jono
    #200247 quote
    JSJS
    Participant
    Master
    xPeriod = 20 //20 days
    xGain = 25 //25%
    Signal = 0
    If (Close - Close[xPeriod])/Close[xPeriod]*100 >= xGain then
    Signal = 1
    EndIf
    SCREENER[Signal](Signal as "1 = LONG")
    
    Hi @jwh145 Try this one…
    #200255 quote
    jwh145jwh145
    Participant
    New
    Thanks JS, works well 🙂
    JS thanked this post
Viewing 8 posts - 1 through 8 (of 8 total)
  • You must be logged in to reply to this topic.

ProRealAI ProRealAI New

Stuck on this ProBuilder code?

Describe what this topic is trying to build, in plain English, and ProRealAI writes the ProRealTime™ indicator, screener or system for you.

Available in 7 languages
Try ProRealAI

Price spike histogram bars showing multiple of ATR


ProBuilder: Indicators & Custom Tools

New Reply
Author
author-avatar
jwh145 @jwh145 Participant
Summary

This topic contains 7 replies,
has 2 voices, and was last updated by jwh145jwh145

4 years ago.

Topic Details
Forum: ProBuilder: Indicators & Custom Tools
Language: English
Started: 08/27/2022
Status: Active
Attachments: 4 files
ProRealCode ProRealCode
Loading...