Please Convert Harmonic Pattern to Proealtime

Viewing 5 posts - 1 through 5 (of 5 total)
  • Author
    Posts
  • #238811 quote
    yasyas
    Participant
    Junior

    // This Pine Script™ code is subject to the terms of the Mozilla Public License 2.0 at https://mozilla.org/MPL/2.0/
    // © TFlab
    //@version=5

    indicator(“Shark Harmonic Pattern [TradingFinder] Shark Detector Indicator”, “Shark Pattern TFlab” ,overlay = true, max_bars_back = 5000, max_lines_count = 500, max_labels_count = 500)

    // Import Library
    import TFlab/Harmonic_Chart_Pattern_Library_TradingFinder/1 as HP
    import TFlab/AlertSenderLibrary_TradingFinder/1 as AlertSender
    import TFlab/Dark_Light_Theme_TradingFinder_Switching_Colors_Library/1 as Color

    // Logical Input
    PP = input.int(3, ‘ZigZag Pivot Period’, group = ‘Logical Setting’)
    ShVF = input.bool(false , ‘Show Valid Format’, group = ‘Logical Setting’)
    FLPC = input.bool(false , ‘Show Formation Last Pivot Confirm’, group = ‘Logical Setting’)
    FLPCPeriod =input.int(2, ‘Period of Formation Last Pivot’, group = ‘Logical Setting’)

    // Display Input
    ShowBull = input.bool(true, ‘Show Bullish Pattern’, group = ‘Display Setting’)
    ShowBear = input.bool(true, ‘Show Bearish Pattern’, group = ‘Display Setting’)
    ColorBull = input.color(#0609bb, ‘Color Bullish Pattern’, group = ‘Display Setting’)
    ColorBear = input.color(#0609bb, ‘Color Bearish Pattern’, group = ‘Display Setting’)
    LineWidth = input.int(1 , ‘Width Line’, group = ‘Display Setting’)
    LabelSize = input.string(size.small , ‘Label size’ , options = [size.auto, size.tiny, size.small, size.normal, size.large, size.huge], group = ‘Display Setting’)
    Mode =input.string(‘Light’, ‘Switching Colors Theme Mode’, options = [‘Off’, ‘Light’, ‘Dark’], group = ‘Display Setting’)
    [ColorBullish] = Color.SwitchingColorMode(ColorBull, Mode )
    [ColorBearish] = Color.SwitchingColorMode(ColorBear, Mode )

    // Alert Input
    Alert = input.string(‘On’, ‘Alert’, [‘On’, ‘Off’], ‘If you turn on the Alert, you can receive alerts and notifications after setting the “Alert”.’, group = ‘Alert’)
    AlertName = input.string(‘Shark Harmonic Pattern [TradingFinder]’, ‘Alert Name’, group = ‘Alert’)
    Frequncy = input.string(‘Once Per Bar’ , ‘Message Frequency’ , [‘All’, ‘Once Per Bar’ , ‘Per Bar Close’], ‘The triggering frequency. Possible values are: All’+
    ‘ (all function calls trigger the alert), Once Per Bar (the first function call during the bar triggers the alert), ‘ +
    ‘ Per Bar Close (the function call triggers the alert only when it occurs during the last script iteration of the real-time bar,’ +
    ‘ when it closes). The default is alert.freq_once_per_bar.)’, group = ‘Alert’)
    UTC = input.string(‘UTC’ , ‘Show Alert time by Time Zone’, group = ‘Alert’)
    MessageBull = input.text_area(‘Long Signal Position Based on Shark Harmonic Pattern’ , ‘Long Position Message’ , group = ‘Alert’)
    MessageBear = input.text_area(‘Short Signal Position Based on Shark Harmonic Pattern’, ‘Short Position Message’,group = ‘Alert’)

    // Call Harmonic Pattern Function
    [BullAlert, BullCandleConfirm] = HP.XABCD(‘Bullish Shark’, ‘Bullish’, ShowBull, ColorBullish , LineWidth, LabelSize ,ShVF, FLPC, FLPCPeriod, PP, 0.10, 0.90, 1.13, 1.618, 1.618, 2.24,0.886, 1.13 )
    [BearAlert, BearCandleConfirm] = HP.XABCD(‘Bearish Shark’, ‘Bearish’, ShowBear, ColorBearish , LineWidth, LabelSize ,ShVF, FLPC, FLPCPeriod, PP, 0.10, 0.90, 1.13, 1.618, 1.618, 2.24,0.886, 1.13 )

    // Call Alert Sender Function
    AlertSender.AlertSender(BullAlert , Alert, AlertName , ‘Analysis’, ”, ‘Basic’ ,’Once Per Bar’, ‘UTC’, ‘Off’, MessageBull, open, high, low, close,0,0,0,0,0)
    AlertSender.AlertSender(BearAlert , Alert, AlertName , ‘Analysis’, ”, ‘Basic’ ,’Once Per Bar’, ‘UTC’, ‘Off’, MessageBear, open, high, low, close,0,0,0,0,0)

    // Candle Confirmation
    plotshape(BearCandleConfirm, style = shape.arrowdown, color = color.red)
    plotshape(BullCandleConfirm, style = shape.arrowup, color = color.green, location = location.belowbar )

    #238820 quote
    Iván GonzálezIván González
    Moderator
    Legend

    Sorry, but this code cannot be translated because it is not complete. The libraries it mentions are missing.

    // Import Library

    import TFlab/Harmonic_Chart_Pattern_Library_TradingFinder/1 as HP
    import TFlab/AlertSenderLibrary_TradingFinder/1 as AlertSender
    import TFlab/Dark_Light_Theme_TradingFinder_Switching_Colors_Library/1 as Color

    #238828 quote
    yasyas
    Participant
    Junior

    hi ivan

    Please try the below if that can be converted many thanks


    // This work is licensed under a Attribution-NonCommercial-ShareAlike 4.0 International (CC BY-NC-SA 4.0) https://creativecommons.org/licenses/by-nc-sa/4.0/
    // © LuxAlgo

    //@version=5
    indicator(“Harmonic Pattern Detection [LuxAlgo]”,overlay=true)
    precision = input.float(.01,’XA Precision’,step=0.01,group=’Precision’)
    bullish = input(#0cb51a,’Bullish’,group=’style’)
    bearish = input(#ff1100,’Bullish’,group=’style’)

    x = input.time(0,’X’,confirm=true,group=’Anchor Points’)
    a = input.time(0,’A’,confirm=true,group=’Anchor Points’)
    b = input.time(0,’B’,confirm=true,group=’Anchor Points’)
    c = input.time(0,’C’,confirm=true,group=’Anchor Points’)
    d = input.time(0,’D’,confirm=true,group=’Anchor Points’)
    //—-
    x_y = ta.valuewhen(time==x,close,0)
    a_y = ta.valuewhen(time==a,close,0)
    b_y = ta.valuewhen(time==b,close,0)
    c_y = ta.valuewhen(time==c,close,0)
    //—-
    dist(fib)=>
    d_y = a_y + fib*(x_y – a_y)
    cd = math.abs(d_y-c_y)/math.abs(c_y-b_y)

    ab = math.abs(a_y-b_y)/math.abs(a_y-x_y)
    bc = math.abs(c_y-b_y)/math.abs(a_y-b_y)
    //—-
    var tb = table.new(position.top_right,2,4,bgcolor=color.gray)

    var float upper_prz = na
    var float lower_prz = na
    var float d_y = na

    if time == math.max(x,a,b,c)
    css = x_y > a_y ? bearish : bullish

    line.new(x,x_y,a,a_y,xloc=xloc.bar_time,color=css,width=2)
    line.new(a,a_y,b,b_y,xloc=xloc.bar_time,color=css,width=2)
    line.new(b,b_y,c,c_y,xloc=xloc.bar_time,color=css,width=2)

    line.new(x,x_y,b,b_y,xloc=xloc.bar_time,color=css,style=line.style_dotted)
    line.new(x,x_y,b,b_y,xloc=xloc.bar_time,color=css,style=line.style_dotted)
    line.new(a,a_y,c,c_y,xloc=xloc.bar_time,color=css,style=line.style_dotted)

    //—-

    label.new(x,x_y,’X’,xloc=xloc.bar_time,color=css,style=x_y > a_y ? label.style_label_down : label.style_label_up
    ,textcolor=color.white,size=size.small)
    label.new(a,a_y,’A’,xloc=xloc.bar_time,color=css,style=x_y > a_y ? label.style_label_up : label.style_label_down
    ,textcolor=color.white,size=size.small)
    label.new(b,b_y,’B’,xloc=xloc.bar_time,color=css,style=x_y > a_y ? label.style_label_down : label.style_label_up
    ,textcolor=color.white,size=size.small)
    label.new(c,c_y,’C’,xloc=xloc.bar_time,color=css,style=x_y > a_y ? label.style_label_up : label.style_label_down
    ,textcolor=color.white,size=size.small)

    AB_tooltip = ‘🦇 0.382-0.5 \n📏 ≈ 0.618 \n🦋 ≈ 0.786 \n🦀 0.382-0.618’
    BC_tooltip = ‘🦇 0.382-0.886 \n📏 0.382-0.886 \n🦋 0.382-0.886 \n🦀 0.382-0.886’
    CD_tooltip = ‘🦇 1.618-2.618 \n📏 1.130-1.618 \n🦋 1.618-2.240 \n🦀 2.618-3.618′

    label.new(int(math.avg(x,b)),math.avg(x_y,b_y),str.tostring(ab,’#.###’),xloc=xloc.bar_time,color=css,style=label.style_label_center
    ,textcolor=color.white,size=size.small,tooltip=AB_tooltip)
    label.new(int(math.avg(a,c)),math.avg(a_y,c_y),str.tostring(bc,’#.###’),xloc=xloc.bar_time,color=css,style=label.style_label_center
    ,textcolor=color.white,size=size.small,tooltip=BC_tooltip)

    //—-

    table.cell(tb,0,0,’🦇 Bat’,text_color=color.white,text_halign=text.align_left)
    table.cell(tb,0,1,’📏 Gartley’,text_color=color.white,text_halign=text.align_left)
    table.cell(tb,0,2,’🦋 Butterfly’,text_color=color.white,text_halign=text.align_left)
    table.cell(tb,0,3,’🦀 Crab’,text_color=color.white,text_halign=text.align_left)

    //Bat
    if ab > 0.382 and ab < .5 and bc > 0.382 and bc < 0.886 and dist(0.886) > 1.618 and dist(0.886) < 2.618
    table.cell(tb,1,0,’✔️’)
    table.cell(tb,1,1,’❌’)
    table.cell(tb,1,2,’❌’)
    table.cell(tb,1,3,’❌’)

    d_y := a_y + 0.886*(x_y – a_y)
    cd = math.abs(d_y-c_y)/math.abs(c_y-b_y)

    line.new(c,c_y,d,d_y,xloc=xloc.bar_time,color=css,width=2)
    line.new(b,b_y,d,d_y,xloc=xloc.bar_time,color=css,style=line.style_dotted)

    label.new(d,d_y,’D’,xloc=xloc.bar_time,color=css,style=x_y > a_y ? label.style_label_down : label.style_label_up
    ,textcolor=color.white,size=size.small)
    label.new(int(math.avg(d,b)),math.avg(d_y,b_y),str.tostring(cd,’#.###’),xloc=xloc.bar_time,color=css,style=label.style_label_center
    ,textcolor=color.white,size=size.small,tooltip=CD_tooltip)

    //Gartley
    else if ab > 0.618-precision and ab < 0.618+precision and bc > 0.382 and bc < 0.886 and dist(0.786) > 1.13 and dist(0.786) < 1.618
    table.cell(tb,1,0,’❌’)
    table.cell(tb,1,1,’✔️’)
    table.cell(tb,1,2,’❌’)
    table.cell(tb,1,3,’❌’)

    d_y := a_y + 0.786*(x_y – a_y)
    cd = math.abs(d_y-c_y)/math.abs(c_y-b_y)

    line.new(c,c_y,d,d_y,xloc=xloc.bar_time,color=css,width=2)
    line.new(b,b_y,d,d_y,xloc=xloc.bar_time,color=css,style=line.style_dotted)

    label.new(d,d_y,’D’,xloc=xloc.bar_time,color=css,style=x_y > a_y ? label.style_label_down : label.style_label_up
    ,textcolor=color.white,size=size.small)
    label.new(int(math.avg(d,b)),math.avg(d_y,b_y),str.tostring(cd,’#.###’),xloc=xloc.bar_time,color=css,style=label.style_label_center
    ,textcolor=color.white,size=size.small,tooltip=CD_tooltip)

    //Butterfly
    else if ab > 0.786-precision and ab < 0.786+precision and bc > 0.382 and bc < 0.886 and dist(1.27) > 1.618 and dist(1.27) < 2.24
    table.cell(tb,1,0,’❌’)
    table.cell(tb,1,1,’❌’)
    table.cell(tb,1,2,’✔️’)
    table.cell(tb,1,3,’❌’)

    d_y := a_y + 1.27*(x_y – a_y)
    cd = math.abs(d_y-c_y)/math.abs(c_y-b_y)

    line.new(c,c_y,d,d_y,xloc=xloc.bar_time,color=css,width=2)
    line.new(b,b_y,d,d_y,xloc=xloc.bar_time,color=css,style=line.style_dotted)

    label.new(d,d_y,’D’,xloc=xloc.bar_time,color=css,style=x_y > a_y ? label.style_label_down : label.style_label_up
    ,textcolor=color.white,size=size.small)
    label.new(int(math.avg(d,b)),math.avg(d_y,b_y),str.tostring(cd,’#.###’),xloc=xloc.bar_time,color=css,style=label.style_label_center
    ,textcolor=color.white,size=size.small,tooltip=CD_tooltip)

    //Crab
    else if ab > 0.382 and ab < .618 and bc > 0.382 and bc < 0.886 and dist(1.618) > 2.224 and dist(1.618) < 3.618
    table.cell(tb,1,0,’❌’)
    table.cell(tb,1,1,’❌’)
    table.cell(tb,1,2,’❌’)
    table.cell(tb,1,3,’✔️’)

    d_y := a_y + 1.618*(x_y – a_y)
    cd = math.abs(d_y-c_y)/math.abs(c_y-b_y)

    line.new(c,c_y,d,d_y,xloc=xloc.bar_time,color=css,width=2)
    line.new(b,b_y,d,d_y,xloc=xloc.bar_time,color=css,style=line.style_dotted)

    label.new(d,d_y,’D’,xloc=xloc.bar_time,color=css,style=x_y > a_y ? label.style_label_down : label.style_label_up
    ,textcolor=color.white,size=size.small)
    label.new(int(math.avg(d,b)),math.avg(d_y,b_y),str.tostring(cd,’#.###’),xloc=xloc.bar_time,color=css,style=label.style_label_center
    ,textcolor=color.white,size=size.small,tooltip=CD_tooltip)
    else
    table.cell(tb,1,0,’❌’)
    table.cell(tb,1,1,’❌’)
    table.cell(tb,1,2,’❌’)
    table.cell(tb,1,3,’❌’)

    d_y := a_y + 0.886*(x_y – a_y)
    cd = math.abs(d_y-c_y)/math.abs(c_y-b_y)

    line.new(c,c_y,d,d_y,xloc=xloc.bar_time,color=css,width=2)
    line.new(b,b_y,d,d_y,xloc=xloc.bar_time,color=css,style=line.style_dotted)

    label.new(d,d_y,’D’,xloc=xloc.bar_time,color=css,style=x_y > a_y ? label.style_label_down : label.style_label_up
    ,textcolor=color.white,size=size.small)
    label.new(int(math.avg(d,b)),math.avg(d_y,b_y),str.tostring(cd,’#.###’),xloc=xloc.bar_time,color=css,style=label.style_label_center
    ,textcolor=color.white,size=size.small,tooltip=CD_tooltip)

    upper_prz := d_y + 0.382*math.abs(d_y – x_y)
    lower_prz := d_y – 0.382*math.abs(d_y – x_y)
    box.new(x,upper_prz,d,lower_prz,border_color=na,xloc=xloc.bar_time,bgcolor=color.new(css,80),extend=extend.both)

    line.new(x,x_y,d,d_y,xloc=xloc.bar_time,color=css,style=line.style_dotted)

    //Alerts
    alertcondition(ta.crossover(close,lower_prz) or ta.crossunder(close,upper_prz),’Price Enter PRZ’,’Price entered the PRZ’)
    alertcondition(ta.cross(close,d_y),’Price Cross D’,’Price crossed point D’)

    //PRZ Plots
    plot(upper_prz,’Upper PRZ’,na)
    plot(lower_prz,’Lower PRZ’,na)

    #239061 quote
    Iván GonzálezIván González
    Moderator
    Legend

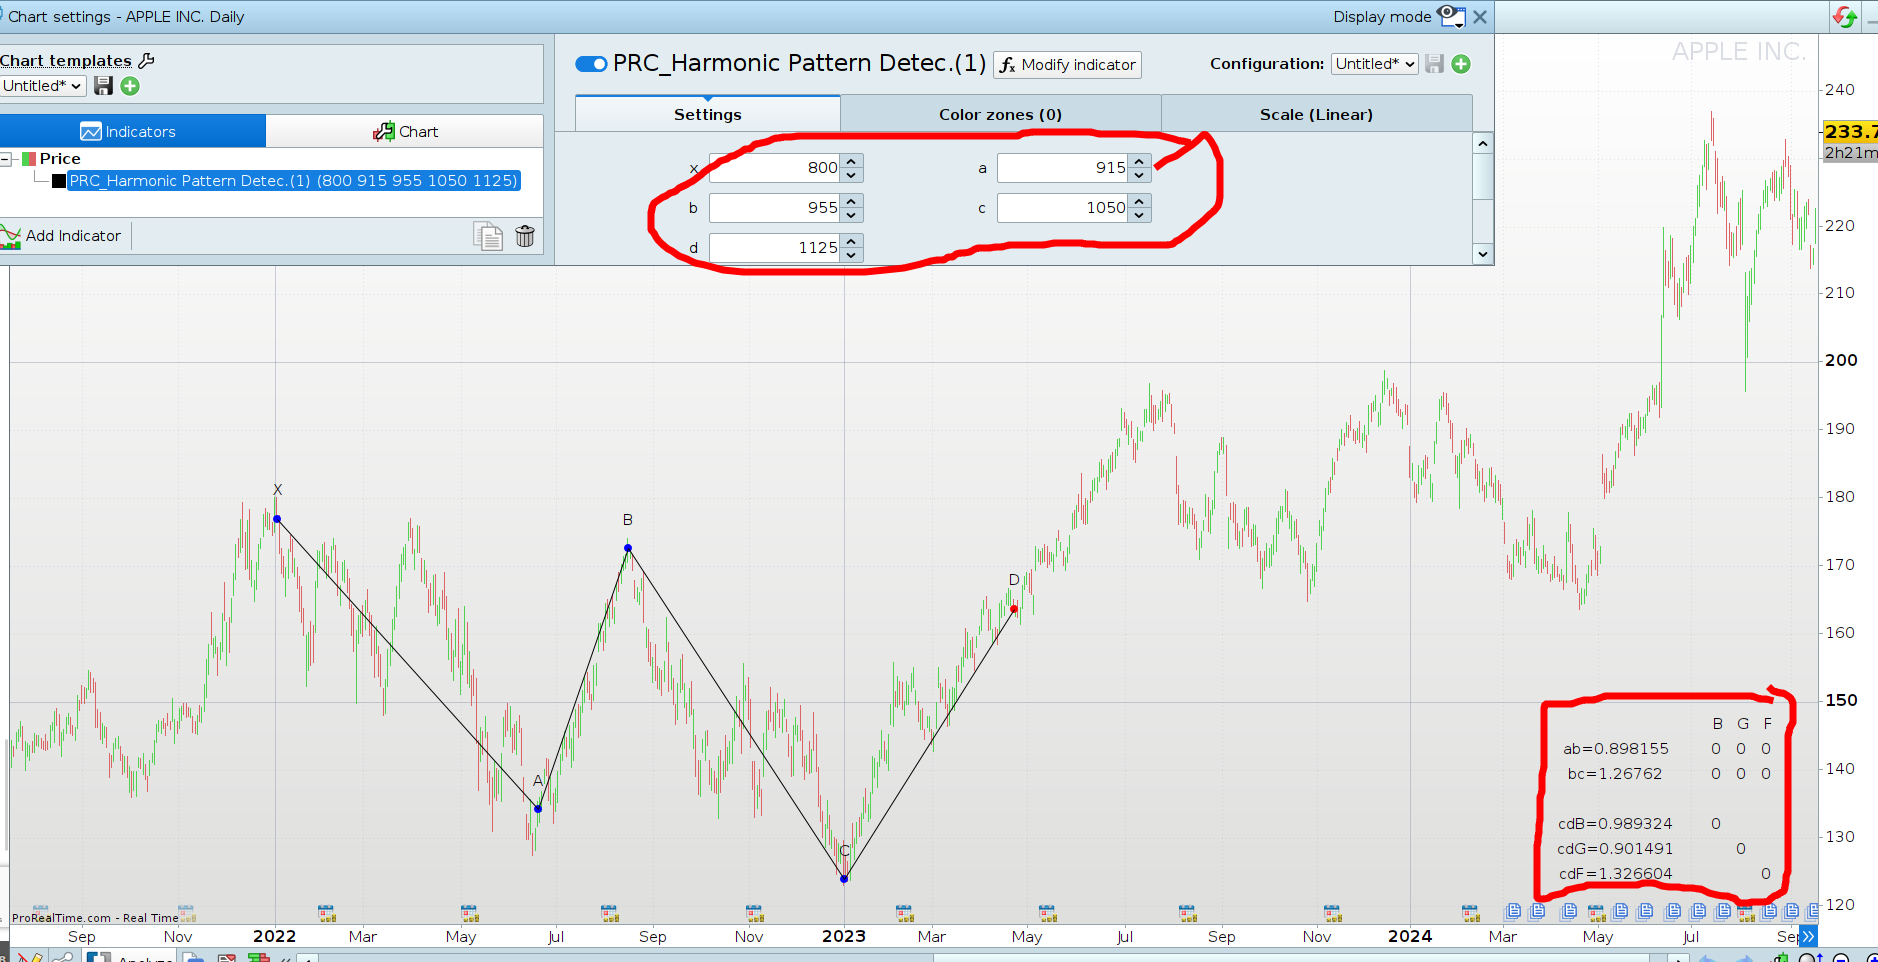
    Hello. This is what I can offer you… in PRT we cannot select points x,a,b,c,d so we have to do it through configuration.

    //-----------------------------------------//
    defparam drawonlastbaronly=true
    //-----------------------------------------//
    //-----Inputs------------------------------//
    //-----------------------------------------//
    x=250
    a=300
    b=400
    c=500
    d=700
    //-----------------------------------------//
    if barindex=x then
    yx=close
    elsif barindex=a then
    ya=close
    elsif barindex=b then
    yb=close
    elsif barindex=c then
    yc=close
    elsif barindex=d then
    yd=close
    endif
    //-----------------------------------------//
    ab=abs(yb-ya)/abs(ya-yx)
    bc=abs(yc-yb)/abs(yb-ya)
    //-----------------------------------------//
    precision=0.01
    //-----------------------------------------//
    //Bat Pattern
    //-----------------------------------------//
    yd1=ya+0.886*(yx-ya)
    cd1=abs(yd1-yc)/abs(yc-yb)
    BatPatab=ab>0.382 and ab<0.5
    BatPatbc=bc>0.382 and bc<0.886
    BatPatcd=cd1>1.618 and cd1<2.618
    if ab>0.382 and ab<0.5 and bc>0.382 and bc<0.886 and cd1>1.618 and cd1<2.618 then
    drawpoint(d,yd1,2)coloured("orange")
    drawsegment(c,yd1,barindex,yd1)style(line,2)
    endif
    //-----------------------------------------//
    //Gartley
    //-----------------------------------------//
    yd2=ya+0.786*(yx-ya)
    cd2=abs(yd2-yc)/abs(yc-yb)
    GarPatab=ab>0.618-precision and ab<0.618+precision
    GarPatbc=bc>0.382 and bc<0.886
    GarPatcd=cd2>1.13 and cd2<1.618
    if ab>0.618-precision and ab<0.618+precision and bc>0.382 and bc<0.886 and cd2>1.13 and cd2<1.618 then
    drawpoint(d,yd2,2)coloured("orange")
    drawsegment(c,yd2,barindex,yd2)style(line,2)
    endif
    //-----------------------------------------//
    //Butterfly
    //-----------------------------------------//
    yd3=ya+1.27*(yx-ya)
    cd3=abs(yd3-yc)/abs(yc-yb)
    ButPatab=ab>0.786-precision and ab<0.786+precision
    ButPatbc=bc>0.382 and bc<0.886
    ButPatcd=cd3>1.618 and cd3<2.24
    if ab>0.786-precision and ab<0.786+precision and bc>0.382 and bc<0.886 and cd3>1.618 and cd3<2.24 then
    drawpoint(d,yd3,2)coloured("orange")
    drawsegment(c,yd3,barindex,yd3)style(line,2)
    endif
    //-----------------------------------------//
    //Draw Points
    //-----------------------------------------//
    atr=averagetruerange[14](close)
    drawpoint(x,yx,2)coloured("blue")
    drawtext("X",x,yx+atr)
    drawpoint(a,ya,2)coloured("blue")
    drawtext("A",a,ya+atr)
    drawsegment(x,yx,a,ya)
    drawpoint(b,yb,2)coloured("blue")
    drawtext("B",b,yb+atr)
    drawsegment(b,yb,a,ya)
    drawpoint(c,yc,2)coloured("blue")
    drawtext("C",c,yc+atr)
    drawpoint(d,yd,2)coloured("red")
    drawtext("D",d,yd+atr)
    drawsegment(b,yb,c,yc)
    drawsegment(c,yc,d,yd)
    //-----------------------------------------//
    //Draw Table
    //-----------------------------------------//
    drawtext("B",-100,200)anchor(bottomright,xshift,yshift)
    drawtext("G",-75,200)anchor(bottomright,xshift,yshift)
    drawtext("F",-50,200)anchor(bottomright,xshift,yshift)
    
    drawtext("ab=#ab#",-200,175)anchor(bottomright,xshift,yshift)
    drawtext("bc=#bc#",-200,150)anchor(bottomright,xshift,yshift)
    
    drawtext("cdB=#cd1#",-200,100)anchor(bottomright,xshift,yshift)
    drawtext("cdG=#cd2#",-200,75)anchor(bottomright,xshift,yshift)
    drawtext("cdF=#cd3#",-200,50)anchor(bottomright,xshift,yshift)
    
    drawtext("#BatPatab#",-100,175)anchor(bottomright,xshift,yshift)
    drawtext("#BatPatbc#",-100,150)anchor(bottomright,xshift,yshift)
    drawtext("#BatPatcd#",-100,100)anchor(bottomright,xshift,yshift)
    
    drawtext("#GarPatab#",-75,175)anchor(bottomright,xshift,yshift)
    drawtext("#GarPatbc#",-75,150)anchor(bottomright,xshift,yshift)
    drawtext("#GarPatcd#",-75,75)anchor(bottomright,xshift,yshift)
    
    drawtext("#ButPatab#",-50,175)anchor(bottomright,xshift,yshift)
    drawtext("#ButPatbc#",-50,150)anchor(bottomright,xshift,yshift)
    drawtext("#ButPatcd#",-50,50)anchor(bottomright,xshift,yshift)
    //-----------------------------------------//
    return
    
    2024-10-16_13-09.png 2024-10-16_13-09.png
    #239066 quote
    yasyas
    Participant
    Junior

    Thanks mate much appreciated

Viewing 5 posts - 1 through 5 (of 5 total)
  • You must be logged in to reply to this topic.
ProRealAI ProRealAI New

Stuck on this ProBuilder code?

Describe what this topic is trying to build, in plain English, and ProRealAI writes the ProRealTime™ indicator, screener or system for you.

Available in 7 languages
Try ProRealAI

Please Convert Harmonic Pattern to Proealtime


ProBuilder: Indicators & Custom Tools

New Reply
Author
author-avatar
yas @yas Participant
Summary

This topic contains 4 replies,
has 2 voices, and was last updated by yasyas
1 year, 11 months ago.

Topic Details
Forum: ProBuilder: Indicators & Custom Tools
Language: English
Started: 10/10/2024
Status: Active
Attachments: 1 files
ProRealCode ProRealCode
Loading...