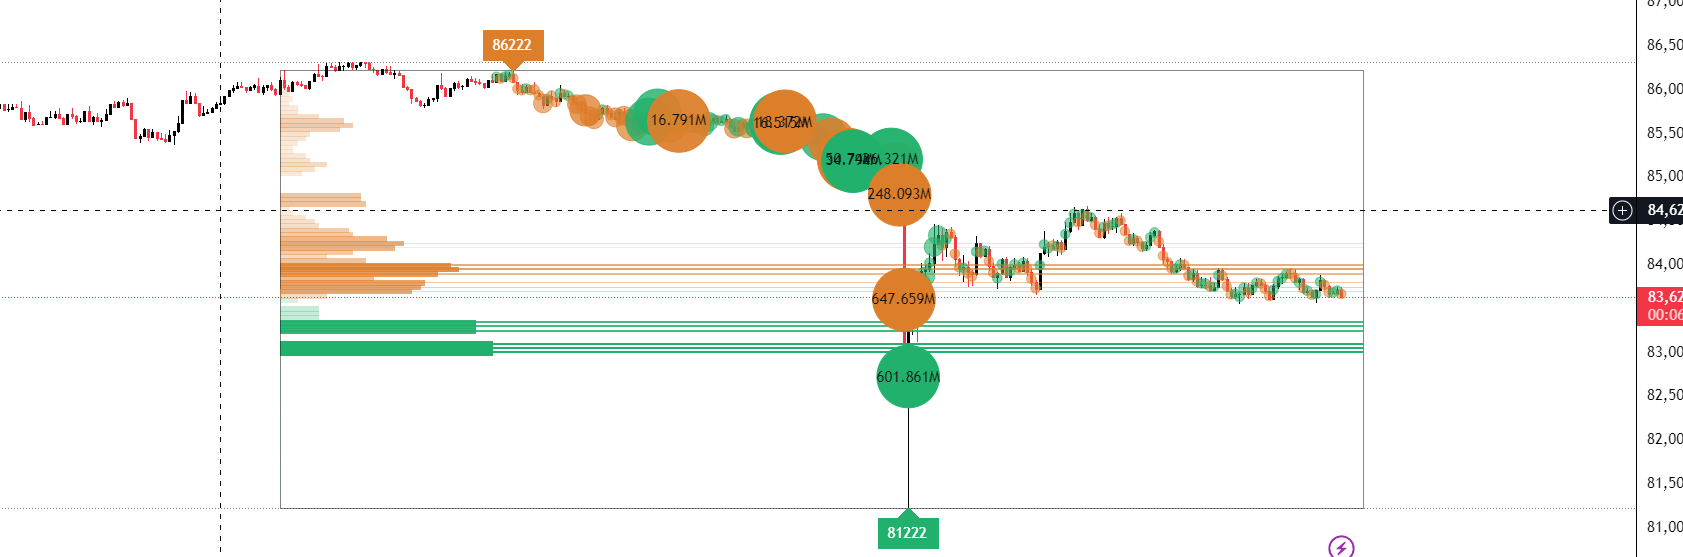
onversion of indicator Liquidity spectrum Visualizer from the TV software

Viewing 2 posts - 1 through 2 (of 2 total)
  • Author
    Posts
  • #253849 quote
    yysyys
    Participant
    New


    indicator(“Liquidity Spectrum Visualizer [BigBeluga]”, overlay = true, max_boxes_count = 500, max_labels_count = 500)


    // INPUTS ――――――――――――――――――――――――――――――――――――――――――――――――――――――――――――――――――――――――――――――――――――――――――――――――――――――――{


    lookback = input.int(200, “LookBack”)


    vol_bubles = input.bool(true, “Display Volume Bubles”)


    volume_pr = input.bool(true, “Volume Profile”)


    liq_levels = input.bool(true, “Liquidity Levels”)


    col_up = input.color(#22b16c, “”, inline = “colors”)


    col_dn = input.color(#dd7e2a, “”, inline = “colors”)


    // }


    // CALCULATIONS――――――――――――――――――――――――――――――――――――――――――――――――――――――――――――――――――――――――――――――――――――――――――――――{


    allow = last_bar_index – bar_index < lookback


    display = allow ? display.all : display.none


    n_vol = volume / ta.stdev(volume, 200)


    size = n_vol >= 1 and n_vol < 2 ? size.small : n_vol >= 2 and n_vol < 3 ? size.normal : n_vol >= 3 and n_vol < 4 ? size.large : n_vol >= 4 ? size.huge : size.tiny


    cond0 = n_vol < 1


    cond1 = n_vol >= 1 and n_vol < 2


    cond2=n_vol>=2andn_vol<3


    cond3 = n_vol >= 3 and n_vol < 4


    cond4 = n_vol >= 4


    offset = -lookback-(volume_pr ? 50 : 0)


    if barstate.islast


      h_l = array.new<float>()


      for j = 0 to lookback – 1


        h_l.push(high[j])


        h_l.push(low[j])


      bins = array.new<float>(100)


      step = (h_l.max()-h_l.min()) / 100


      var boxes_bins = array.new<box>()


      var poc_lvls = array.new<line>()


      for b in boxes_bins


        b.delete()


      for l in poc_lvls


        l.delete()


      boxes_bins.clear()


      poc_lvls.clear()


      for i = 0 to 100-1


        bins.set(i, 0)


      for i = 0 to bins.size()-1


        lower=h_l.min()+step*i


        upper=lower+step


        for j = 0 to lookback – 1


          if high[j] == h_l.max()


            label.new(bar_index-j, high[j], style = label.style_label_down, text = str.tostring(high[j]), color = col_dn)


          if low[j] == h_l.min()


            label.new(bar_index-j, low[j], style = label.style_label_up, text = str.tostring(low[j]), color = col_up)


          c = close[j]


          if c >= lower-step and c <= upper+step


            bins.set(i, bins.get(i) + volume[j])


      for i = 0 to bins.size()-1


        lower=h_l.min()+step*i


        upper=lower+step


        val = int(bins.get(i)/bins.max() * 50)


        col_res_sup = close > math.avg(upper, lower) ? col_up : col_dn


        if volume_pr


          vp_col = color.from_gradient(val, 0, 50, color.new(col_res_sup, 90), col_res_sup)


          boxes_bins.push(box.new(bar_index+offset, upper, bar_index+val+offset, lower, bgcolor = vp_col, border_color = color(na)))


        if val > 25 and liq_levels


          color_pocs = color.from_gradient(val, 25, 50, color.new(col_res_sup, 90), col_res_sup)


          width = val < 35 ? 1 : val > 35 ? 2 : val > 45 ? 3 : 1


          poc_lvls.push(line.new(bar_index+offset, math.avg(upper, lower), bar_index+5, math.avg(upper, lower), color = color_pocs, width = width))


      box.delete(box.new(bar_index+offset, h_l.max(), bar_index+5, h_l.min(), color.new(chart.fg_color, 50), 1, bgcolor = na)[1])


    // }


    // PLOT ――――――――――――――――――――――――――――――――――――――――――――――――――――――――――――――――――――――――――――――――――――――――――――――――――――――――――――{


    colorr = close > open ? col_up: col_dn


    gradient_col = color.from_gradient(n_vol , 0, 5, color.new(colorr, 50), colorr)


    display_vol = vol_bubles ? display.all : display.none


    plotshape(allow and cond0 ? hlc3 : na, “”, shape.circle, location.absolute, gradient_col, 0, “”, na, size = size.tiny, show_last = lookback, force_overlay = true, editable = false, display = display_vol)


    plotshape(allow and cond1 ? hlc3 : na, “”, shape.circle, location.absolute, gradient_col, 0, “”, na, size = size.small, show_last = lookback, force_overlay = true, editable = false, display = display_vol)


    plotshape(allow and cond2 ? hlc3 : na, “”, shape.circle, location.absolute, gradient_col, 0, “”, na, size = size.normal, show_last = lookback, force_overlay = true, editable = false, display = display_vol)


    plotshape(allow and cond3 ? hlc3 : na, “”, shape.circle, location.absolute, gradient_col, 0, “”, na, size = size.large, show_last = lookback, force_overlay = true, editable = false, display = display_vol)


    plotshape(allow and cond4 ? hlc3 : na, “”, shape.circle, location.absolute, gradient_col, 0, “”, na, size = size.huge, show_last = lookback, force_overlay = true, editable = false, display = display_vol)


    // Plot labels for significant volume levels


    if cond4 and allow and vol_bubles


      label.new(bar_index , hlc3, str.tostring(volume, format.volume), xloc.bar_index, yloc.price ,


             #00000000, label.style_label_center, chart.fg_color, force_overlay = true)


    // }

    屏幕截图-2025-11-21-171703.png 屏幕截图-2025-11-21-171703.png
    #253926 quote
    Iván GonzálezIván González
    Moderator
    Legend
    Hi! here it is:
    // --------------------------------------------
    // PRC_Liquidity Spectrum Visualizer
    // version = 0
    // 24.11.2025
    // Iván González @ www.prorealcode.com
    // Sharing ProRealTime knowledge
    // --------------------------------------------
    // Definable parameters (Initial configuration)
    // --------------------------------------------
    lookback = 200 // Analysis period
    showBubbles = 1 // 1 = Yes, 0 = No
    showVP = 1 // 1 = Yes, 0 = No (Volume Profile)
    showLiqLevels = 1 // 1 = Yes, 0 = No (Liquidity levels)
    // --------------------------------------------
    // Color Configuration (RGB)
    // --------------------------------------------
    // Bullish Color (Pine Green type)
    rUp = 34
    gUp = 177
    bUp = 76
    // Bearish Color (Pine Orange type)
    rDn = 221
    gDn = 126
    bDn = 42
    // -------------------------------------------------------------
    // 1. VOLUME BUBBLES CALCULATION
    // -------------------------------------------------------------
    
    // Calculate volume standard deviation
    volStdev = STD[200](Volume)
    
    // Normalize volume (Simplified Z-Score)
    // Avoid division by zero
    nVol = 0
    IF volStdev > 0 THEN
       nVol = Volume / volStdev
    ENDIF
    
    // Determine point size based on volume magnitude
    ipointSize = 0
    
    IF nVol >= 1 AND nVol < 2 THEN
       ipointSize = 1
    ELSIF nVol >= 2 AND nVol < 3 THEN
       ipointSize = 2
    ELSIF nVol >= 3 AND nVol < 4 THEN
       ipointSize = 3
    ELSIF nVol >= 4 THEN
       ipointSize = 4
    ENDIF
    
    // Determine bubble color
    rDraw = rDn
    gDraw = gDn
    bDraw = bDn
    
    IF Close > Open THEN
       rDraw = rUp
       gDraw = gUp
       bDraw = bUp
    ENDIF
    
    // Calculate opacity based on size (larger = more opaque)
    alpha = 50 + (ipointSize * 40)
    if alpha > 255 THEN
       alpha = 255
    ENDIF
    
    // Use typical price (HLC3) for location
    myPrice = (High + Low + Close) / 3
    
    // Draw bubbles
    IF islastbarupdate and showBubbles THEN
       for i=0 to lookback-1 do
          // Determine point size based on volume magnitude using historical data
          IF nVol[i] >= 1 AND nVol[i] < 2 THEN
             DRAWPOINT(barindex[i], myPrice[i],2) COLOURED(rDraw[i], gDraw[i], bDraw[i], alpha[i])
          ELSIF nVol[i] >= 2 AND nVol[i] < 3 THEN
             DRAWPOINT(barindex[i], myPrice[i],3) COLOURED(rDraw[i], gDraw[i], bDraw[i], alpha[i])
          ELSIF nVol[i] >= 3 AND nVol[i] < 4 THEN
             DRAWPOINT(barindex[i], myPrice[i],4) COLOURED(rDraw[i], gDraw[i], bDraw[i], alpha[i])
          ELSIF nVol[i] >= 4 THEN
             DRAWPOINT(barindex[i], myPrice[i],5) COLOURED(rDraw[i], gDraw[i], bDraw[i], alpha[i])
          ENDIF
          
          // If volume is extreme (>=4), place text label
          IF nVol[i] >= 4 THEN
             myvol=volume[i]
             DRAWTEXT("#myvol#", barindex[i], myPrice[i]) ANCHOR(TOP,INDEX,VALUE) COLOURED(rDraw[i], gDraw[i], bDraw[i], 255)
          ENDIF
       next
    endif
    
    // -------------------------------------------------------------
    // 2. VOLUME PROFILE AND LIQUIDITY LEVELS
    // -------------------------------------------------------------
    
    IF showVP AND IsLastBarUpdate THEN
       
       // Find maximum and minimum of the lookback range
       highestPrice = Highest[lookback](High)
       lowestPrice = Lowest[lookback](Low)
       
       // Define size of each 'box' or bin (100 levels)
       priceRange = highestPrice - lowestPrice
       stepSize = priceRange / 100
       
       // Clear volume bins array
       UNSET($volBins)
       
       // LOOP 1: Fill bins with volume
       // Loop through the last 'lookback' candles backwards
       FOR j = 0 TO lookback - 1 DO
          // Get close price and volume of that historical candle
          histClose = Close[j]
          histVol = Volume[j]
          
          // Calculate which array index corresponds to this price
          // Index 0 is the lowest price, 99 the highest
          binIndex = FLOOR((histClose - lowestPrice) / stepSize)
          
          // Protect array limits (0 to 99)
          IF binIndex < 0 THEN
             binIndex = 0
          ELSIF binIndex > 99 THEN
             binIndex = 99
          ENDIF
          
          // Accumulate volume at that price level
          if IsSet($volBins[binIndex]) THEN
             $volBins[binIndex] = $volBins[binIndex] + histVol
          ELSE
             $volBins[binIndex] = histVol
          ENDIF
       NEXT
       
       // Find maximum volume to scale the drawing (normalization)
       maxBinVol = ArrayMax($volBins)
       
       // Visual offset (places the VP start at the beginning of the lookback)
       offset = -lookback
       
       // LOOP 2: Draw profile
       FOR i = 0 TO 99 DO
          // Define Y coordinates (Prices)
          yBottom = lowestPrice + (stepSize * i)
          yTop = yBottom + stepSize
          yMid = (yTop + yBottom) / 2
          
          // Get level volume
          currentBinVol = 0
          IF IsSet($volBins[i]) THEN
             currentBinVol = $volBins[i]
          ENDIF
          
          // Calculate bar length (max 50 candles width)
          barLength = 0
          IF maxBinVol > 0 THEN
             barLength = ROUND((currentBinVol / maxBinVol) * 50)
          ENDIF
          
          IF barLength > 0 THEN
             // Determine level color (if current price is above or below this level)
             rLvl = rDn
             gLvl = gDn
             bLvl = bDn
             
             IF Close > yMid THEN
                rLvl = rUp
                gLvl = gUp
                bLvl = bUp
             ENDIF
             
             // Simulated gradient with transparency
             // More volume = more opaque
             alphaLvl = ROUND((currentBinVol / maxBinVol) * 150) + 20
             
             // RECTANGLE DRAWING (Volume Profile)
             // Draw from the past anchor point to the right
             DRAWRECTANGLE(barindex + offset, yTop, barindex + offset + barLength, yBottom) COLOURED(rLvl, gLvl, bLvl, alphaLvl) BORDERCOLOR(0,0,0,0)
             
             // LIQUIDITY LEVELS DRAWING (Poc Extensions)
             // If volume is significant (>25% of max), extend a line
             IF showLiqLevels AND (currentBinVol / maxBinVol) > 0.25 THEN
                
                if (currentBinVol / maxBinVol) > 0.75 THEN
                   // Small horizontal line marking the liquidity level (High significance)
                   DRAWSEGMENT(barindex + offset, yMid, barindex , yMid) STYLE(LINE, 3) COLOURED(rLvl, gLvl, bLvl, 155)
                elsif (currentBinVol / maxBinVol) > 0.50 THEN
                   // Medium significance
                   DRAWSEGMENT(barindex + offset, yMid, barindex , yMid) STYLE(LINE, 2) COLOURED(rLvl, gLvl, bLvl, 70)
                elsif (currentBinVol / maxBinVol) > 0.40 THEN
                   // Low significance
                   DRAWSEGMENT(barindex + offset, yMid, barindex , yMid) STYLE(LINE, 2) COLOURED(rLvl, gLvl, bLvl, 55)
                else
                   // Minimal significance (Dotted)
                   DRAWSEGMENT(barindex + offset, yMid, barindex , yMid) STYLE(LINE, 1) COLOURED(rLvl, gLvl, bLvl, 35)style(dottedline)
                endif
             ENDIF
          ENDIF
       NEXT
       
       // Range Maximum and Minimum labels
       DRAWTEXT("High Range: #highestPrice#", barindex + offset, highestPrice) ANCHOR(BOTTOM,INDEX,VALUE) COLOURED(rDn, gDn, bDn, 200)
       DRAWTEXT("Low Range: #lowestPrice#", barindex + offset, lowestPrice) ANCHOR(TOP,INDEX,VALUE) COLOURED(rUp, gUp, bUp, 200)
       
       // Draw analysis box background
       drawrectangle(barindex+offset,highestPrice,barindex,lowestPrice)coloured("grey",50)
    ENDIF
    
    RETURN
    
Viewing 2 posts - 1 through 2 (of 2 total)
  • You must be logged in to reply to this topic.
ProRealAI ProRealAI New

Stuck on this ProBuilder code?

Describe what this topic is trying to build, in plain English, and ProRealAI writes the ProRealTime™ indicator, screener or system for you.

Available in 7 languages
Try ProRealAI

TradingView to ProRealTime Translation Center

New Reply
Author
author-avatar
yys @yys Participant
Summary

This topic contains 1 reply,
has 2 voices, and was last updated by Iván GonzálezIván González
10 months ago.

Topic Details
Forum: TradingView to ProRealTime Translation Center Forum
Started: 11/21/2025
Status: Active
Attachments: 1 files
ProRealCode ProRealCode
Loading...