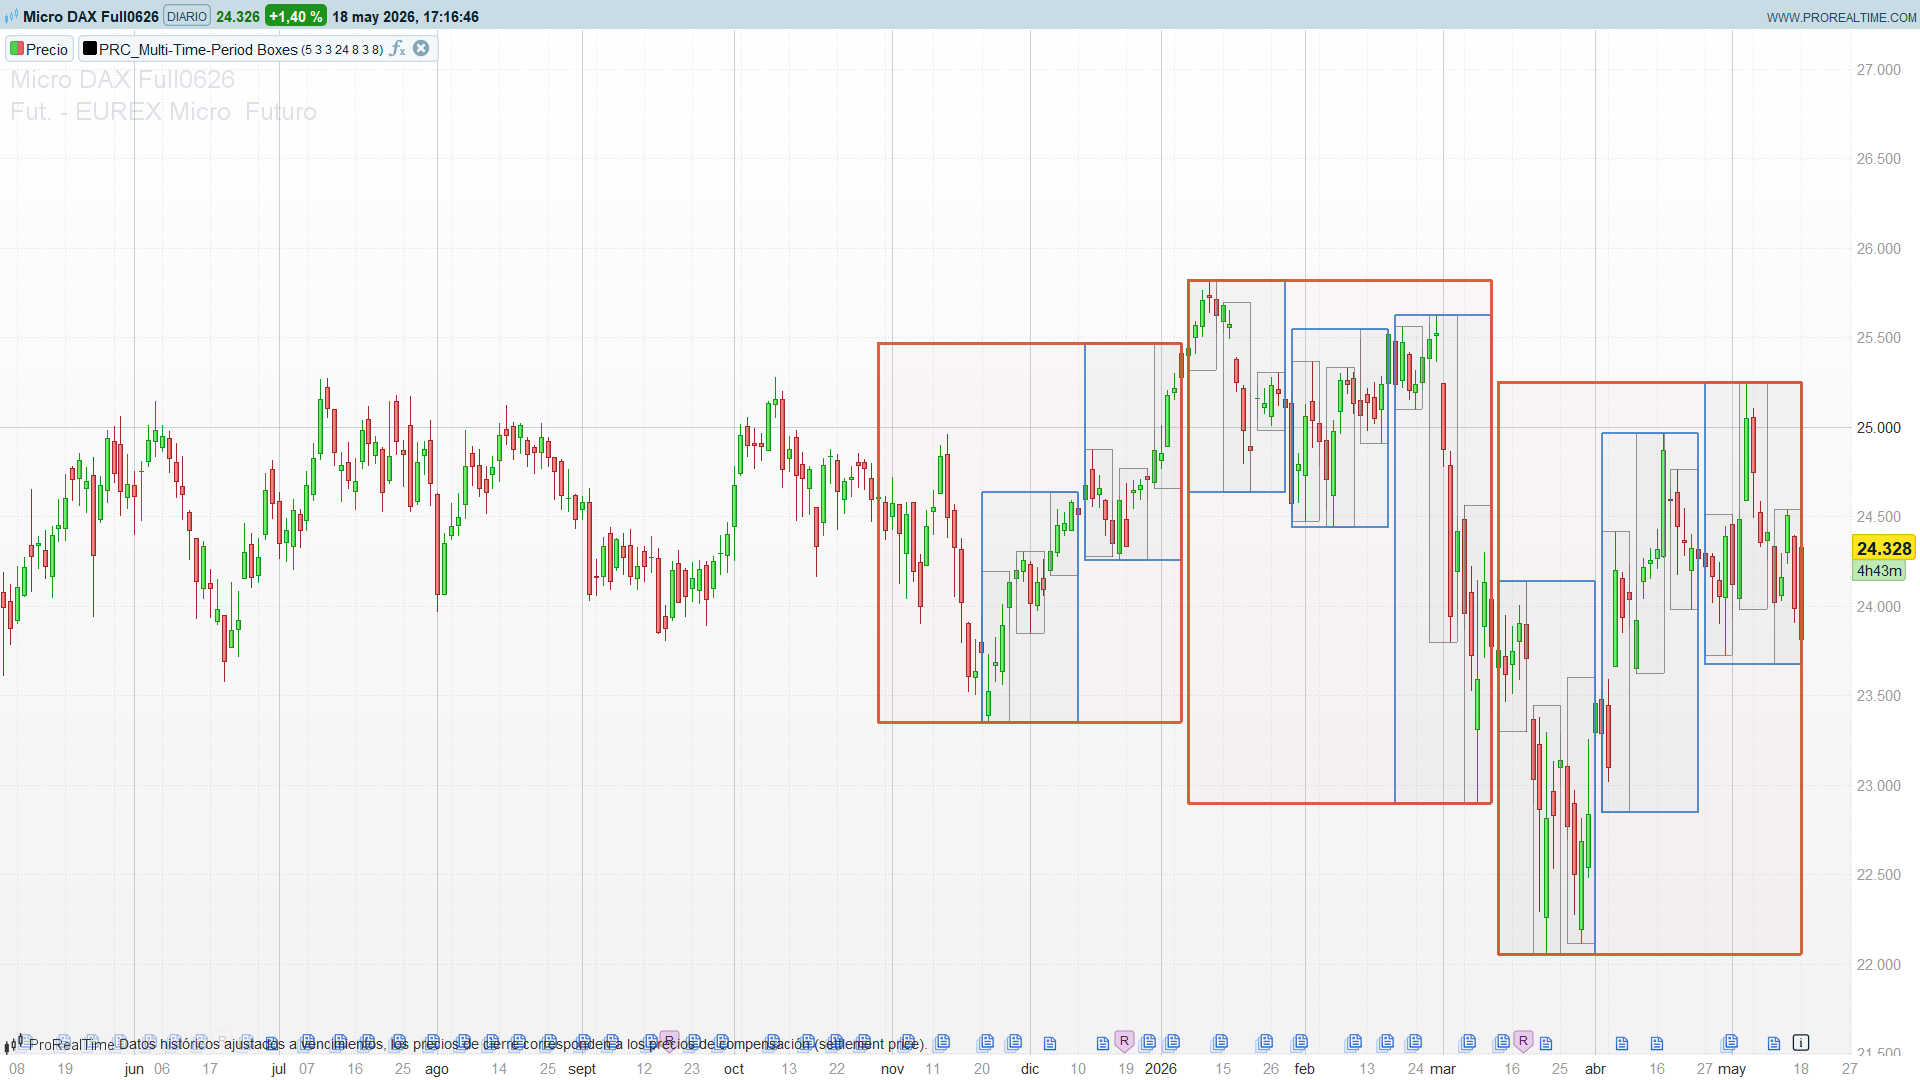
The Multi-Time-Period Boxes indicator draws a rectangle around every group of N candles. Each box spans the highest high and the lowest low of its group, so a box is nothing more than the High/Low range of a timeframe N times higher than the chart’s, painted directly on top of the candles you are already looking at. With up to three nested levels, you get the “timeframe within a timeframe” view: small boxes inside medium boxes inside large boxes.
It is the ProRealTime equivalent of the NinjaTrader Box Chart style and of the TradingView Multi-Time Period Charts tool, requested by a ProRealTime user through the community.
Key Features at a Glance
| Feature | Behaviour |
|---|---|
| Box content | Highest high / lowest low of a group of `baseLen` candles |
| Nesting | Up to 3 geometrically scaled, perfectly aligned levels |
| Candle visibility | Fill kept near-transparent so candles stay readable |
| Level colours | Independent RGB per level |
| Level count | 1, 2 or 3 via a single parameter |
| Performance | Drawn once on the last bar |
Indicator Configuration
| Parameter | Default | Description |
|---|---|---|
| `baseLen` | 5 | Candles per box on the innermost level |
| `nestFactor` | 3 | How many lower-level boxes fit in the next level |
| `levels` | 3 | Number of nested levels (1, 2 or 3) |
| `boxes1` | 24 | Level-1 boxes drawn back |
| `boxes2` | 8 | Level-2 boxes drawn back |
| `boxes3` | 3 | Level-3 boxes drawn back |
| `fillAlpha` | 8 | Fill transparency 0..255 (low = candles visible) |
| `r1..b3` | — | RGB colour of each level |
Code
//--------------------------------------------------------//
//PRC_Multi-Time-Period Boxes
//version = 0
//18.05.26
//Iván González @ www.prorealcode.com
//Sharing ProRealTime knowledge
//--------------------------------------------------------//
defparam drawonlastbaronly = true
//-----Inputs---------------------------------------------//
baseLen    = 5    // candles per box on the innermost level
nestFactor = 3    // how many lower-level boxes fit in the next level
levels     = 3    // number of nested levels (1, 2 or 3)
boxes1     = 24   // number of level-1 boxes to draw back
boxes2     = 8    // number of level-2 boxes to draw back
boxes3     = 3    // number of level-3 boxes to draw back
fillAlpha  = 8    // fill transparency 0..255 (low = candles stay visible)
r1 = 130
g1 = 130
b1 = 130          // level-1 colour
r02 = 70
g2 = 130
b2 = 200          // level-2 colour
r3 = 210
g3 = 90
b3 = 50           // level-3 colour
//--------------------------------------------------------//
//-----Nested lengths-------------------------------------//
len1 = baseLen
len2 = baseLen * nestFactor
len3 = baseLen * nestFactor * nestFactor
//--------------------------------------------------------//
//-----Drawing (only on the last bar)---------------------//
IF ISLASTBARUPDATE THEN

   FOR i = 0 TO boxes1 - 1 DO
      eOff = i * len1
      sOff = eOff + len1 - 1
      hiB  = highest[len1](high)[eOff]
      loB  = lowest[len1](low)[eOff]
      DRAWRECTANGLE(barindex[sOff], hiB, barindex[eOff], loB) STYLE(line, 1) COLOURED(r1, g1, b1, 220) FILLCOLOR(r1, g1, b1, fillAlpha)
   NEXT

   IF levels >= 2 THEN
      FOR j = 0 TO boxes2 - 1 DO
         eOff2 = j * len2
         sOff2 = eOff2 + len2 - 1
         hiB2  = highest[len2](high)[eOff2]
         loB2  = lowest[len2](low)[eOff2]
         DRAWRECTANGLE(barindex[sOff2], hiB2, barindex[eOff2], loB2) STYLE(line, 2) COLOURED(r02, g2, b2, 230) FILLCOLOR(r02, g2, b2, fillAlpha)
      NEXT
   ENDIF

   IF levels >= 3 THEN
      FOR m = 0 TO boxes3 - 1 DO
         eOff3 = m * len3
         sOff3 = eOff3 + len3 - 1
         hiB3  = highest[len3](high)[eOff3]
         loB3  = lowest[len3](low)[eOff3]
         DRAWRECTANGLE(barindex[sOff3], hiB3, barindex[eOff3], loB3) STYLE(line, 3) COLOURED(r3, g3, b3, 240) FILLCOLOR(r3, g3, b3, fillAlpha)
      NEXT
   ENDIF

ENDIF
//--------------------------------------------------------//
RETURN