Bonsoir,
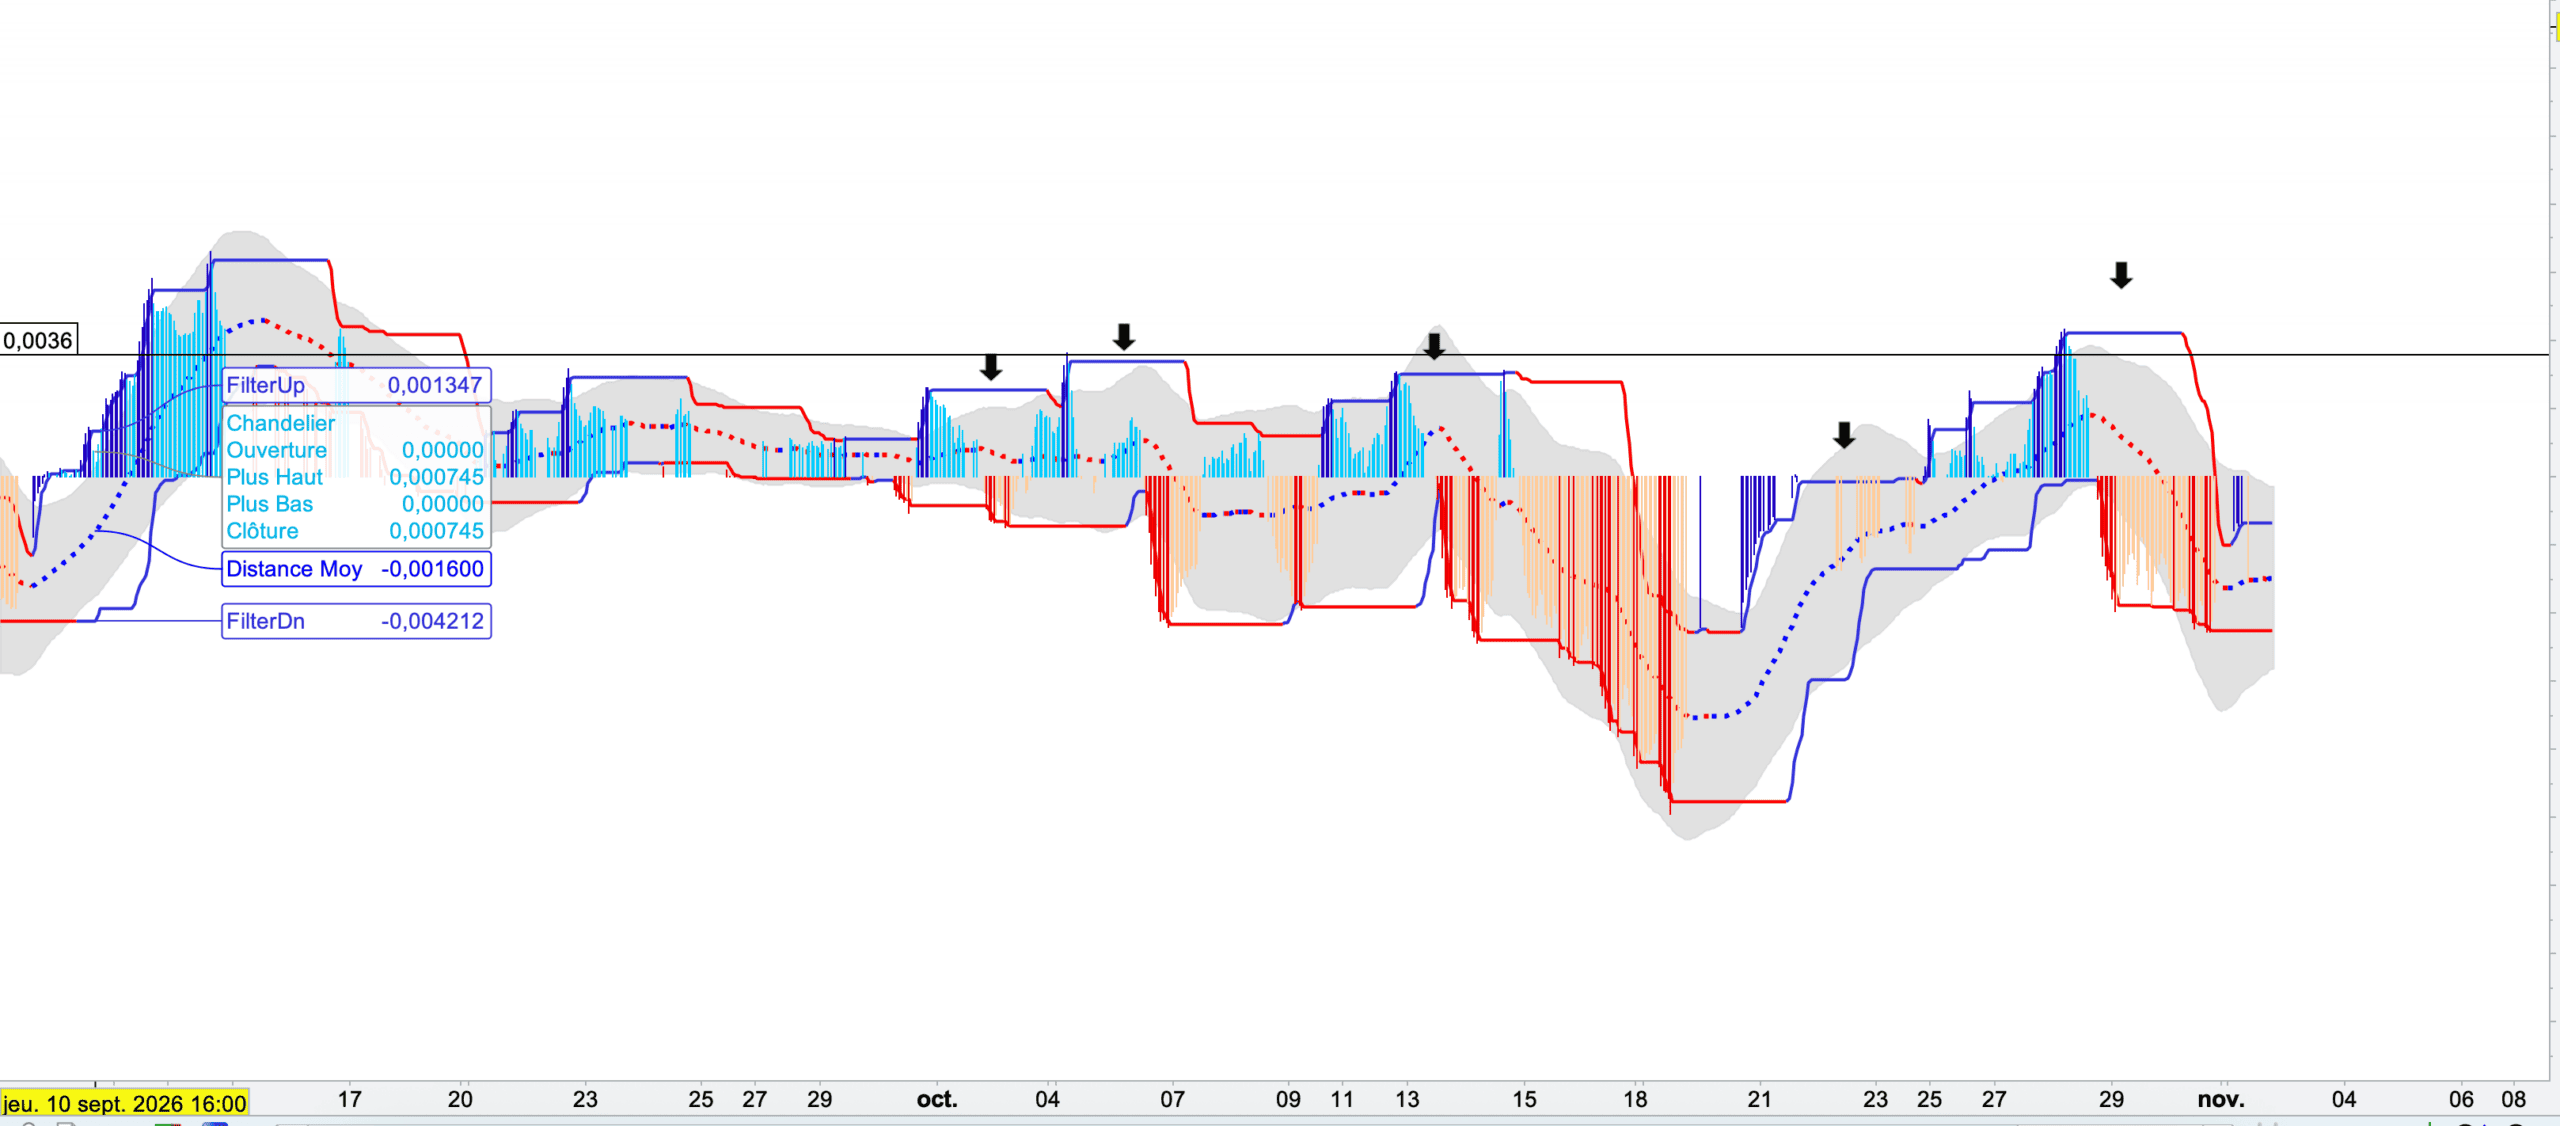
ci-dessous une copie de l’indicateur que certains animateurs de ce site m’ont développé.
/////////////////////////////////////KAMA 150
Period = 150
FastPeriod = 2
SlowPeriod = 50
Fastest = 2 / (FastPeriod + 1)
Slowest = 2 / (SlowPeriod + 1)
if barindex < Period+1 then
Kama=close
else
Num = abs(xclose-xclose[Period])
Den = summation[Period](abs(xclose-xclose[1]))
ER = Num / Den
Alpha = SQUARE(ER *(Fastest – Slowest )+ Slowest)
KAMA = (Alpha * Close) + ((1 -Alpha)* Kama[1])
endif
///////////////////////////////////////////////////////////////////: Distance Cours KAMA
xClose = (Open+High+Low+Close)/4
Distance = (xclose- kama)
moy = average[50]((distance))
if Moy<Moy[1] and Moy[1]>Moy[2] and Moy[1]>0 then
///RetB5=RetB4
///RetB4=RetB3
RetB3=RetB2
RetB2=RetB1
RetB1=Moy[1]
BandeHaute=(RetB1+RetB2+RetB3)/3
endif
if Moy>Moy[1] and Moy[1]<Moy[2] and Moy[1]<0 then
///RetH5=RetH4
///RetH4=RetH3
RetH3=RetH2
RetH2=RetH1
RetH1=Moy[1]
BandeBasse=(RetH1+RetH2+RetH3)/3
endif
for i=0 to 49
$montab[i]=distance[i]
Next
arraysort($montab,ascend)
moy3plusBas = ($montab[0] + $montab[1] + $montab[2]) / 3
moy3plusHauts = ($montab[49] + $montab[48] + $montab[47]) / 3
if (distance > moy3plushauts) then
drawcandle (0,0, distance, distance) COLOURED (32, 0, 192)
endif
if (distance < moy3plusbas) then
drawcandle (0,0, distance, distance) COLOURED (235,0,0)
endif
if (distance > moy) and (distance < moy3plushauts) and (distance > 0) then
drawcandle (0, 0, distance, distance) coloured (0, 204, 255)
endif
if (Distance < moy) and (distance > moy3plusbas) and (distance < 0) then
drawcandle (0, 0, distance, distance) coloured (255, 204, 153)
endif
moy3plus = average[50](moy3plushauts – moy3plusbas)
aplushauts = moy+(moy3plus/2)
aplusbas = moy-(moy3plus/2)
lookbackBars = 320 // Fenetre d’analyse (~2 mois en 1h)
minPeakDist = 15 // Distance min entre pics (barres)
// ================================================================
// NEW: Ligne des 3 pics les plus hauts de moy3plusHauts
// ================================================================
once peakCntH = 0
// Detecter pic local de moy3plusHauts
IF moy3plusHauts < moy3plusHauts[1] AND moy3plusHauts[1] >= moy3plusHauts[2] THEN
canStore = 1
// Si trop proche du dernier pic stocke, garder le plus haut
IF peakCntH > 0 THEN
lastBarH = $peakBarH[peakCntH – 1]
IF barindex – 1 – lastBarH < minPeakDist THEN
IF moy3plusHauts[1] > $peakValH[peakCntH – 1] THEN
$peakValH[peakCntH – 1] = moy3plusHauts[1]
$peakBarH[peakCntH – 1] = barindex – 1
ENDIF
canStore = 0
ENDIF
ENDIF
IF canStore THEN
$peakValH[peakCntH] = moy3plusHauts[1]
$peakBarH[peakCntH] = barindex – 1
peakCntH = peakCntH + 1
ENDIF
ENDIF
// Trouver les 3 plus hauts dans la fenetre
h1 = 0
h2 = 0
h3 = 0
IF peakCntH > 0 THEN
FOR i = 0 TO peakCntH – 1 DO
IF barindex – $peakBarH[i] <= lookbackBars THEN
IF $peakValH[i] > h1 THEN
h3 = h2
h2 = h1
h1 = $peakValH[i]
ELSIF $peakValH[i] > h2 THEN
h3 = h2
h2 = $peakValH[i]
ELSIF $peakValH[i] > h3 THEN
h3 = $peakValH[i]
ENDIF
ENDIF
NEXT
ENDIF
IF h3 > 0 THEN
lineHaut = (h1 + h2 + h3) / 3
ELSIF h2 > 0 THEN
lineHaut = (h1 + h2) / 2
ELSIF h1 > 0 THEN
lineHaut = h1
ENDIF
// ================================================================
// NEW: Ligne des 3 creux les plus bas de moy3plusBas
// ================================================================
once peakCntL = 0
// Detecter creux local de moy3plusBas
IF moy3plusBas > moy3plusBas[1] AND moy3plusBas[1] <= moy3plusBas[2] THEN
canStoreL = 1
// Si trop proche du dernier creux stocke, garder le plus bas
IF peakCntL > 0 THEN
lastBarL = $peakBarL[peakCntL – 1]
IF barindex – 1 – lastBarL < minPeakDist THEN
IF moy3plusBas[1] < $peakValL[peakCntL – 1] THEN
$peakValL[peakCntL – 1] = moy3plusBas[1]
$peakBarL[peakCntL – 1] = barindex – 1
ENDIF
canStoreL = 0
ENDIF
ENDIF
IF canStoreL THEN
$peakValL[peakCntL] = moy3plusBas[1]
$peakBarL[peakCntL] = barindex – 1
peakCntL = peakCntL + 1
ENDIF
ENDIF
// Trouver les 3 plus bas dans la fenetre
l1 = 0
l2 = 0
l3 = 0
IF peakCntL > 0 THEN
FOR i = 0 TO peakCntL – 1 DO
IF barindex – $peakBarL[i] <= lookbackBars THEN
IF $peakValL[i] < l1 THEN
l3 = l2
l2 = l1
l1 = $peakValL[i]
ELSIF $peakValL[i] < l2 THEN
l3 = l2
l2 = $peakValL[i]
ELSIF $peakValL[i] < l3 THEN
l3 = $peakValL[i]
ENDIF
ENDIF
NEXT
ENDIF
IF l3 < 0 THEN
lineBas = (l1 + l2 + l3) / 3
ELSIF l2 < 0 THEN
lineBas = (l1 + l2) / 2
ELSIF l1 < 0 THEN
lineBas = l1
ENDIF
// ================================================================
RETURN distance AS “Distance”, moy AS “Distance Moy”, BandeHaute AS “Bande Haute”, BandeBasse AS “Bande Basse”, moy3plusHauts AS “FilterUp”, moy3plusBas AS “FilterDn”, lineHaut AS “Ligne Haute”, lineBas AS “Ligne Basse”, aplushauts as “aplushauts”, aplusbas as “aplusbas”
Ma demande est la suivante : je souhaiterai que soit tracée la moyenne des 5 ou 6 derniers Moy3plushauts et des 5 ou 6 derniers Moy3plusbas.
Par exemple, j’ai joint un graphique USD CAD en Timeframe 1 heure qui date du lundi 2 novembre à 19h30 environ.
J’ai marqué avec une flèche les Moy3plushauts à retenir (selon moi) en ne prenant en compte que les Moy3plushauts qui ont une certaine durée (par exemple un trait plat qui dure 24 X 1 heure). Autrement dit, je souhaite exclure les Moy3plushauts qui ne dure que quelques UT. Selon mes calculs faits à la louche, la moyenne des 5 moy3plushauts identifiés aboutirait à une ligne horizontale = 0,0026.
En outre, je ne sais pas quel historique de calcul il faut prendre. Je suis sur Prorealtime V12.
Merci pour votre aide.