


Maximale Entfernung zum Close 21:59 anzeigen

Viewing 11 posts - 1 through 11 (of 11 total)

  • Author
    Posts
  • #245545 quote
    RazzRazz
    Participant
    Master

    Guten Morgen

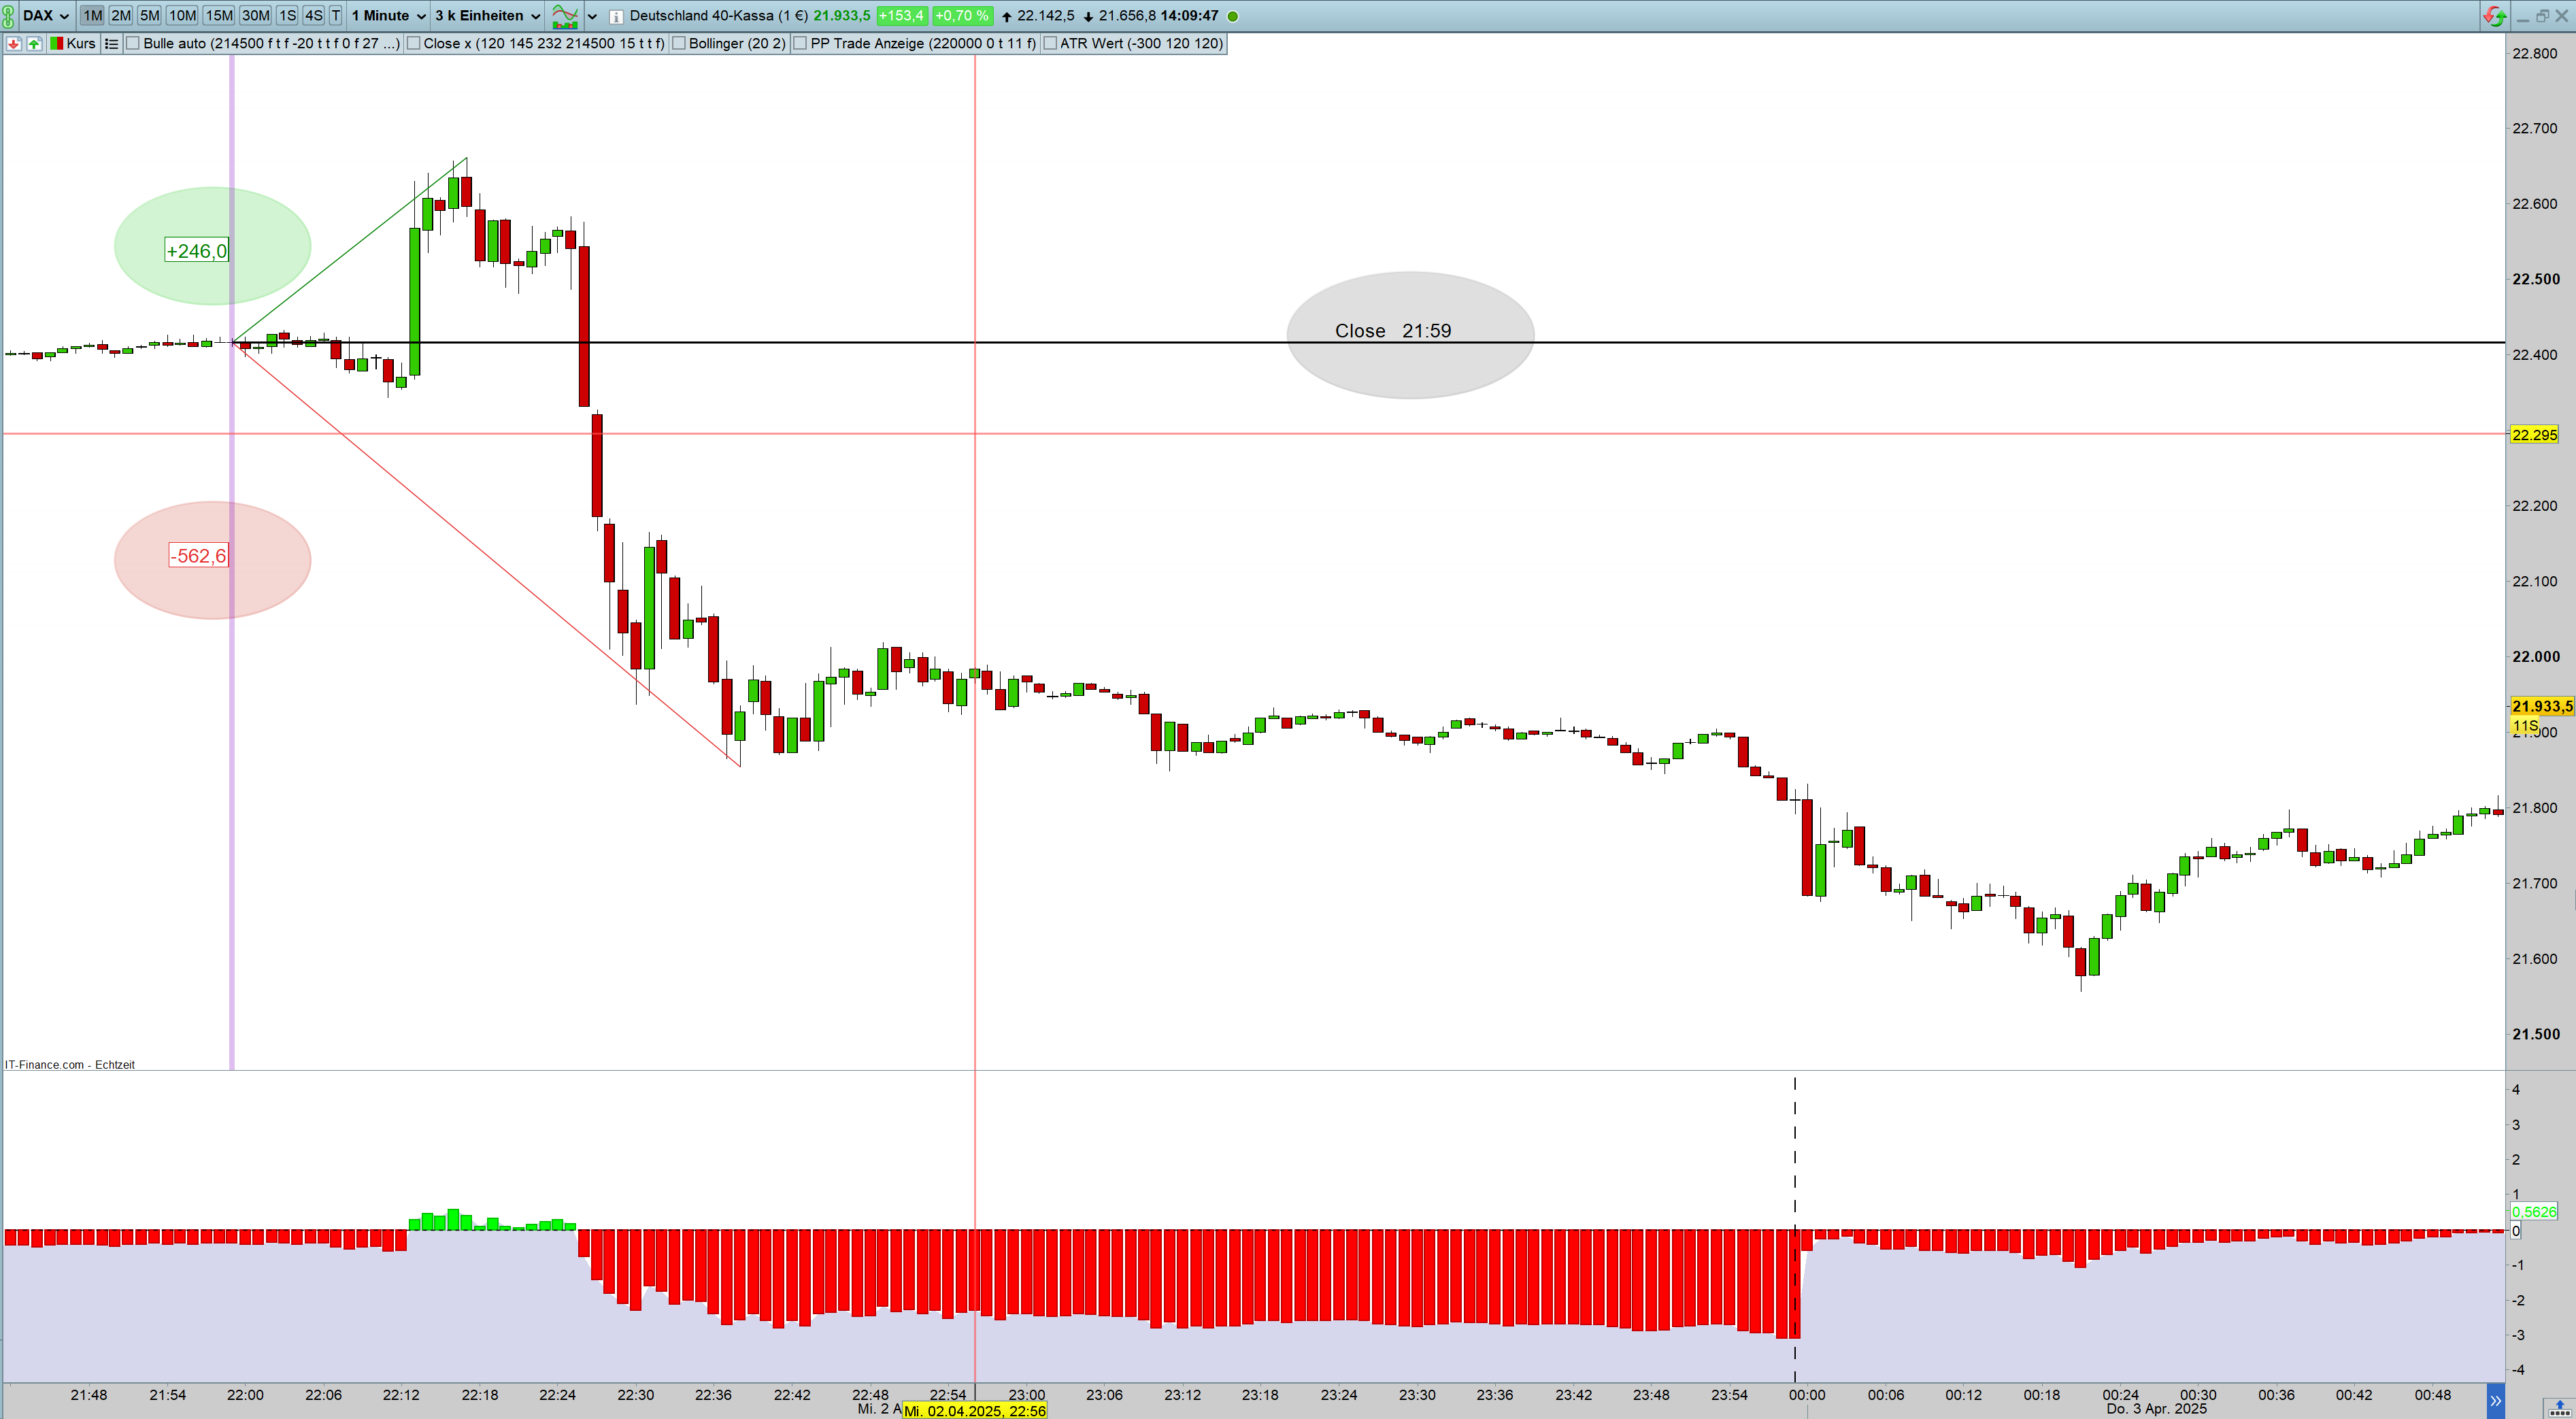
    Ich möchte mir anzeigen lassen wie weit sich der Kurs im Tagesverlauf maximal vom Schlusskurs 21:59 des Vortages entfernt hat .

    Also Praktisch 2 Marken eine ins Positive und eine in Negative das ganze in einem 1 min Chart .

    Leider sind meine Versuche hierzu bisher nicht so erfolgreich gewesen

    Im vorraus Vielen Dank

    #245549 quote
    Iván GonzálezIván González
    Moderator
    Legend

    Hallo. Hier sind sie:

    // Every new day reset price reference 
    if intradaybarindex=0 then
    closeref=close[1]//previous bar
    drawvline(barindex[1])style(dottedline2)//draw vertical line at last intradaybar
    endif
    // Movements calculation (%)
    percent=(close/closeref-1)*100
    // histogram color
    if percent>0 then
    r=0
    g=255
    else
    r=255
    g=0
    endif
    
    return percent as "%" style(histogram,1)coloured(r,g,0), 0 as "zero"style(dottedline,1)
    Razz thanked this post
    #245554 quote
    RazzRazz
    Participant
    Master

    Hallo Iván Danke für Ihre Hilfe

    Leider gibt es da ein Missverständnis  als Bezugspunkt soll der Close um 21:59 gelten und dann sollten die Werte angezeigt

    werden die es wirklich davon abweicht wie im Beispiel für heute +246 Punkte nach oben -562,6 nach unten

    Die Anzeige als Histogramm ist gut dann rechts auch die Realen max. Werte angezeigt werden.

    Ich hoffe Sie verstehen was Ich gerne möchte .

    Ihr Indikator ist im Beispiel unten abgebildet er startet um 23:59

    Screenshot-2025-04-03-140956.png Screenshot-2025-04-03-140956.png
    #245557 quote
    Iván GonzálezIván González
    Moderator
    Legend

    hallo. Ok, jetzt verstehe ich.

    // Every new day reset price reference
    if opentime=215900 then
    closeref=close//previous bar
    drawvline(barindex)style(dottedline2)//draw vertical line at last intradaybar
    endif
    // Movements calculation (%)
    //percent=(close/closeref-1)*100
    distance=close-closeref
    // histogram color
    if distance>0 then
    r=0
    g=255
    else
    r=255
    g=0
    endif
    
    return distance as "Distance" style(histogram,1)coloured(r,g,0), 0 as "zero"style(dottedline,1)
    
    Razz thanked this post
    #245571 quote
    RazzRazz
    Participant
    Master

    Guten Morgen Iván

    Ja jetzt sieht es besser aus 😉

    Kann man als Bezugspunkt auch das High und Low der jeweiligen Kerze nehmen oder geht da nur das Close ?

    Kann man jetzt noch 2 Linien hinzufügen die die max. Abweichung zum High und Low anzeigen bezogen auf den Schlusskurs 21:59 .

    Dann wäre es optimal für mich .

    Vielen Dank im voraus

    #245578 quote
    Iván GonzálezIván González
    Moderator
    Legend

    Hier sind sie:

    once closeref=close
    // Every new day reset price reference
    if opentime=215900 then
    drawvline(barindex)style(dottedline2)//draw vertical line at last intradaybar
    closeref=close//previous bar
    maxdist=0
    mindist=0
    endif
    // Movements calculation
    if low>closeref then
    distance=high-closeref
    elsif high<closeref then
    distance=low-closeref
    else
    distance=close-closeref
    endif
    // Highest and Lowest distance
    if distance>maxdist[1] then
    maxdist=distance
    elsif distance<mindist[1] then
    mindist=distance
    endif
    
    // histogram color
    if distance>0 then
    r=0
    g=255
    else
    r=255
    g=0
    endif
    
    return distance as "Distance" style(histogram,1)coloured(r,g,0), 0 as "zero"style(line,1), maxdist coloured("darkgreen")style(dottedline,2),mindist coloured("darkred")style(dottedline,2)
    
    Razz thanked this post
    #245582 quote
    RazzRazz
    Participant
    Master

    Vielen Vielen Dank Iván  👍

    Das ist genau das was Ich wollte .

    Ich finde es super wie schnell Sie mir hierbei geholfen haben .

    Wünsche Ihnen ein schönes Wochenende.

    #248559 quote
    RazzRazz
    Participant
    Master

    Hallo Iván

    Was muss Ich tun damit der Indikator auf Basis meines Close vom Freitag 21:59

    dann in der darauf Folgenden  Woche, die Abweichung vom Close (Freitag 21:59 Vorwoche)

    zum Tief und High der Woche (Mo-Fr)  anzeigt ?

    Im voraus Vielen Dank und ein schönes Wochenende

    #248625 quote
    RazzRazz
    Participant
    Master

    Guten Morgen

    Hat keiner einen Lösungsansatz ?

    Das ganze sollte im Chartzeitraum M30 funktionieren also Close nun 21:30 Kerze

    Im voraus Vielen Dank

    #248627 quote
    Iván GonzálezIván González
    Moderator
    Legend

    Hallo. Ändere einfach die zweite Codezeile wie folgt:

    if opentime=213000 and dayofweek=5 then

    Ich habe 213000 eingegeben, weil Sie sagten, Sie arbeiten mit TF30.

    Razz thanked this post
    #248629 quote
    RazzRazz
    Participant
    Master

    Vielen Dank

    Manchmal ist die Lösung so einfach

    Vielen Dank nochmals

Viewing 11 posts - 1 through 11 (of 11 total)
  • You must be logged in to reply to this topic.

ProRealAI ProRealAI New

Stuck on this ProBuilder code?

Describe what this topic is trying to build, in plain English, and ProRealAI writes the ProRealTime™ indicator, screener or system for you.

Available in 7 languages
Try ProRealAI

Maximale Entfernung zum Close 21:59 anzeigen


ProBuilder: Indikatoren & Custom Tools

New Reply
Author
author-avatar
Razz @razz Participant
Summary

This topic contains 10 replies,
has 2 voices, and was last updated by RazzRazz

1 year, 2 months ago.

Topic Details
Forum: ProBuilder: Indikatoren & Custom Tools
Language: German
Started: 04/03/2025
Status: Active
Attachments: 1 files
ProRealCode ProRealCode
Loading...

