Long Bar Reversal Using RSI

Viewing 5 posts - 1 through 5 (of 5 total)

  • Author
    Posts
  • #113553 quote
    skrocheyskrochey
    Participant
    New

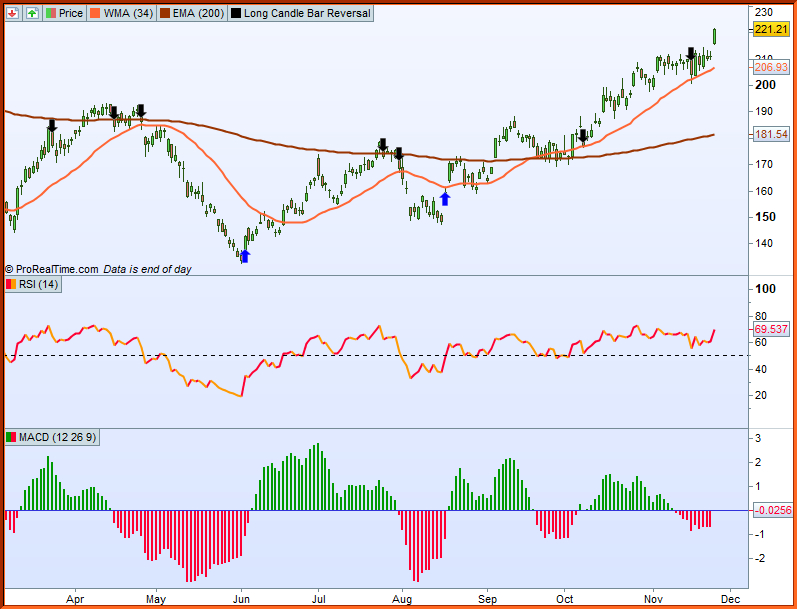
    I am trying to get an alert by having arrows highlighted on the chart indicating a reversal with a long bar using the RSI(14) indicator.

    The condition for a BUY signal is:

    RSI(14) < 50 and

    Current Day RSI(14)   –   Previous Day RSI = 7.5

    If this condition is met, an Arrow ( Black in colour ) is highlighted below the Candle Bar

    The condition for a SELL signal is:

    RSI(14) > 50 and
    Previous Day RSI(14) – Current Day RSI = 7.5
    If this condition is met, an Arrow ( Black in colour ) is highlighted above the Candle Bar

    The attached chart will indicate what I require…

    Long-Bar-Reversal.jpg Long-Bar-Reversal.jpg
    #113569 quote
    VonasiVonasi
    Moderator
    Master

    It is unlikely that todays RSI minus yesterdays RSI will ever exactly equal 7.5

    Do you mean (less than or equal to 7.5) or (greater than or equal to 7.5)?

    Plus your arrow positions and colours in the description do not match those in your image.

    #113570 quote
    VonasiVonasi
    Moderator
    Master

    Perhaps this is what you mean:

    a = rsi[14](close) - rsi[14](close[1])
    b = rsi[14](close[1]) - rsi[14](close)
    
    if rsi[14] < 50 and a <= 7.5 then
    drawarrowup(barindex,low) coloured(0,0,255)
    endif
    
    if rsi[14] > 50 and b <= 7.5 then
    drawarrowdown(barindex,high) coloured(0,0,0)
    endif
    
    return
    #113622 quote
    skrocheyskrochey
    Participant
    New

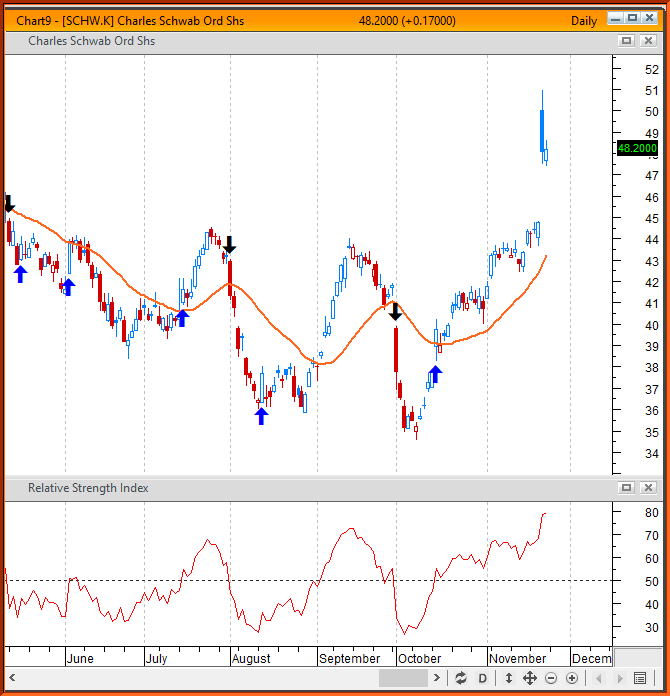
    Thanks for the reply and coding. I made a few changes which tells me that if RSI is lower than 50 and a> 7.5, there will be an Arrow pointing upwards below the candlestick. Interpretation would be that at market bottom, a long candle spiking up would indicate some sort of interest in the financial instrument.

    Vice versa for market tops. Please see the chart as an example….  Than you very much for the coding help.


    a = rsi[14](close) - rsi[14](close[1])
    b = rsi[14](close[1]) - rsi[14](close)
    
    if rsi[14] > 50 and a > 7.5 then
    drawarrowup(barindex,low) coloured(0,0,255)
    endif
    
    if rsi[14] ><50 and b > 7.5 then
    drawarrowdown(barindex,high) coloured(0,0,0)
    endif
    
    return
    RSI-Reversal.jpg RSI-Reversal.jpg
    #113624 quote
    VonasiVonasi
    Moderator
    Master

    Glad to be of assistance. I was assuming that you were looking for a market top or bottom with a slowing of momentum which is why I chose < 7.5 but it did give an awful lot of arrows!

    Please use the ‘Insert PRT Code’ button when posting code in future posts. I’ve tidied up your last post for you. 🙂

Viewing 5 posts - 1 through 5 (of 5 total)
  • You must be logged in to reply to this topic.

ProRealAI ProRealAI New

Stuck on this ProBuilder code?

Describe what this topic is trying to build, in plain English, and ProRealAI writes the ProRealTime™ indicator, screener or system for you.

Available in 7 languages
Try ProRealAI

Long Bar Reversal Using RSI


ProBuilder: Indicators & Custom Tools

New Reply
Author
author-avatar
skrochey @skrochey Participant
Summary

This topic contains 4 replies,
has 2 voices, and was last updated by VonasiVonasi

6 years, 10 months ago.

Topic Details
Forum: ProBuilder: Indicators & Custom Tools
Language: English
Started: 11/25/2019
Status: Active
Attachments: 2 files
ProRealCode ProRealCode
Loading...