


L1 Adaptive Choppiness index.

Viewing 3 posts - 1 through 3 (of 3 total)

  • Author
    Posts
  • #265616 quote
    Harley82Harley82
    Participant
    Veteran

    Buongiorno chiedo di voler cortesemente tradurre il seguente codice Pine Script.

    Ringrazio anticipatamente

    Cordiali saluti// ____ __ ___ ________ ___________ ___________ __ ____ ___

    // / __ )/ / / | / ____/ //_/ ____/ |/_ __< / // / / __ |__

    // / __ / / / /| |/ / / ,< / / / /| | / / / / // /_/ / / __/ /

    // / /_/ / /___/ ___ / /___/ /| / /___/ ___ |/ / / /__ __/ /_/ / __/

    // /_____/_____/_/ |_____/_/ |_____/_/ |_/_/ /_/ /_/ ____/____/


    // This source code is subject to the terms of the Mozilla Public License 2.0 at https://mozilla.org/MPL/2.0/

    //NOTE: to use this indicator properly, you should turn off TV candle symbol setting by, settings–>symbol–> body, borders, wick are all unchecked.

    // © blackcat1402

    //@version=5

    indicator(title=”[blackcat] L1 Adaptive Choppiness Index”, shorttitle=”ACHOP”, format=format.price, precision=2, max_labels_count = 500)

    import blackcat1402/dc_ta/2 as dc


    // Function to calculate the adaptive choppiness index

    calculate_adaptive_choppiness_index(close_price, cycle_participation) =>

    // Calculate the length using Ehlers’ Ho-Dy DC

    length = math.ceil(dc.EhlersHoDyDC(close_price, cycle_participation))


    // Calculate the Adaptive Choppiness Index

    choppiness_index = 100 * math.log10(math.sum(ta.atr(1), length) / (ta.highest(length) – ta.lowest(length))) / math.log10(length)

    alma_choppiness_index = ta.alma(choppiness_index, 5, 0.85, 6)


    // Return the Adaptive Choppiness Index

    alma_choppiness_index


    // Input parameters

    cycle_participation = input.float(0.25, minval=0.00001, step=0.05, title=”Cycle Participation”)

    offset_value = input.int(0, “Offset”, minval=-500, maxval=500)


    // Calculate the Adaptive Choppiness Index

    choppiness_index = calculate_adaptive_choppiness_index(close, cycle_participation)


    // Plot the Adaptive Choppiness Index

    plot(choppiness_index, title=”CHOP”, color=color.yellow, offset=offset_value)


    // Define the bands

    upper_band = hline(61.8, “Upper Band”, color=color.new(#787B86, 0), linestyle=hline.style_dashed)

    middle_band = hline(50, “Middle Band”, color=color.new(#787B86, 50))

    lower_band = hline(38.2, “Lower Band”, color=color.new(#787B86, 0), linestyle=hline.style_dashed)


    // Fill the area between the upper and lower bands

    fill(upper_band, lower_band, color=color.new(#2196F3, 90), title=”Background”)


    // Add trend and sideways labels based on the Adaptive Choppiness Index

    var label trend_label = na

    var label sideways_label = na


    if (choppiness_index > 61.8)

    // label.delete(trend_label)

    trend_label := label.new(bar_index, choppiness_index, text=”Trend”, style=label.style_label_up, color=color.green, textcolor=color.white, size=size.auto)

    // label.delete(sideways_label)


    if (choppiness_index < 38.2)

    // label.delete(trend_label)

    trend_label := label.new(bar_index, choppiness_index, text=”Trend”, style=label.style_label_down, color=color.red, textcolor=color.white, size=size.auto)

    // label.delete(sideways_label)


    if (choppiness_index >= 38.2 and choppiness_index <= 61.8)

    // label.delete(sideways_label)

    sideways_label := label.new(bar_index, choppiness_index, text=”Sideways”, style=label.style_label_right, color=color.orange, textcolor=color.white, size=size.auto)

    // label.delete(trend_label)


    // Alerts

    alertcondition(choppiness_index > 61.8, title=”Trend Alert”, message=”The market is in a trend.”)

    alertcondition(choppiness_index < 38.2, title=”Trend Alert”, message=”The market is in a trend.”)

    alertcondition(choppiness_index >= 38.2 and choppiness_index <= 61.8, title=”Sideways Alert”, message=”The market is sideways.”)

    #265628 quote
    Iván GonzálezIván González
    Moderator
    Legend

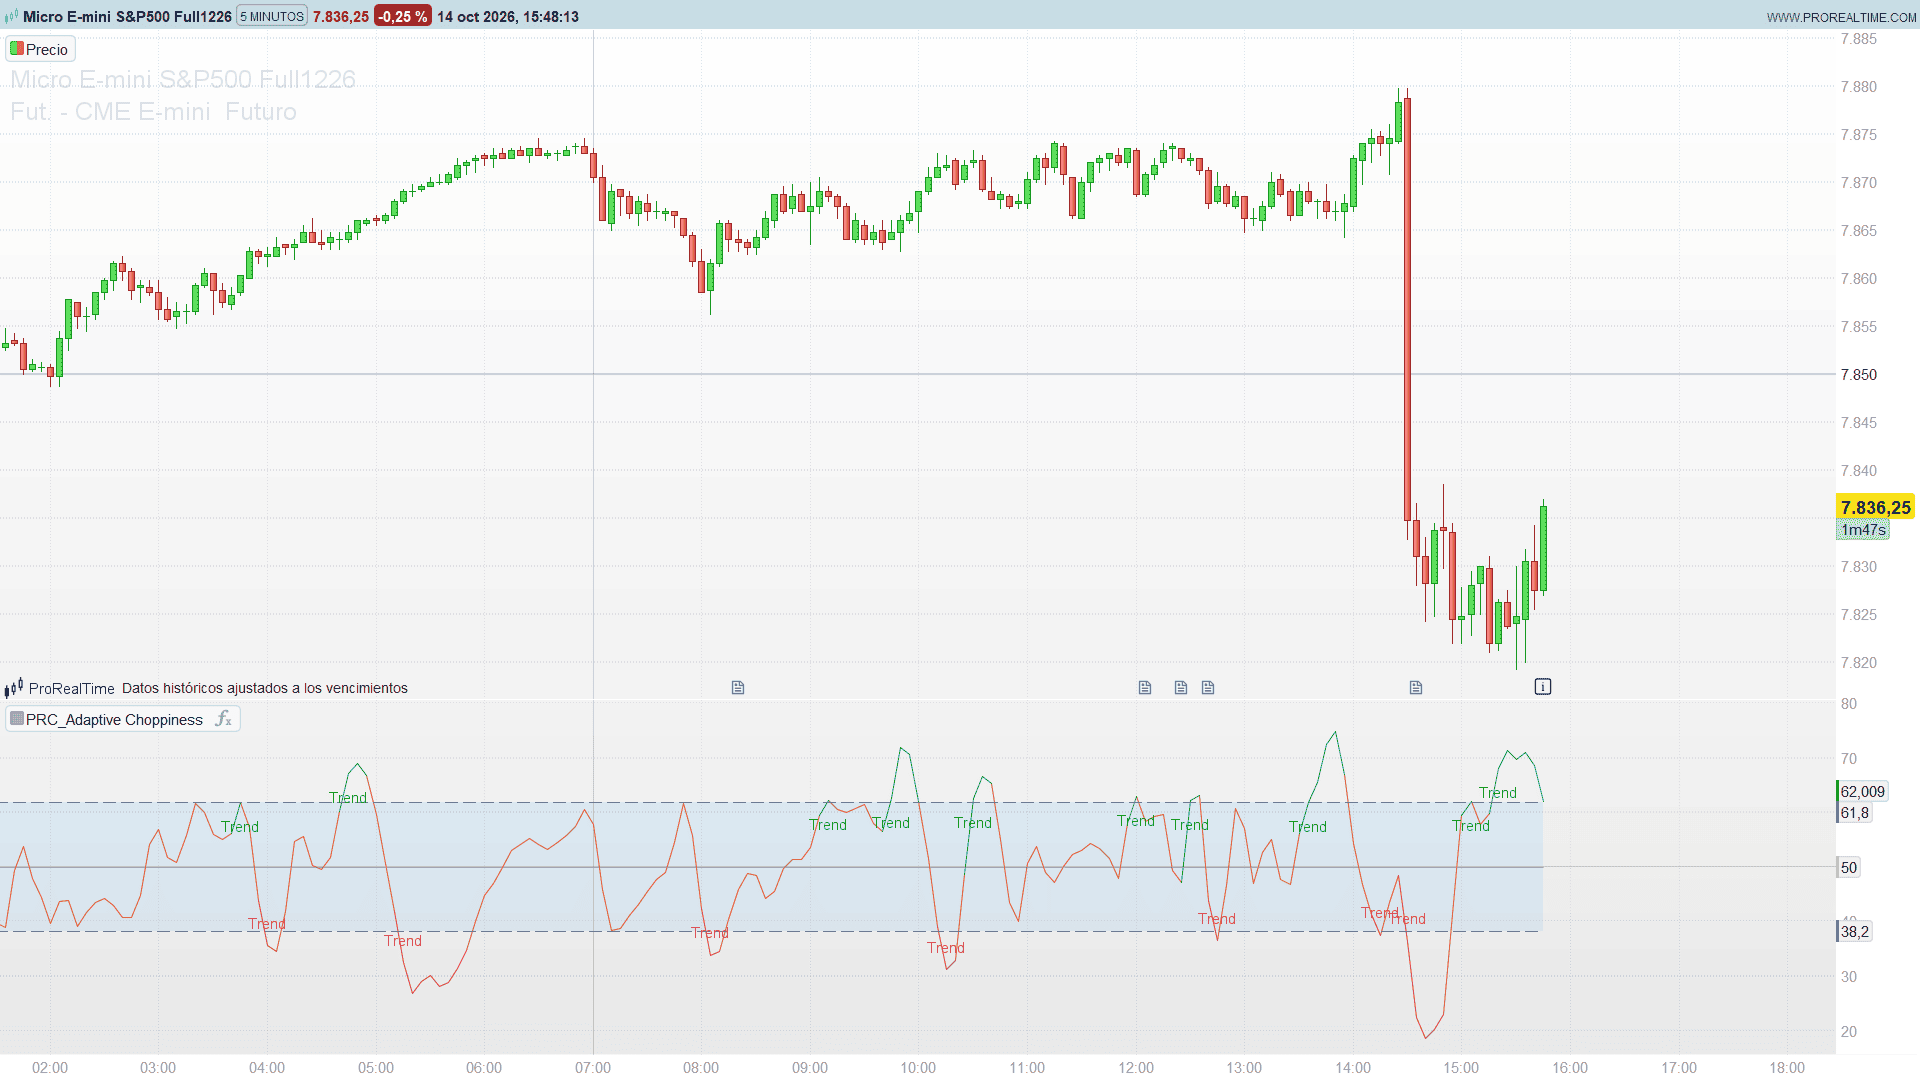
    Here you have:

    //--------------------------------------------
    // PRC_Adaptive Choppiness
    // version = 0
    // 14.10.2026
    // Ivan Gonzalez @ www.prorealcode.com
    // Author: blackcat1402
    // Sharing ProRealTime knowledge
    //--------------------------------------------
    // Choppiness Index whose length follows the dominant cycle
    // measured with Ehlers' Homodyne Discriminator, smoothed with
    // an ALMA(5, 0.85, 6). Above 61.8 and below 38.2 the bar is in
    // a "Trend" zone; in between, "Sideways".
    //--------------------------------------------
    DEFPARAM DRAWONLASTBARONLY = true
    
    //=== INPUTS (declare as Variables in the editor) ===
    cycPart     = 0.25   // Cycle Participation (fraction of the dominant cycle)
    offsetValue = 0      // Shifts the CHOP line N bars to the right
    labelMode   = 1      // 0 = no labels, 1 = where a Trend zone starts, 2 = every bar
    colorLine   = 1      // 1 = line coloured by zone, 0 = single gold line
    
    //=== DOMINANT CYCLE: EHLERS HOMODYNE DISCRIMINATOR ===
    // Every state starts at zero and the previous bar of a missing
    // history counts as zero, as in the original library.
    IF barindex = 0 THEN
       prevI2 = 0
       prevQ2 = 0
       prevRe = 0
       prevIm = 0
       prevPer = 0
       prevSmPer = 0
    ELSE
       prevI2 = hdI2[1]
       prevQ2 = hdQ2[1]
       prevRe = hdRe[1]
       prevIm = hdIm[1]
       prevPer = hdPer[1]
       prevSmPer = hdSmPer[1]
    ENDIF
    hdGain = 0.075 * prevPer + 0.54
    
    hdSmooth = 0
    hdDetr = 0
    hdQ1 = 0
    hdI1 = 0
    hdJI = 0
    hdJQ = 0
    IF barindex > 5 THEN
       // Hilbert transform of the 4-bar weighted price
       hdSmooth = (4 * close + 3 * close[1] + 2 * close[2] + close[3]) / 10
       hdDetr = (0.0962 * hdSmooth + 0.5769 * hdSmooth[2] - 0.5769 * hdSmooth[4] - 0.0962 * hdSmooth[6]) * hdGain
       // In-phase and quadrature components
       hdQ1 = (0.0962 * hdDetr + 0.5769 * hdDetr[2] - 0.5769 * hdDetr[4] - 0.0962 * hdDetr[6]) * hdGain
       hdI1 = hdDetr[3]
       // Advance the phase of I1 and Q1 by 90 degrees
       hdJI = (0.0962 * hdI1 + 0.5769 * hdI1[2] - 0.5769 * hdI1[4] - 0.0962 * hdI1[6]) * hdGain
       hdJQ = (0.0962 * hdQ1 + 0.5769 * hdQ1[2] - 0.5769 * hdQ1[4] - 0.0962 * hdQ1[6]) * hdGain
    ENDIF
    
    // Phasor addition for 3-bar averaging, smoothed before the discriminator
    hdI2 = 0.2 * (hdI1 - hdJQ) + 0.8 * prevI2
    hdQ2 = 0.2 * (hdQ1 + hdJI) + 0.8 * prevQ2
    
    // Homodyne discriminator
    hdRe = 0.2 * (hdI2 * prevI2 + hdQ2 * prevQ2) + 0.8 * prevRe
    hdIm = 0.2 * (hdI2 * prevQ2 - hdQ2 * prevI2) + 0.8 * prevIm
    
    hdRaw = 0
    IF abs(hdIm) > 0 AND abs(hdRe) > 0 THEN
       // ATAN returns degrees: 360 / atan in degrees = 2 * pi / atan in radians
       hdRaw = 360 / ATAN(hdIm / hdRe)
    ENDIF
    IF hdRaw > 1.5 * prevPer THEN
       hdRaw = 1.5 * prevPer
    ENDIF
    IF 0.67 * prevPer > hdRaw THEN
       hdRaw = 0.67 * prevPer
    ENDIF
    // Keep the period between 6 and 50 bars
    IF 6 > hdRaw THEN
       hdRaw = 6
    ENDIF
    IF hdRaw > 50 THEN
       hdRaw = 50
    ENDIF
    hdPer = 0.2 * hdRaw + 0.8 * prevPer
    hdSmPer = 0.33 * hdPer + 0.67 * prevSmPer
    
    // Length = cycle participation x smoothed period, rounded up, 1 to 34 bars
    domCycle = ceil(cycPart * hdSmPer)
    IF domCycle > 34 THEN
       domCycle = 34
    ENDIF
    IF 1 > domCycle THEN
       domCycle = 1
    ENDIF
    
    //=== ADAPTIVE CHOPPINESS INDEX ===
    chopLen = domCycle
    trSum = summation[chopLen](tr)
    hiLo = highest[chopLen](high) - lowest[chopLen](low)
    
    // A one-bar length or a flat range has no value (division by zero)
    chopOk = 0
    chopRaw = 0
    IF chopLen > 1 AND hiLo > 0 AND trSum > 0 THEN
       chopOk = 1
       // log10(a) / log10(b) is the same ratio as log(a) / log(b)
       chopRaw = 100 * LOG(trSum / hiLo) / LOG(chopLen)
    ENDIF
    
    //=== ALMA(5, 0.85, 6) SMOOTHING ===
    // Gaussian weights centred at 0.85 x (5 - 1) = 3.4, sigma = 5 / 6.
    // A bar without value inside the 5-bar window leaves the ALMA empty.
    almaOk = 0
    IF barindex >= 4 THEN
       IF summation[5](chopOk) = 5 THEN
          almaOk = 1
       ENDIF
    ENDIF
    IF almaOk = 1 THEN
       almaM = 0.85 * 4
       almaS = 5 / 6
       wSum = 0
       wNorm = 0
       FOR kW = 0 TO 4 DO
          wK = EXP(-((kW - almaM) * (kW - almaM)) / (2 * almaS * almaS))
          wSum = wSum + wK * chopRaw[4 - kW]
          wNorm = wNorm + wK
       NEXT
       aChop = wSum / wNorm
    ELSIF barindex = 0 THEN
       aChop = 50
    ELSE
       // No value: keep the last one, hidden (alpha 0)
       aChop = aChop[1]
    ENDIF
    
    //=== ZONE OF EACH BAR ===
    // 1 = Trend above 61.8, -1 = Trend below 38.2, 0 = Sideways, 9 = no value
    upperBand = 61.8
    lowerBand = 38.2
    chopSt = 9
    IF almaOk = 1 THEN
       IF aChop > upperBand THEN
          chopSt = 1
       ELSIF lowerBand > aChop THEN
          chopSt = -1
       ELSE
          chopSt = 0
       ENDIF
    ENDIF
    
    //=== PLOT ===
    // Hidden while empty and on the first bar after a gap, so that no
    // segment is drawn from the held value
    offBars = max(0, round(offsetValue))
    shown = 50
    lineA = 0
    stShown = 9
    IF barindex >= offBars THEN
       shown = aChop[offBars]
       stShown = chopSt[offBars]
       IF almaOk[offBars] = 1 AND almaOk[offBars + 1] = 1 THEN
          lineA = 255
       ENDIF
    ENDIF
    // Single gold line, or coloured by zone: green / red Trend, orange Sideways
    lineR = 176
    lineG = 110
    lineB = 0
    IF colorLine = 1 THEN
       IF stShown = 1 THEN
          lineR = 22
          lineG = 163
          lineB = 74
       ELSIF stShown = -1 THEN
          lineR = 242
          lineG = 54
          lineB = 69
       ELSIF stShown = 0 THEN
          lineR = 234
          lineG = 88
          lineB = 12
       ENDIF
    ENDIF
    
    COLORBETWEEN(upperBand, lowerBand, 33, 150, 243, 25)
    
    //=== LABELS (within the last 500 bars with a value) ===
    IF labelMode >= 1 AND islastbarupdate THEN
       // Pass 1: find the 500 most recent bars with a value and their range
       vMax = upperBand
       vMin = lowerBand
       nLab = 0
       jEnd = 0
       jB = 0
       WHILE 500 > nLab AND barindex >= jB DO
          IF almaOk[jB] = 1 THEN
             nLab = nLab + 1
             vMax = max(vMax, aChop[jB])
             vMin = min(vMin, aChop[jB])
             jEnd = jB
          ENDIF
          jB = jB + 1
       WEND
       // Pass 2: "Trend" under the line above 61.8, above it below 38.2,
       // "Sideways" on the line in between. Mode 1 labels only the first
       // bar of each Trend zone; mode 2 labels every bar.
       lblGap = (vMax - vMin) * 0.06
       IF nLab > 0 THEN
          FOR jB = 0 TO jEnd DO
             sL = chopSt[jB]
             drawIt = 0
             IF labelMode >= 2 THEN
                IF 9 > sL THEN
                   drawIt = 1
                ENDIF
             ELSIF abs(sL) = 1 THEN
                IF abs(sL - chopSt[jB + 1]) > 0 THEN
                   drawIt = 1
                ENDIF
             ENDIF
             IF drawIt = 1 THEN
                vL = aChop[jB]
                IF sL = 1 THEN
                   DRAWTEXT("Trend", barindex - jB, vL - lblGap) COLOURED(22, 163, 74)
                ELSIF sL = -1 THEN
                   DRAWTEXT("Trend", barindex - jB, vL + lblGap) COLOURED(242, 54, 69)
                ELSE
                   DRAWTEXT("Sideways", barindex - jB, vL) COLOURED(234, 88, 12)
                ENDIF
             ENDIF
          NEXT
       ENDIF
    ENDIF
    
    RETURN shown COLOURED(lineR, lineG, lineB, lineA) STYLE(line, 1) AS "CHOP", upperBand COLOURED(120, 123, 134) STYLE(dottedline2, 1) AS "Upper Band", 50 COLOURED(120, 123, 134, 127) STYLE(line, 1) AS "Middle Band", lowerBand COLOURED(120, 123, 134) STYLE(dottedline2, 1) AS "Lower Band"


    MESXXXX-5-minutos.png MESXXXX-5-minutos.png
    #265629 quote
    Harley82Harley82
    Participant
    Veteran

    Ringrazio vivamente per la sollecita risposta.

    Cordiali saluti.

Viewing 3 posts - 1 through 3 (of 3 total)
  • You must be logged in to reply to this topic.

ProRealAI ProRealAI New

Stuck on this ProBuilder code?

Describe what this topic is trying to build, in plain English, and ProRealAI writes the ProRealTime™ indicator, screener or system for you.

Available in 7 languages
Try ProRealAI

TradingView to ProRealTime Translation Center

New Reply
Author
author-avatar
Harley82 @harley82 Participant
Summary

This topic contains 2 replies,
has 2 voices, and was last updated by Harley82Harley82

6 hours, 15 minutes ago.

Topic Details
Forum: TradingView to ProRealTime Translation Center Forum
Started: 10/14/2026
Status: Active
Attachments: 1 files
ProRealCode ProRealCode
Loading...

