Indicateur “Breakout Probability” TV à Traduire

Viewing 2 posts - 1 through 2 (of 2 total)
  • Author
    Posts
  • #250495 quote
    paulPRTpaulPRT
    Participant
    Junior

    Bonjour,

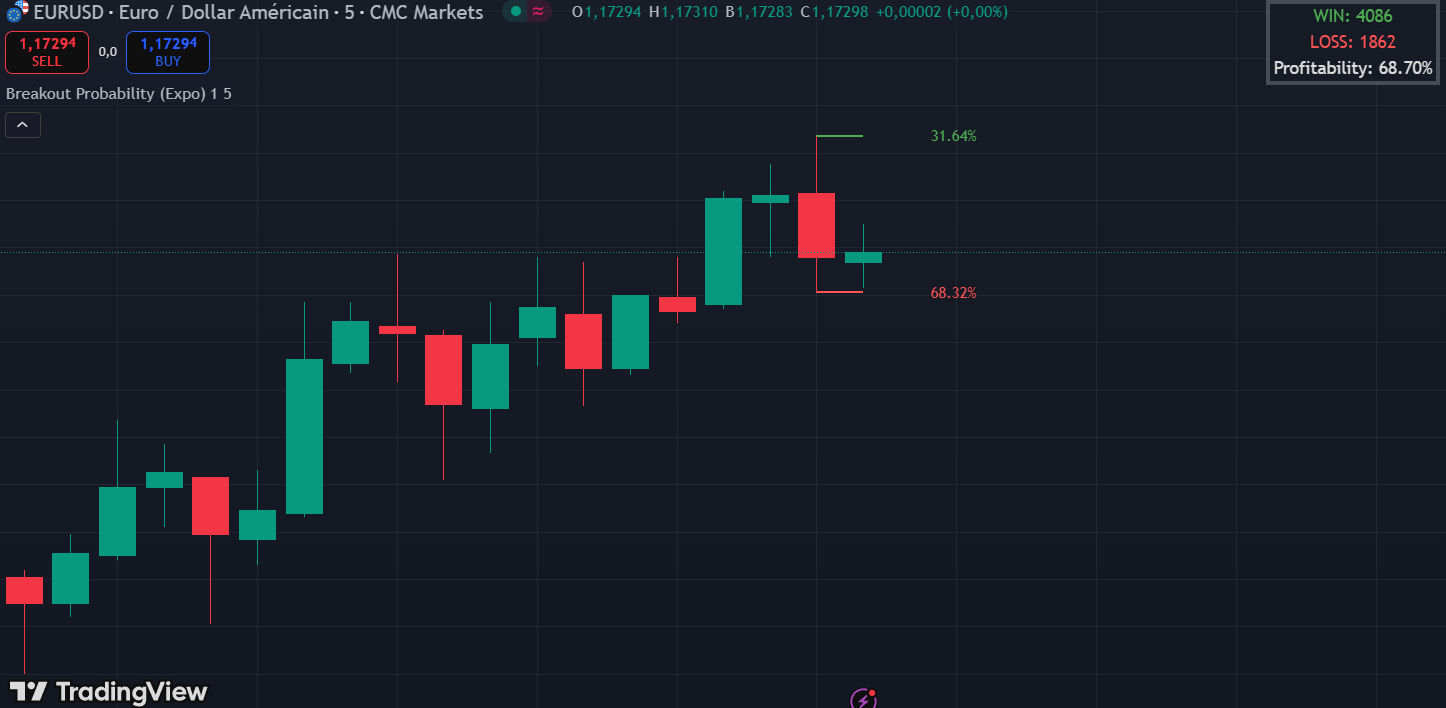
    Voici un indicateur que j’ai récupéré sur Trading View et que je souhaiterai faire traduire en ProBuilder.

    Il s’appelle “Breakout Probability” et a été créé par Zeiierman.

    Il a l’air de plutôt bien fonctionné.

    En vous souhaitant une très bonne journée !


    // © Zeiierman
    //@version=5
    indicator(“Breakout Probability (Expo)”,overlay=true,max_bars_back=5000)
    // ~~ Tooltips {
    t1 = “The space between the levels can be adjusted with a percentage step. 1% means that each level is located 1% above/under the previous one.”
    t2 = “Set the number of levels you want to display.”
    t3 = “If a level got 0 % likelihood of being hit, the level is not displayed as default. Enable the option if you want to see all levels regardless of their values.”
    t4 = “Enable this option if you want to display the backtest statistics for that a new high or low is made.”
    string [] tbl_tips = array.from(“Number of times price has reached the first highest percentage level”,
     “Number of times price failed to reach the first highest percentage level”,
     “Win/Loss ratio”)
    //~~~~~~~~~~~~~~~~~~~~~~~~~~~~~~~~~~~~~~~~~~~~~~~~~~~~~~~~~~~~~~~~~~~~~~~~~~~~~~}
    // ~~ Inputs {
    perc                    = input.float(1.0,title=”Percentage Step”,step=.1,minval=0,group=”Settings”,tooltip=t1)
    nbr                     = input.int(5, title=”Number of Lines”,maxval=5,minval=1,group=”Settings”,tooltip=t2)
    upCol                   = input.color(color.new(color.green,0),title=””,inline=”col”),dnCol=input.color(color.new(color.red,0),title=””,inline=”col”),fill=input.bool(true,title=”BG Color”,inline=”col”)
    var bool [] bools       = array.from(input.bool(true,title=”Disable 0.00%”,group=”Settings”,tooltip=t3),input.bool(true, title=”Show Statistic Panel”,group=”Settings”,tooltip=t4))
    var bool [] alert_bool  = array.from(
     input.bool(true,title=”Ticker ID”,group=”Any alert() function call”),
     input.bool(true,title=”High/Low Price”,group=”Any alert() function call”),
     input.bool(true,title=”Bullish/Bearish Bias”,group=”Any alert() function call”),
     input.bool(true,title=”Bullish/Bearish Percentage”,group=”Any alert() function call”))
    //~~~~~~~~~~~~~~~~~~~~~~~~~~~~~~~~~~~~~~~~~~~~~~~~~~~~~~~~~~~~~~~~~~~~~~~~~~~~~~}
    // ~~ Variables {
    b = bar_index
    o = open
    h = high
    l = low
    c = close
    step = c*(perc/100)
    //~~~~~~~~~~~~~~~~~~~~~~~~~~~~~~~~~~~~~~~~~~~~~~~~~~~~~~~~~~~~~~~~~~~~~~~~~~~~~~}
    // ~~ Save Values In Matrix {
    var total  = matrix.new<int>(7,4,0)
    var vals   = matrix.new<float>(5,4,0.0)
    var lines  = matrix.new<line>(1,10,line(na))
    var labels = matrix.new<label>(1,10,label(na))
    var tbl    = matrix.new<table>(1,1,table.new(position.top_right,2,3,
     frame_color=color.new(color.gray,50),frame_width=3,
     border_color=chart.bg_color,border_width=-2))
    //~~~~~~~~~~~~~~~~~~~~~~~~~~~~~~~~~~~~~~~~~~~~~~~~~~~~~~~~~~~~~~~~~~~~~~~~~~~~~~}
    // ~~ Save Number Of Green & Red Candles {
    green = c[1]>o[1]
    red   = c[1]<o[1]
    if green
        prev = matrix.get(total,5,0)
        matrix.set(total,5,0,prev+1)
    if red
        prev = matrix.get(total,5,1)
        matrix.set(total,5,1,prev+1)
    //~~~~~~~~~~~~~~~~~~~~~~~~~~~~~~~~~~~~~~~~~~~~~~~~~~~~~~~~~~~~~~~~~~~~~~~~~~~~~~}
    // ~~ Functions {
    //Lines
    CreateLine(p,i,c)=>
        prevLine = matrix.get(lines,0,i)
        line.delete(prevLine)
        li = line.new(b[1],p,b,p,color=c,width=2)
        matrix.set(lines,0,i,li)
    //Labels
    CreateLabel(p,i,c,r,v)=>
        prevLabel = matrix.get(labels,0,i)
        label.delete(prevLabel)
        la = label.new(b+1,p,text=str.tostring(matrix.get(vals,r,v),format.percent),
         style=label.style_label_left,color=color.new(color.black,100),textcolor=c)
        matrix.set(labels,0,i,la)
    //Score Calculation
    Score(x,i)=>
        ghh = matrix.get(total,i,0)
        gll = matrix.get(total,i,1)
        rhh = matrix.get(total,i,2)
        rll = matrix.get(total,i,3)
        gtotal = matrix.get(total,5,0)
        rtotal = matrix.get(total,5,1)
        hh = h>=h[1] + x
        ll = l<=l[1] – x
        if green and hh
            matrix.set(total,i,0,ghh+1)
            matrix.set(vals,i,0,math.round(((ghh+1)/gtotal)*100,2))
        if green and ll
            matrix.set(total,i,1,gll+1)
            matrix.set(vals,i,1,math.round(((gll+1)/gtotal)*100,2))
        if red and hh
            matrix.set(total,i,2,rhh+1)
            matrix.set(vals,i,2,math.round(((rhh+1)/rtotal)*100,2))
        if red and ll
            matrix.set(total,i,3,rll+1)
            matrix.set(vals,i,3,math.round(((rll+1)/rtotal)*100,2))
    //Backtest
    Backtest(v)=>
        p1 = matrix.get(total,6,0)
        p2 = matrix.get(total,6,1)
        if v==h[1]
            if h>=v
                matrix.set(total,6,0,p1+1)
            else
                matrix.set(total,6,1,p2+1)
        else
            if l<=v
                matrix.set(total,6,0,p1+1)
            else
                matrix.set(total,6,1,p2+1)
    //~~~~~~~~~~~~~~~~~~~~~~~~~~~~~~~~~~~~~~~~~~~~~~~~~~~~~~~~~~~~~~~~~~~~~~~~~~~~~~}
    // ~~ Code {
    //Run Score Function
    Score(0,0)
    Score(step,1)
    Score(step*2,2)
    Score(step*3,3)
    Score(step*4,4)
    //Fetch Score Values
    a1 = matrix.get(vals,0,0)
    b1 = matrix.get(vals,0,1)
    a2 = matrix.get(vals,0,2)
    b2 = matrix.get(vals,0,3)
    //Lines & Labels & Alerts
    for i=0 to nbr-1
        hide = array.get(bools,0)
        if not hide or (hide and (green?math.min(matrix.get(vals,i,0),
         matrix.get(vals,i,1))>0:
         math.min(matrix.get(vals,i,2),
         matrix.get(vals,i,3))>0))
            hi = h[1]+(step*i)
            lo = l[1]-(step*i)
            //Plot Lines
            CreateLine(hi,i,upCol)
            CreateLine(lo,5+i,dnCol)
            //Plot Labels
            if green
                CreateLabel(hi,i,upCol,i,0)
                CreateLabel(lo,5+i,dnCol,i,1)
            else
                CreateLabel(hi,i,upCol,i,2)
                CreateLabel(lo,5+i,dnCol,i,3)
            //Create Alert
            if array.includes(alert_bool, true)
                s1 = str.tostring(syminfo.ticker)
                s2 = “High Price: “+str.tostring(math.round_to_mintick(h[1]))+
                 ” | Low Price: “+str.tostring(math.round_to_mintick(l[1]))
                s3 = green?(math.max(a1,b1)==a1?”BULLISH”:”BEARISH”):
                 (math.max(a2,b2)==a2?”BULLISH”:”BEARISH”)
                s4 = green?(math.max(a1,b1)==a1?a1:b1):(math.min(a2,b2)==a2?a2:b2)
                s5 = red  ?(math.max(a2,b2)==a2?a2:b2):(math.min(a1,b1)==a1?a1:b1)
                string [] str_vals = array.from(s1,s2,”BIAS: “+s3,
                 “Percentage: High: “+str.tostring(s4,format.percent)
                 +” | Low: “+str.tostring(s5,format.percent))
                output = array.new_string()
                for x=0 to array.size(alert_bool)-1
                    if array.get(alert_bool,x)
                        array.push(output,array.get(str_vals,x))
                //Alert Is Triggered On Every Bar Open With Bias And Percentage Ratio
                alert(array.join(output,’\n’),alert.freq_once_per_bar)
        else
            //Delete Old Lines & Labels
            line.delete(matrix.get(lines,0,i))
            line.delete(matrix.get(lines,0,5+i))
            label.delete(matrix.get(labels,0,i))
            label.delete(matrix.get(labels,0,5+i))
    //Run Backtest Function
    Backtest(green?(math.max(a1,b1)==a1?h[1]:l[1]):(math.max(a2,b2)==a2?h[1]:l[1]))
    //~~~~~~~~~~~~~~~~~~~~~~~~~~~~~~~~~~~~~~~~~~~~~~~~~~~~~~~~~~~~~~~~~~~~~~~~~~~~~~}
    // ~~ Linefill {
    if fill
        var filler = linefill(na)
        for i=0 to 8
            get = matrix.get(lines,0,i)
            get1= matrix.get(lines,0,i+1)
            col = i>4?color.new(dnCol,80) : i==4?color.new(color.gray,100) : color.new(upCol,80)
            filler := linefill.new(get,get1,color=col)
            linefill.delete(filler[1])
    //~~~~~~~~~~~~~~~~~~~~~~~~~~~~~~~~~~~~~~~~~~~~~~~~~~~~~~~~~~~~~~~~~~~~~~~~~~~~~~}
    // ~~ Table {
    if barstate.islast and array.get(bools,1)
        //Calulate WinRatio
        W  = matrix.get(total,6,0)
        L  = matrix.get(total,6,1)
        WR = math.round(W/(W+L)*100,2)
        string [] tbl_vals = array.from(“WIN: “+str.tostring(W),
         “LOSS: “+str.tostring(L),
         “Profitability: “+str.tostring(WR,format.percent))
        color [] tbl_col = array.from(color.green,color.red,chart.fg_color)
        for i=0 to 2
            table.cell(matrix.get(tbl,0,0),0,i,array.get(tbl_vals,i),
             text_halign=text.align_center,bgcolor=chart.bg_color,
             text_color=array.get(tbl_col,i),text_size=size.auto,
             tooltip=array.get(tbl_tips,i))
    //~~~~~~~~~~~~~~~~~~~~~~~~~~~~~~~~~~~~~~~~~~~~~~~~~~~~~~~~~~~~~~~~~~~~~~~~~~~~~~}

    Capture-decran-2025-09-08-095238.png Capture-decran-2025-09-08-095238.png
    #250505 quote
    Iván GonzálezIván González
    Moderator
    Legend

    voici

    //-------------------------------------------------------------
    // PRC_Breakout Probability (Expo) by Zeiierman
    // version = 0
    // 08.09.25
    // Iván González @ www.prorealcode.com
    // Sharing ProRealTime knowledge
    //-------------------------------------------------------------
    defparam drawonlastbaronly=true
    //-------------------------------------------------------------
    // --- Inputs
    //-------------------------------------------------------------
    perc = 1.0 // Percentage step between levels
    nbr = 5 // Number of lines to display (maximum 5)
    fill = 1 // 1 to fill the background between lines, 0 to disable
    hideZero = 1 // 1 to hide levels with 0% probability, 0 to show them
    //-------------------------------------------------------------
    ONCE totalGreenCandles = 0
    ONCE totalRedCandles = 0
    
    // Emulating the 'total' matrix using arrays for counters
    // $total[row][column] -> $totalRow[column]
    ONCE $total0[3] = 0 // Row 0: ghh, gll, rhh, rll
    ONCE $total1[3] = 0 // Row 1
    ONCE $total2[3] = 0 // Row 2
    ONCE $total3[3] = 0 // Row 3
    ONCE $total4[3] = 0 // Row 4
    
    // Emulating the 'vals' matrix using arrays for percentages
    ONCE $vals0[3] = 0.0 // Row 0: ghh%, gll%, rhh%, rll%
    ONCE $vals1[3] = 0.0 // Row 1
    ONCE $vals2[3] = 0.0 // Row 2
    ONCE $vals3[3] = 0.0 // Row 3
    ONCE $vals4[3] = 0.0 // Row 4
    //-------------------------------------------------------------
    // --- Main logic (runs on each bar)
    //-------------------------------------------------------------
    IF barindex > 1 THEN
       
       // Determine whether the previous candle was green or red
       green = close[1] > open[1]
       red = close[1] < open[1]
       
       // Tally total green and red candles
       IF green THEN
          totalGreenCandles = totalGreenCandles + 1
       ENDIF
       IF red THEN
          totalRedCandles = totalRedCandles + 1
       ENDIF
       
       // Compute step based on the previous close
       step = close[1] * (perc / 100)
       //-------------------------------------------------------------
       // --- Inlined 'Score' logic for 5 levels ---
       //-------------------------------------------------------------
       // Level 0 (no step)
       x0 = 0
       hh0 = high >= high[1] + x0
       ll0 = low <= low[1] - x0
       IF green AND hh0 THEN
          $total0[0] = $total0[0] + 1
       ENDIF
       IF green AND ll0 THEN
          $total0[1] = $total0[1] + 1
       ENDIF
       IF red AND hh0 THEN
          $total0[2] = $total0[2] + 1
       ENDIF
       IF red AND ll0 THEN
          $total0[3] = $total0[3] + 1
       ENDIF
       
       // Level 1 (step * 1)
       x1 = step
       hh1 = high >= high[1] + x1
       ll1 = low <= low[1] - x1
       IF green AND hh1 THEN
          $total1[0] = $total1[0] + 1
       ENDIF
       IF green AND ll1 THEN
          $total1[1] = $total1[1] + 1
       ENDIF
       IF red AND hh1 THEN
          $total1[2] = $total1[2] + 1
       ENDIF
       IF red AND ll1 THEN
          $total1[3] = $total1[3] + 1
       ENDIF
       
       // Level 2 (step * 2)
       x2 = step * 2
       hh2 = high >= high[1] + x2
       ll2 = low <= low[1] - x2
       IF green AND hh2 THEN
          $total2[0] = $total2[0] + 1
       ENDIF
       IF green AND ll2 THEN
          $total2[1] = $total2[1] + 1
       ENDIF
       IF red AND hh2 THEN
          $total2[2] = $total2[2] + 1
       ENDIF
       IF red AND ll2 THEN
          $total2[3] = $total2[3] + 1
       ENDIF
       
       // Level 3 (step * 3)
       x3 = step * 3
       hh3 = high >= high[1] + x3
       ll3 = low <= low[1] - x3
       IF green AND hh3 THEN
          $total3[0] = $total3[0] + 1
       ENDIF
       IF green AND ll3 THEN
          $total3[1] = $total3[1] + 1
       ENDIF
       IF red AND hh3 THEN
          $total3[2] = $total3[2] + 1
       ENDIF
       IF red AND ll3 THEN
          $total3[3] = $total3[3] + 1
       ENDIF
       
       // Level 4 (step * 4)
       x4 = step * 4
       hh4 = high >= high[1] + x4
       ll4 = low <= low[1] - x4
       IF green AND hh4 THEN
          $total4[0] = $total4[0] + 1
       ENDIF
       IF green AND ll4 THEN
          $total4[1] = $total4[1] + 1
       ENDIF
       IF red AND hh4 THEN
          $total4[2] = $total4[2] + 1
       ENDIF
       IF red AND ll4 THEN
          $total4[3] = $total4[3] + 1
       ENDIF
       
       // Recompute percentages on each bar
       IF totalGreenCandles > 0 THEN
          $vals0[0] = ($total0[0] / totalGreenCandles)
          $vals0[1] = ($total0[1] / totalGreenCandles)
          $vals1[0] = ($total1[0] / totalGreenCandles)
          $vals1[1] = ($total1[1] / totalGreenCandles)
          $vals2[0] = ($total2[0] / totalGreenCandles)
          $vals2[1] = ($total2[1] / totalGreenCandles)
          $vals3[0] = ($total3[0] / totalGreenCandles)
          $vals3[1] = ($total3[1] / totalGreenCandles)
          $vals4[0] = ($total4[0] / totalGreenCandles)
          $vals4[1] = ($total4[1] / totalGreenCandles)
       ENDIF
       
       IF totalRedCandles > 0 THEN
          $vals0[2] = ($total0[2] / totalRedCandles)
          $vals0[3] = ($total0[3] / totalRedCandles)
          $vals1[2] = ($total1[2] / totalRedCandles)
          $vals1[3] = ($total1[3] / totalRedCandles)
          $vals2[2] = ($total2[2] / totalRedCandles)
          $vals2[3] = ($total2[3] / totalRedCandles)
          $vals3[2] = ($total3[2] / totalRedCandles)
          $vals3[3] = ($total3[3] / totalRedCandles)
          $vals4[2] = ($total4[2] / totalRedCandles)
          $vals4[3] = ($total4[3] / totalRedCandles)
       ENDIF
       
    ENDIF
    //-------------------------------------------------------------
    // --- Drawing of Lines, Labels and Fill
    //-------------------------------------------------------------
    // We use a temporary array to store levels and ease the filling
    ONCE $hiLevels[4] = 0.0
    ONCE $loLevels[4] = 0.0
    if islastbarupdate then
       FOR i = 0 TO nbr - 1
          
          // Fetch the proper percentages depending on the previous candle (green or red)
          myProbUp = 0
          myProbDown = 0
          
          IF green THEN
             IF i = 0 THEN
                myProbUp = $vals0[0]
                myProbDown = $vals0[1]
             ELSIF i = 1 THEN
                myProbUp = $vals1[0]
                myProbDown = $vals1[1]
             ELSIF i = 2 THEN
                myProbUp = $vals2[0]
                myProbDown = $vals2[1]
             ELSIF i = 3 THEN
                myProbUp = $vals3[0]
                myProbDown = $vals3[1]
             ELSIF i = 4 THEN
                myProbUp = $vals4[0]
                myProbDown = $vals4[1]
             ENDIF
          ELSE // if previous candle is red
             IF i = 0 THEN
                myProbUp = $vals0[2]
                myProbDown = $vals0[3]
             ELSIF i = 1 THEN
                myProbUp = $vals1[2]
                myProbDown = $vals1[3]
             ELSIF i = 2 THEN
                myProbUp = $vals2[2]
                myProbDown = $vals2[3]
             ELSIF i = 3 THEN
                myProbUp = $vals3[2]
                myProbDown = $vals3[3]
             ELSIF i = 4 THEN
                myProbUp = $vals4[2]
                myProbDown = $vals4[3]
             ENDIF
          ENDIF
          
          // Condition to hide levels with 0%
          showLevel = (hideZero = 0) OR (hideZero = 1 AND myProbUp > 0 AND myProbDown > 0)
          
          IF showLevel THEN
             // Compute price levels
             hiLevel = high[1] + (step * i)
             loLevel = low[1] - (step * i)
             
             // Save into arrays for filling
             $hiLevels[i] = hiLevel
             $loLevels[i] = loLevel
             
             // Draw lines
             DRAWSEGMENT(barindex[1], hiLevel, barindex, hiLevel) COLOURED("green") STYLE(Line, 2)
             DRAWSEGMENT(barindex[1], loLevel, barindex, loLevel) COLOURED("red") STYLE(Line, 2)
             
             // Draw text labels
             probUp=myProbUp*100
             ProbDown=myProbDown * 100
             DRAWTEXT("#probUp# %", barindex + 1, hiLevel, Dialog, Standard, 10) ANCHOR(TOPLEFT, INDEX, VALUE) COLOURED("green")
             DRAWTEXT("#ProbDown# %", barindex + 1, loLevel, Dialog, Standard, 10) ANCHOR(TOPLEFT, INDEX, VALUE) COLOURED("red")
             
          ELSE // If not shown, clear levels arrays
             $hiLevels[i] = UNDEFINED
             $loLevels[i] = UNDEFINED
          ENDIF
          
       NEXT
    endif
    //-------------------------------------------------------------
    RETURN
    
Viewing 2 posts - 1 through 2 (of 2 total)
  • You must be logged in to reply to this topic.
ProRealAI ProRealAI New

Stuck on this ProBuilder code?

Describe what this topic is trying to build, in plain English, and ProRealAI writes the ProRealTime™ indicator, screener or system for you.

Available in 7 languages
Try ProRealAI

Indicateur “Breakout Probability” TV à Traduire


ProBuilder : Indicateurs & Outils Personnalisés

New Reply
Author
author-avatar
paulPRT @paulprt Participant
Summary

This topic contains 1 reply,
has 2 voices, and was last updated by Iván GonzálezIván González
1 year ago.

Topic Details
Forum: ProBuilder : Indicateurs & Outils Personnalisés
Language: French
Started: 09/08/2025
Status: Active
Attachments: 1 files
ProRealCode ProRealCode
Loading...