How to add value to chart, but just for current candle

Viewing 4 posts - 1 through 4 (of 4 total)
  • Author
    Posts
  • #181452 quote
    RubberToeRubberToe
    Participant
    Average

    I want to be able to see the current value for the SD slope on my chart. This is the code I am starting with, but it gives me values on top of every bar, and I would prefer just the last one.

    timeframe(1mn)
    
    il = ((LinearRegressionSlope[120](close))/close)*10000 //
    
    DRAWTEXT("#il#", barindex, high+.2, Dialog, Standard, 12) COLOURED(255,0,10)
    
    RETURN
    #181455 quote
    robertogozzirobertogozzi
    Moderator
    Legend

    Try replacing high+.2 with:

    high+.2*pipsize
    RubberToe thanked this post
    #181507 quote
    RubberToeRubberToe
    Participant
    Average

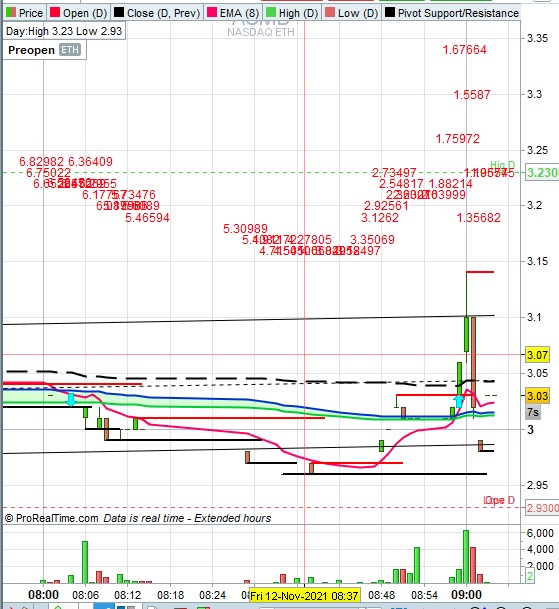
    That helps in one regard but I would like to just have the value over the last candle, not all of them.

    Screenshot-2021-11-12-090604.jpg Screenshot-2021-11-12-090604.jpg
    #181511 quote
    robertogozzirobertogozzi
    Moderator
    Legend

    Simply add this as first line:

    Defparam DrawOnLastBarOnly = true
    RubberToe thanked this post
Viewing 4 posts - 1 through 4 (of 4 total)
  • You must be logged in to reply to this topic.

ProRealAI ProRealAI New

Stuck on this ProBuilder code?

Describe what this topic is trying to build, in plain English, and ProRealAI writes the ProRealTime™ indicator, screener or system for you.

Available in 7 languages
Try ProRealAI

How to add value to chart, but just for current candle


ProBuilder: Indicators & Custom Tools

New Reply
Author
author-avatar
RubberToe @rubbertoe Participant
Summary

This topic contains 3 replies,
has 2 voices, and was last updated by robertogozzirobertogozzi
4 years, 10 months ago.

Topic Details
Forum: ProBuilder: Indicators & Custom Tools
Language: English
Started: 11/11/2021
Status: Active
Attachments: 1 files
ProRealCode ProRealCode
Loading...