Histogrammes down GREEDZONE

Viewing 9 posts - 1 through 9 (of 9 total)
  • Author
    Posts
  • #191821 quote
    supertitisupertiti
    Participant
    Master

    Bonjour à tous

    En reprenant le code de Swingfortune serait-il possible d’avoir l’inverse, c’est à dire des chandeliers qui annoncent un retournement à la baisse

    merci pour votre collaboration

    bon week end de Pâques


    // FEARZONE
     
    period = 30
    periodavstd = 100
     
    //First condition
    FZ1 = (highest[period](totalprice) - totalprice)/highest[period](totalprice)
    av1=average[periodAvStd](FZ1)
    stdv1= STD[periodAvStd](FZ1)
    FZ1Limit= av1+stdv1
     
    // Second condition
    FZ2 = average[period](totalprice)
    av2=average[periodAvStd](FZ2)
    stdv= STD[periodAvStd](FZ2)
    FZ2Limit= av2-stdv
     
    //In Fearzone?
    if FZ1 > FZ1Limit and FZ2 < FZ2Limit Then
     drawcandle(low-range,low-range,low-2*range,low-2*range) coloured(255,255,255)
    endif
     
    return
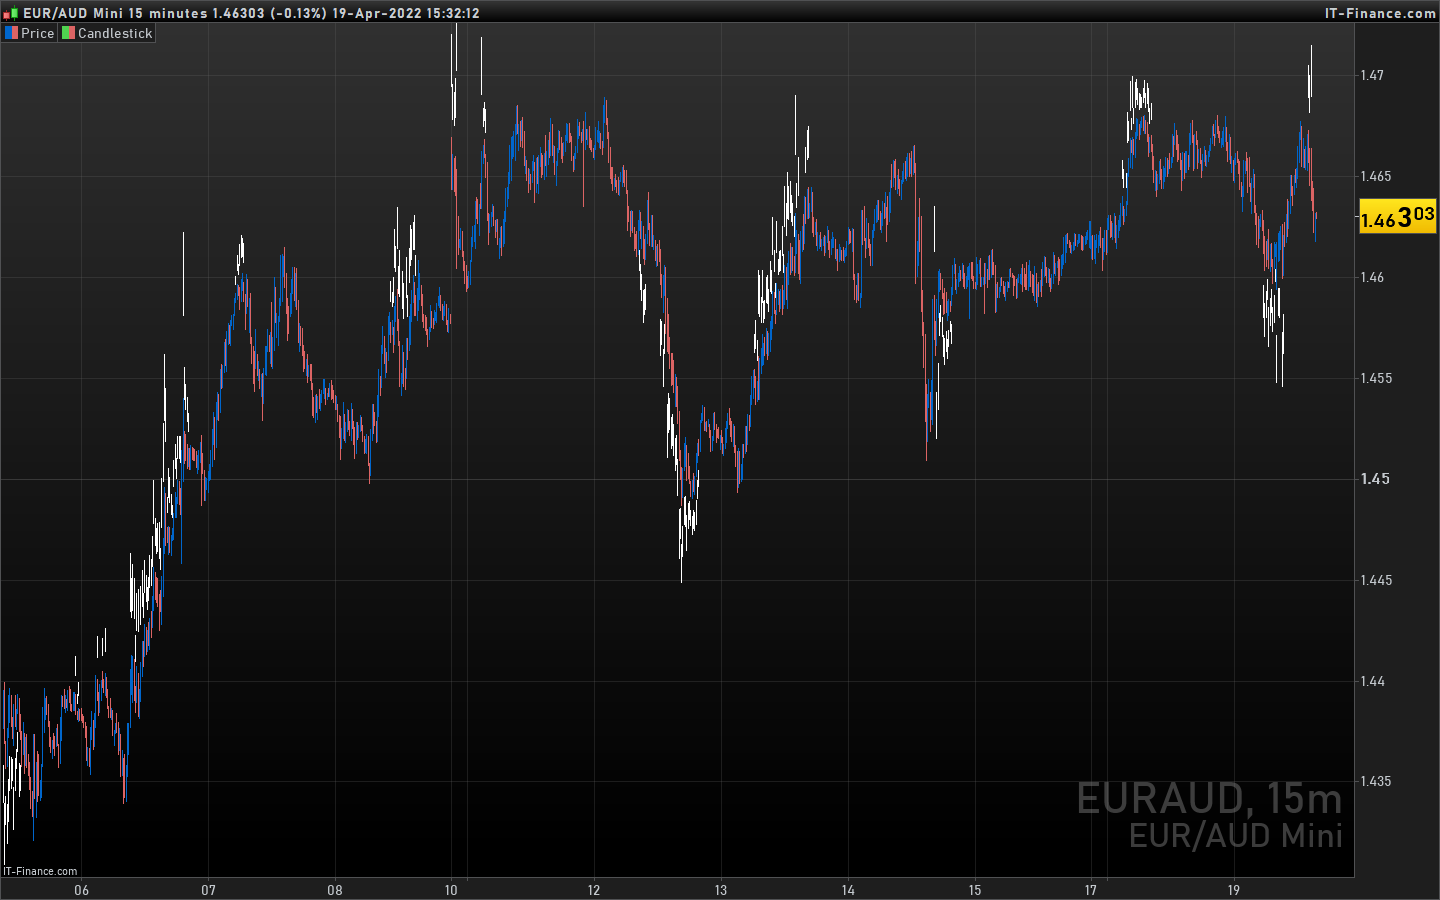
    Fearzone.jpg Fearzone.jpg
    #191888 quote
    NicolasNicolas
    Keymaster
    Legend

    La modification du code ci-dessous doit répondre à cette demande. Le “fearzone” trouve également les zones d’excès haussier et marque ainsi un probable retour à la baisse.

    // FEARZONE
     
    period = 30
    periodavstd = 100
     
    //First condition
    FZ1 = (highest[period](totalprice) - totalprice)/highest[period](totalprice)
    av1=average[periodAvStd](FZ1)
    stdv1= STD[periodAvStd](FZ1)
    FZ1Limit= av1+stdv1
    
    FZ0 = (totalprice - lowest[period](totalprice))/lowest[period](totalprice)
    av0=average[periodAvStd](FZ0)
    stdv0= STD[periodAvStd](FZ0)
    FZ0Limit= av0+stdv0
     
    // Second condition
    FZ2 = average[period](totalprice)
    av2=average[periodAvStd](FZ2)
    stdv= STD[periodAvStd](FZ2)
    FZ2Limit= av2-stdv
     
    //In Fearzone?
    if FZ1 > FZ1Limit and FZ2 < FZ2Limit Then
    drawcandle(low-range,low-range,low-2*range,low-2*range) coloured(255,255,255)
    endif
    
    if FZ0>fz0LIMIT AND FZ2 > FZ2Limit Then
    drawcandle(HIGH+range,HIGH+range,HIGH+2*range,HIGH+2*range) coloured(255,255,255)
    endif
     
    return //fz2,fz2limit
    fearzone-up-and-down.png fearzone-up-and-down.png
    #191913 quote
    supertitisupertiti
    Participant
    Master

    Bonsoir à tous,

    Un grand merci Nicolas pour ta bienveillance , j’installe ce code dans l’immédiat, cela me fait mes Pâques !

    Bons trades

    Je joins une photo de mon village Andalou et de ses traditions

    Nicolas thanked this post
    Paques-.jpg Paques-.jpg
    #191945 quote
    supertitisupertiti
    Participant
    Master

    Bonjour Nicolas,


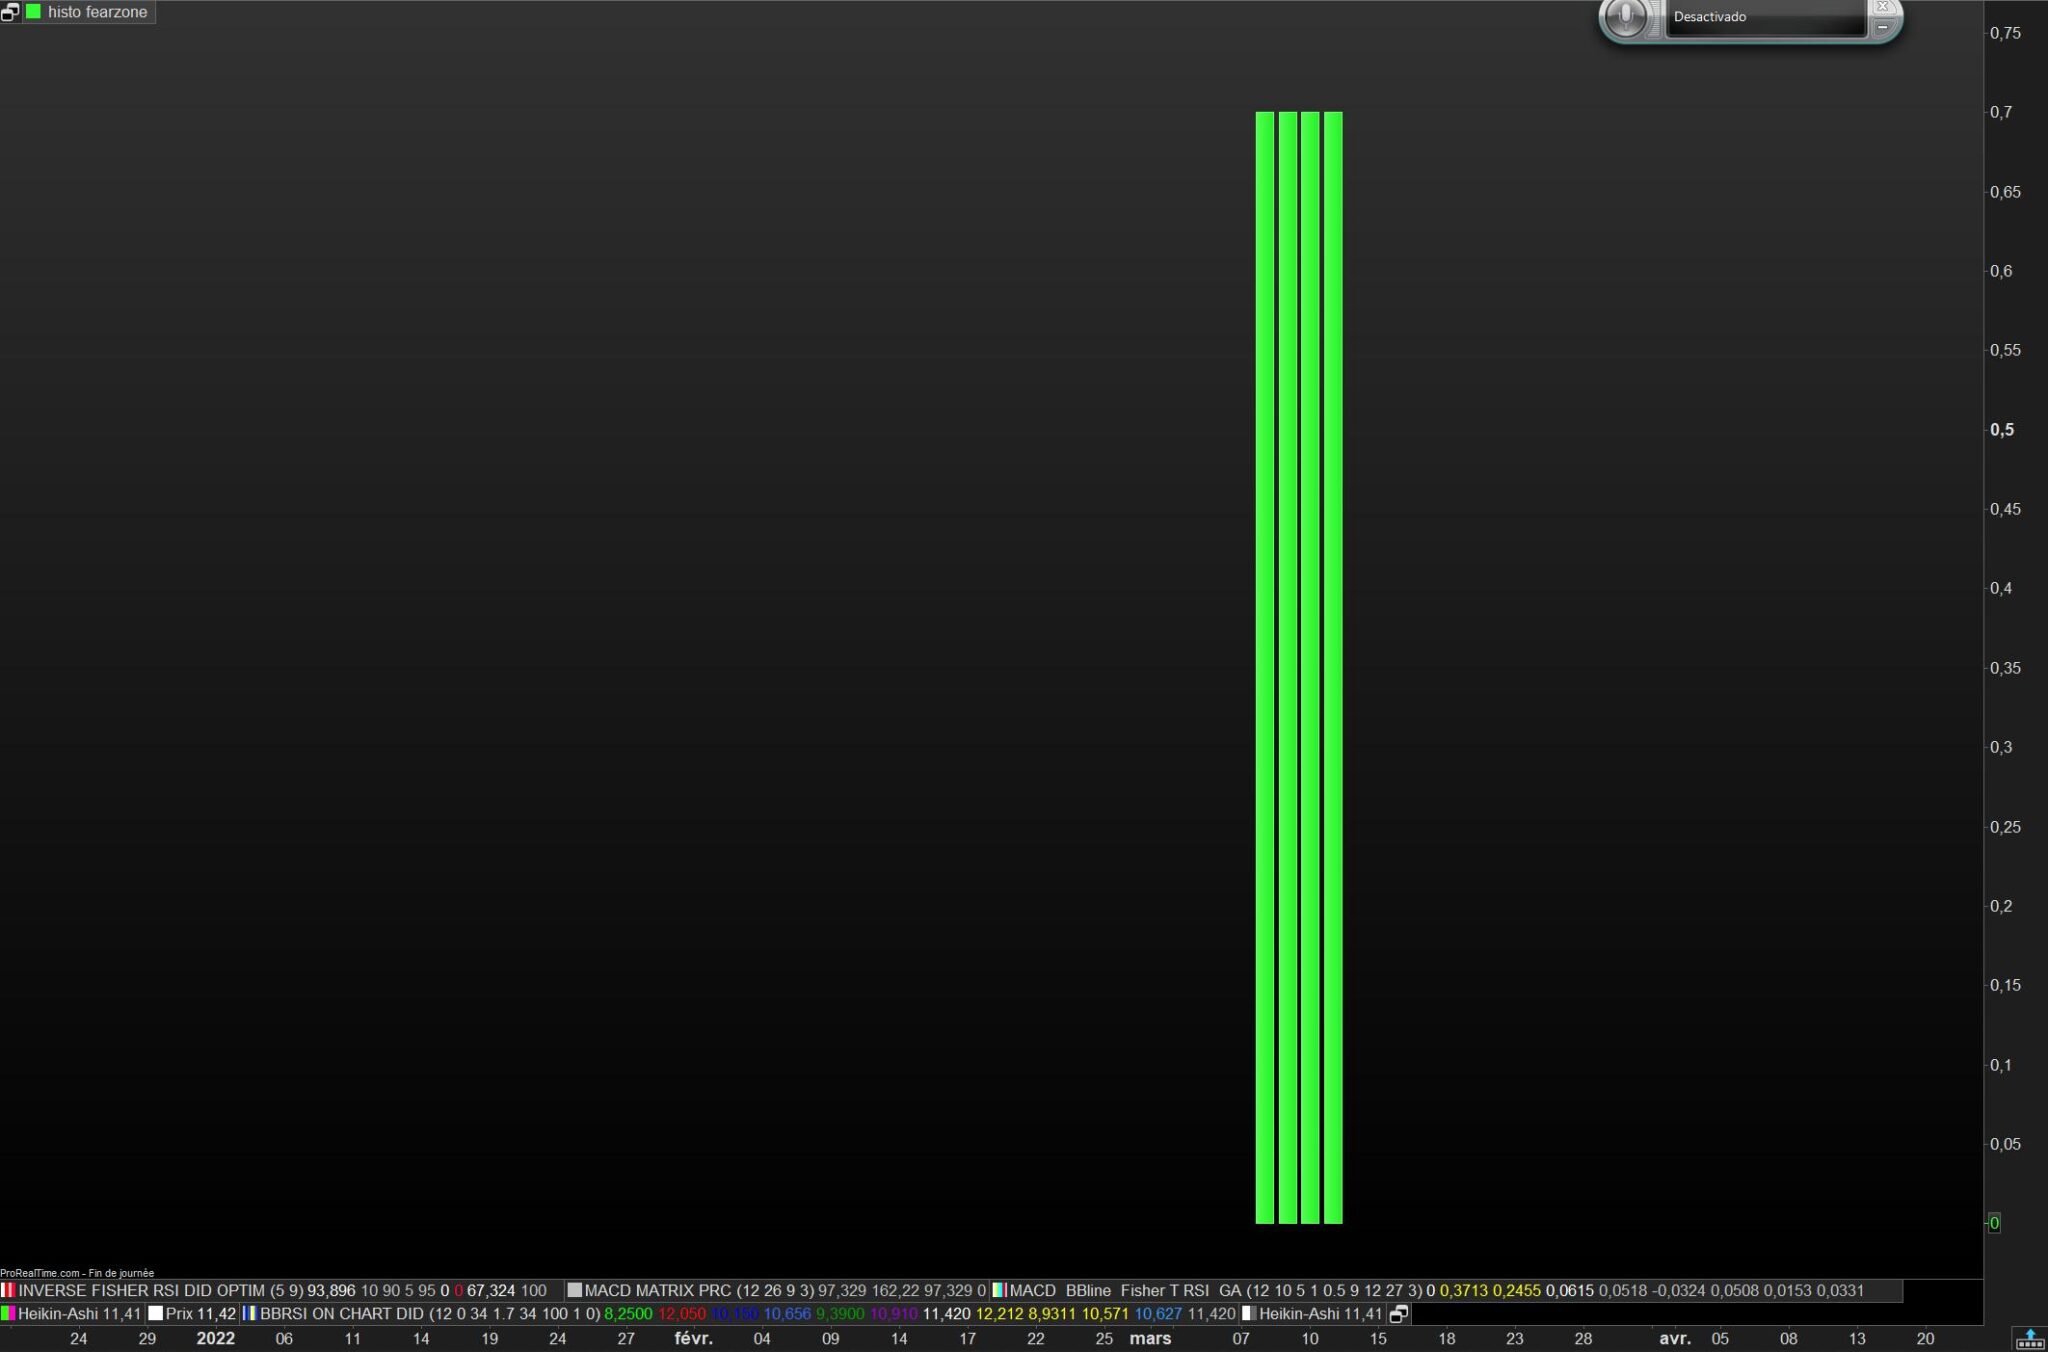
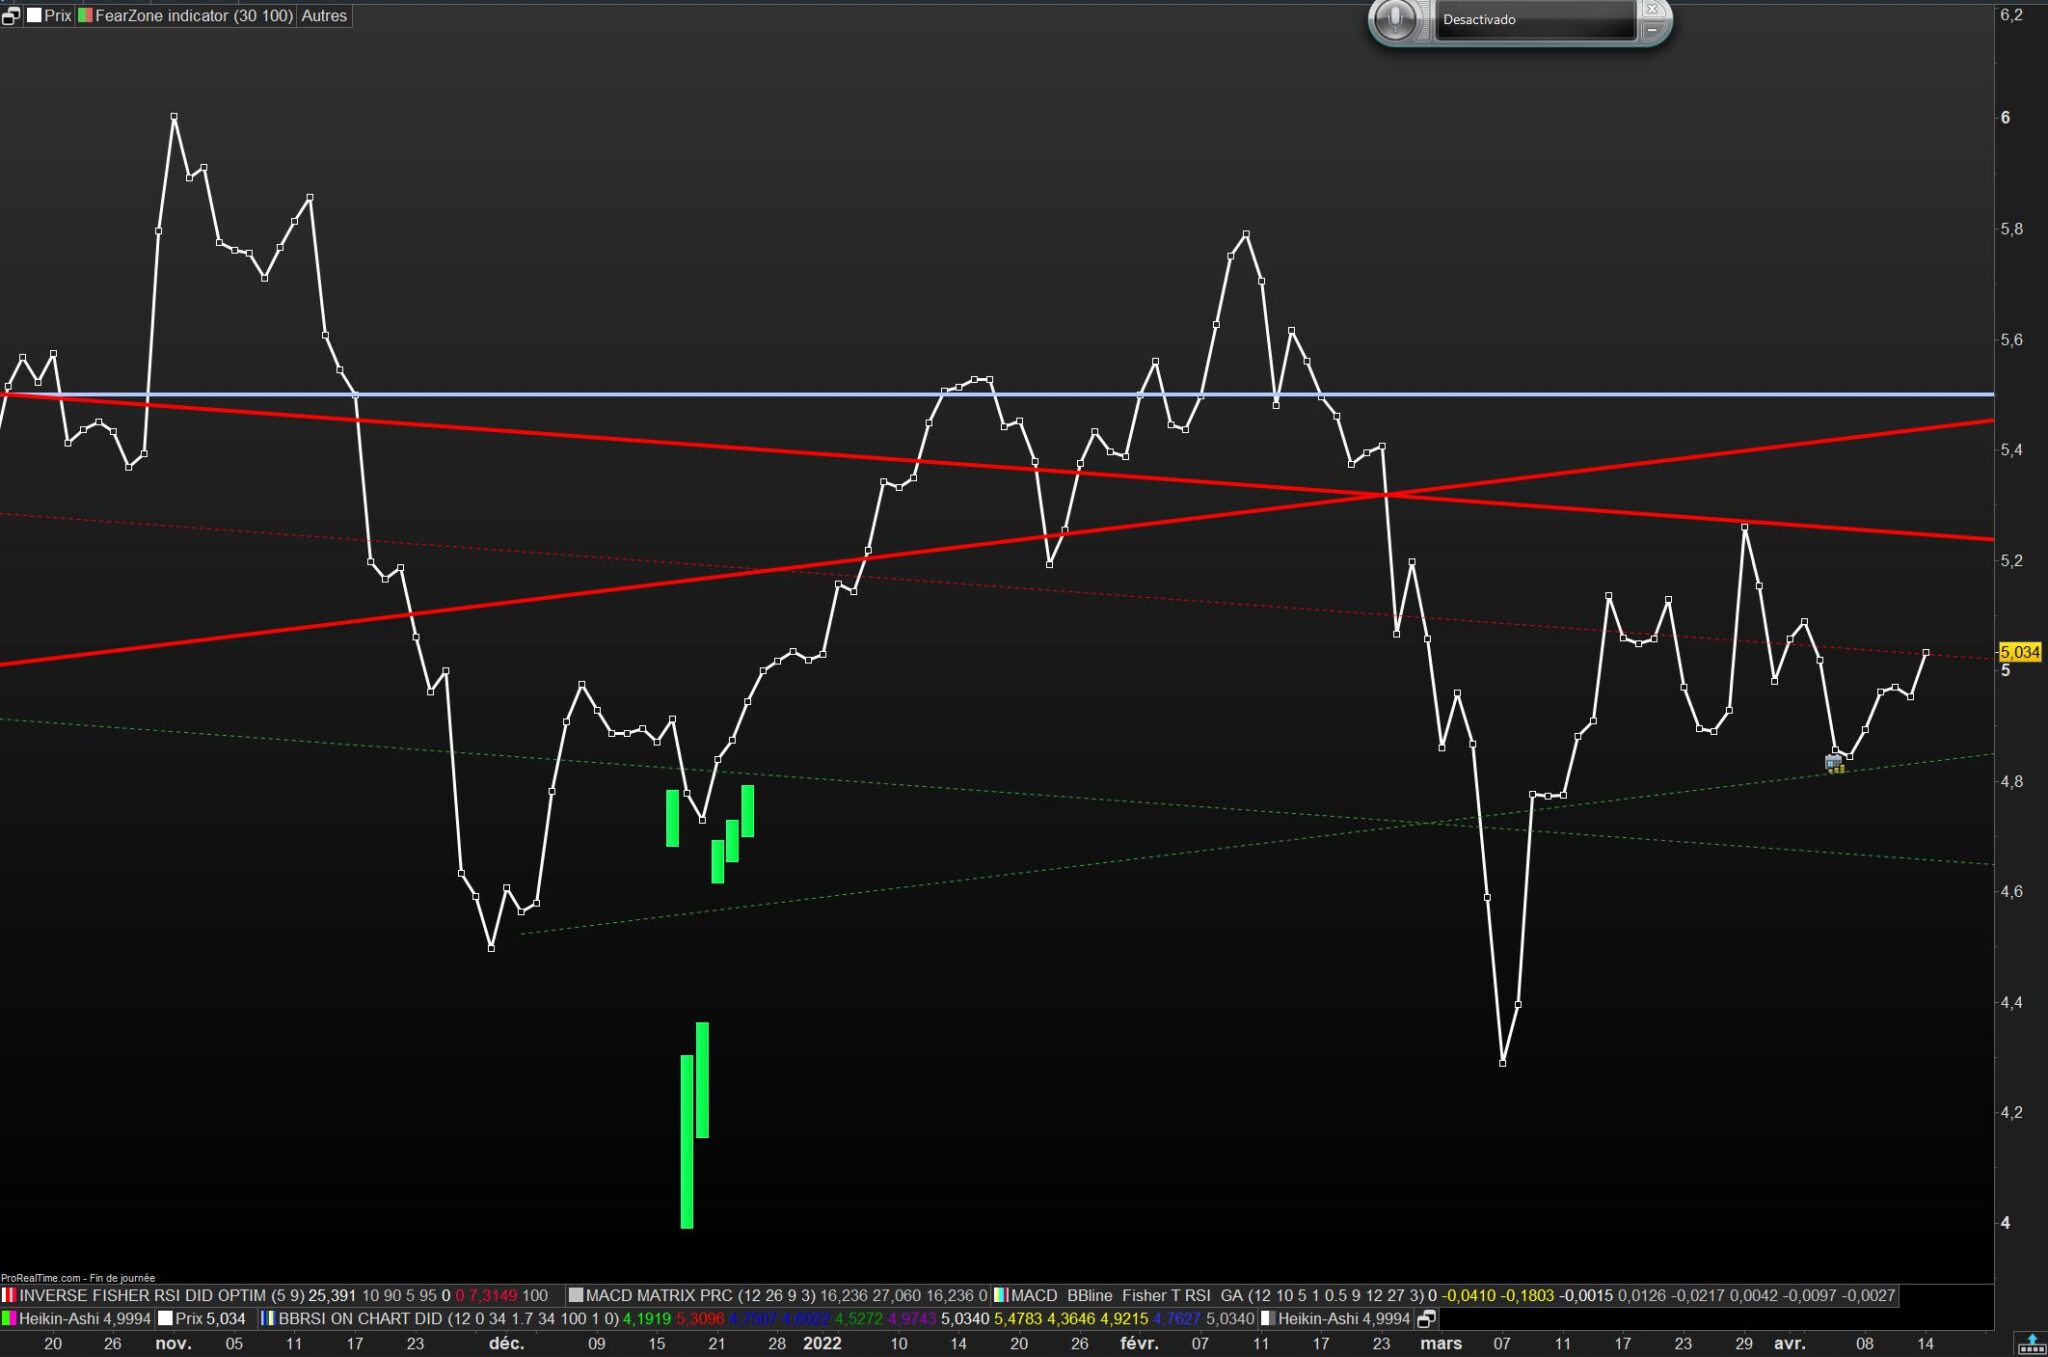
    Sur le code Fearzone Up j’avais réussi à convertir le code sur une base de zero avec des histogrammes à 0.7.

    Bon là je pateauge , serait-il possible de faire la même chose avec le fearzone down ?

    merci

    HISTO-0.jpg HISTO-0.jpg
    #191965 quote
    supertitisupertiti
    Participant
    Master

    ¡ J’y suis arrivé tout seul comme un grand !

    // HISTO FEARZONE UP and DOWN by Nicolas 19 avril 2022
    
    period = 30  
    periodavstd = 100 
    
    //First condition
    FZ1 = (highest[period](totalprice) - totalprice)/highest[period](totalprice)
    av1=average[periodAvStd](FZ1)
    stdv1= STD[periodAvStd](FZ1)
    FZ1Limit= av1+stdv1
     
    FZ0 = (totalprice - lowest[period](totalprice))/lowest[period](totalprice)
    av0=average[periodAvStd](FZ0)
    stdv0= STD[periodAvStd](FZ0)
    FZ0Limit= av0+stdv0
    // Second condition
    FZ2 = average[period](totalprice)
    av2=average[periodAvStd](FZ2)
    stdv= STD[periodAvStd](FZ2)
    FZ2Limit= av2-stdv
    //////////////////////////////////////////////////////
    //In Fearzone?
    if FZ1 > FZ1Limit and FZ2 < FZ2Limit Then
    //drawcandle(low-range,low-range,low-2*range,low-2*range) coloured (0,255,8)//Vert clair
    histoUP = 0.7
    else
    histoUP = 0
    endif
     
    if FZ0>fz0LIMIT AND FZ2 > FZ2Limit Then
    //drawcandle(HIGH+range,HIGH+range,HIGH+2*range,HIGH+2*range) coloured(255,0,247)// Rose
    histoDW = 0.7
    else
    histoDW = 0
    endif
    
    return  histoUP coloured (0,255,8) , histoDW coloured (255,0,247) //fz2 ,fz2limit
    
    #191966 quote
    supertitisupertiti
    Participant
    Master

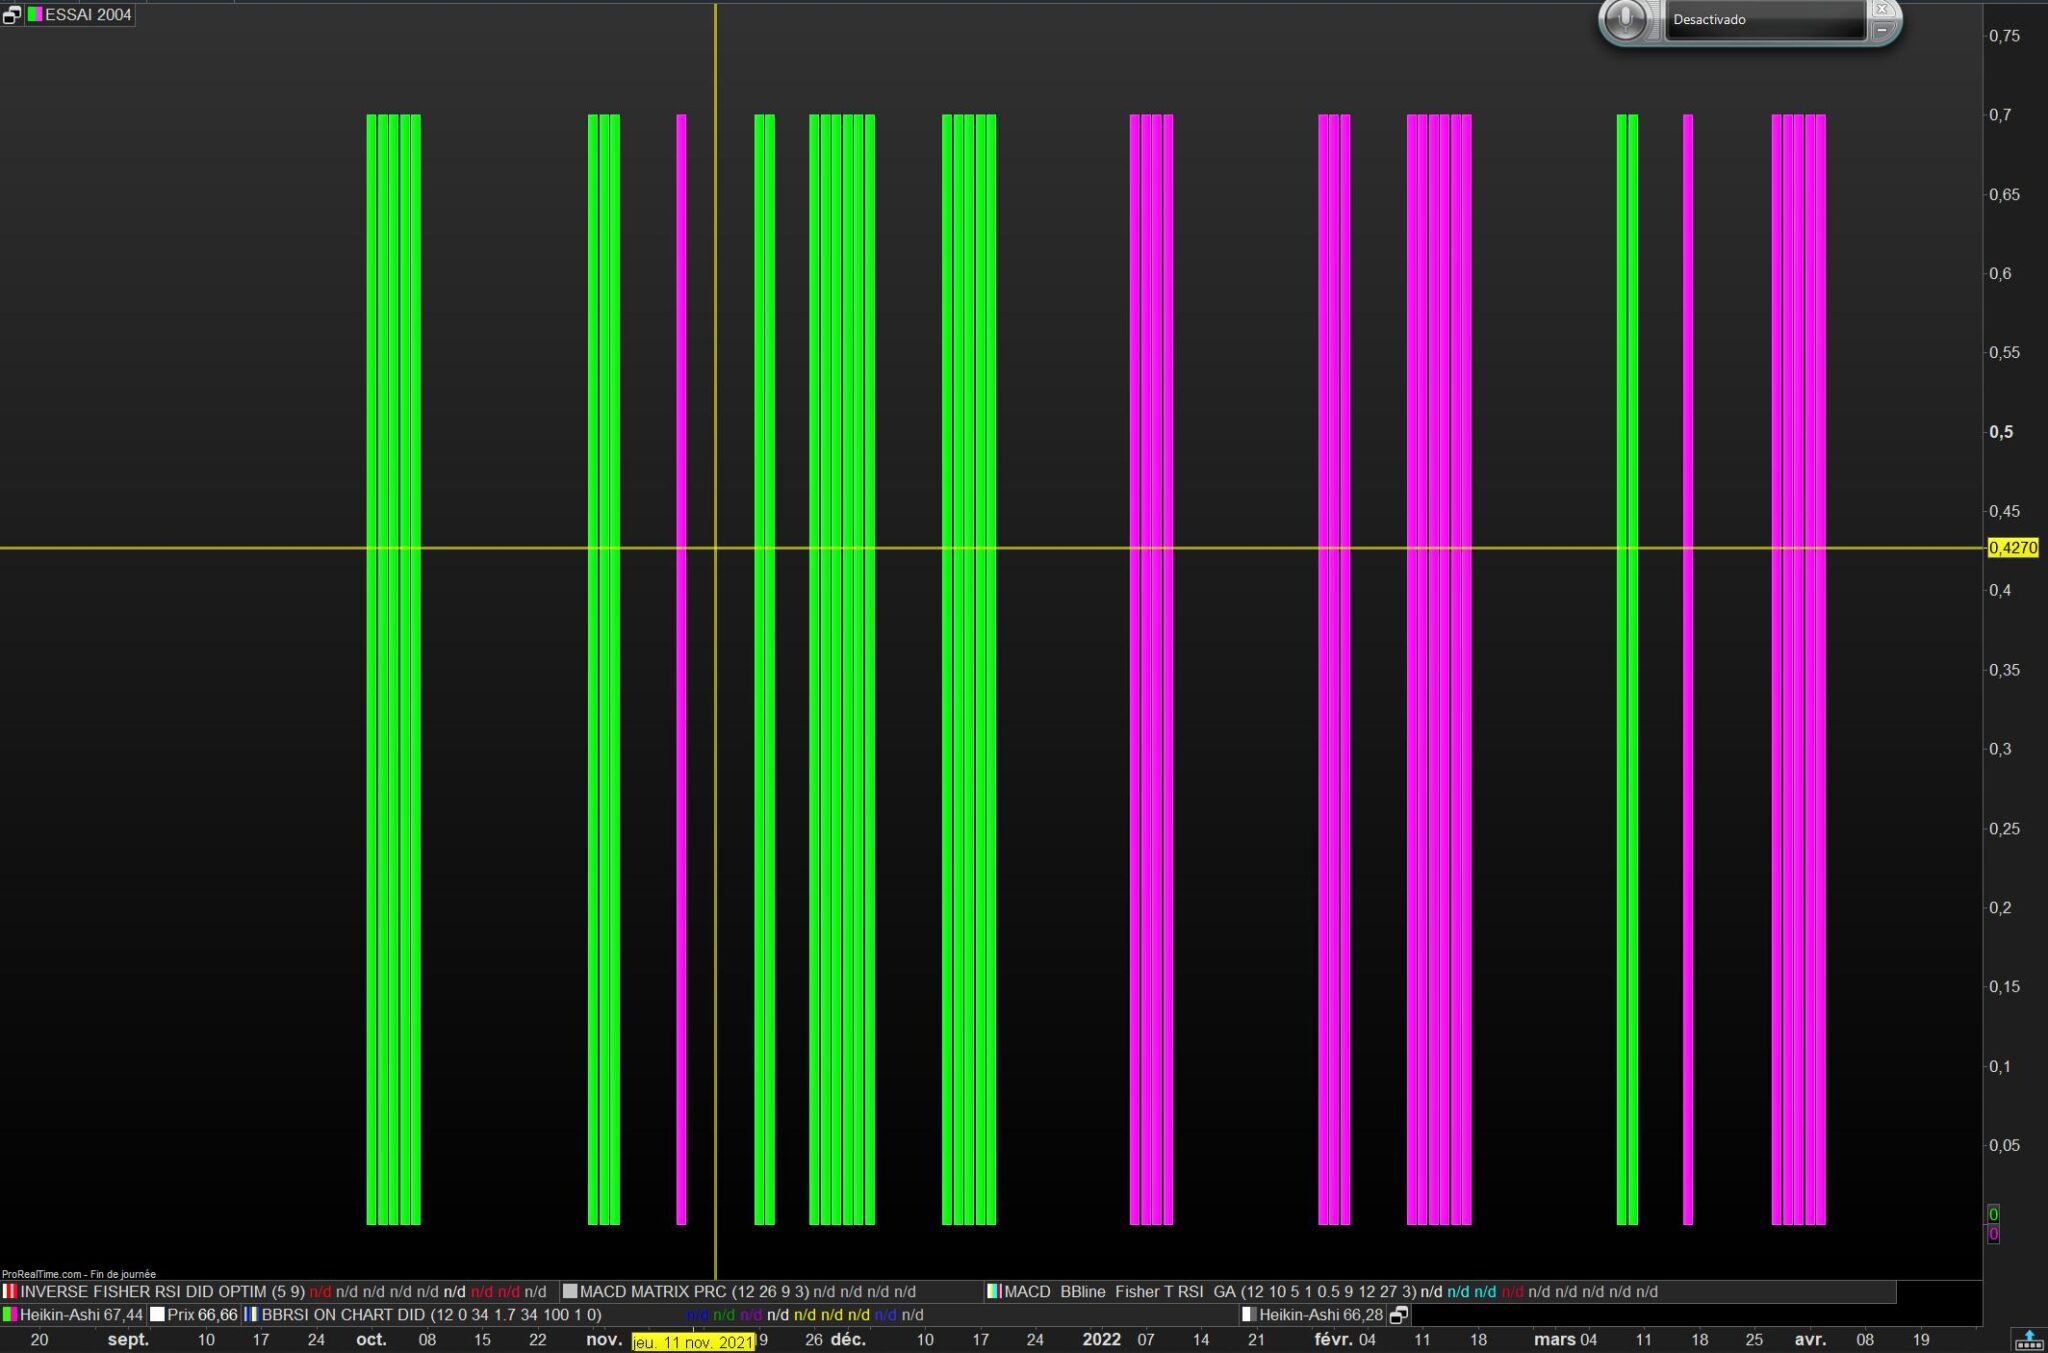
    histo graphe

    Histo-FZ.jpg Histo-FZ.jpg
    #191983 quote
    supertitisupertiti
    Participant
    Master

    Bonsoir à tous,

    Sur les chandeliers on peut ajouter une bordure, peux-t’on faire la même chose avec des histogrammes ?

    merci pour vos retours

    #192013 quote
    NicolasNicolas
    Keymaster
    Legend

    Non, mais tu pourrais les remplacer par des rectangles, mais le soucis c’est que pour tracer un rectangle il faut à minima 3 périodes, donc ça décalerait l’information, vraiment pas simple/rapide à coder en plus pour juste un effet visuel 🙂

    #192019 quote
    supertitisupertiti
    Participant
    Master

    Merci Nicolas


    Bonne journèe

Viewing 9 posts - 1 through 9 (of 9 total)

  • You must be logged in to reply to this topic.

ProRealAI ProRealAI New

Stuck on this ProBuilder code?

Describe what this topic is trying to build, in plain English, and ProRealAI writes the ProRealTime™ indicator, screener or system for you.

Available in 7 languages
Try ProRealAI

Histogrammes down GREEDZONE


ProBuilder : Indicateurs & Outils Personnalisés

New Reply
Author
author-avatar
supertiti @supertiti Participant
Summary

This topic contains 8 replies,
has 2 voices, and was last updated by supertitisupertiti
4 years, 5 months ago.

Topic Details
Forum: ProBuilder : Indicateurs & Outils Personnalisés
Language: French
Started: 04/16/2022
Status: Active
Attachments: 5 files
ProRealCode ProRealCode
Loading...