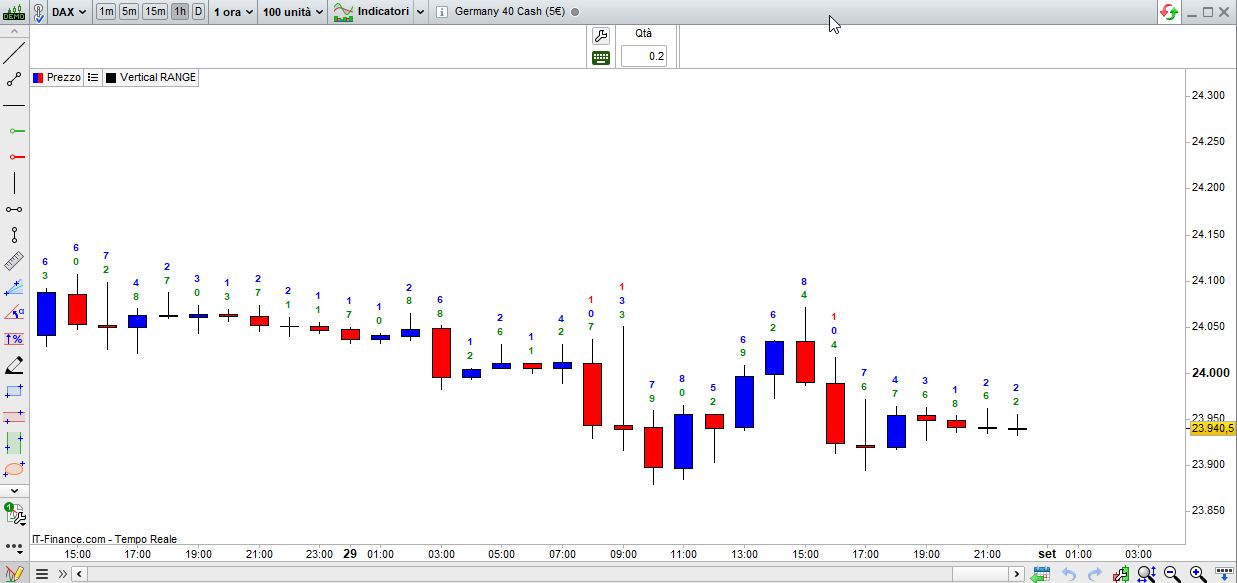
High-low difference displayed above candle

Viewing 5 posts - 1 through 5 (of 5 total)

  • Author
    Posts
  • #250218 quote
    segie
    Participant
    Senior

    Hi,

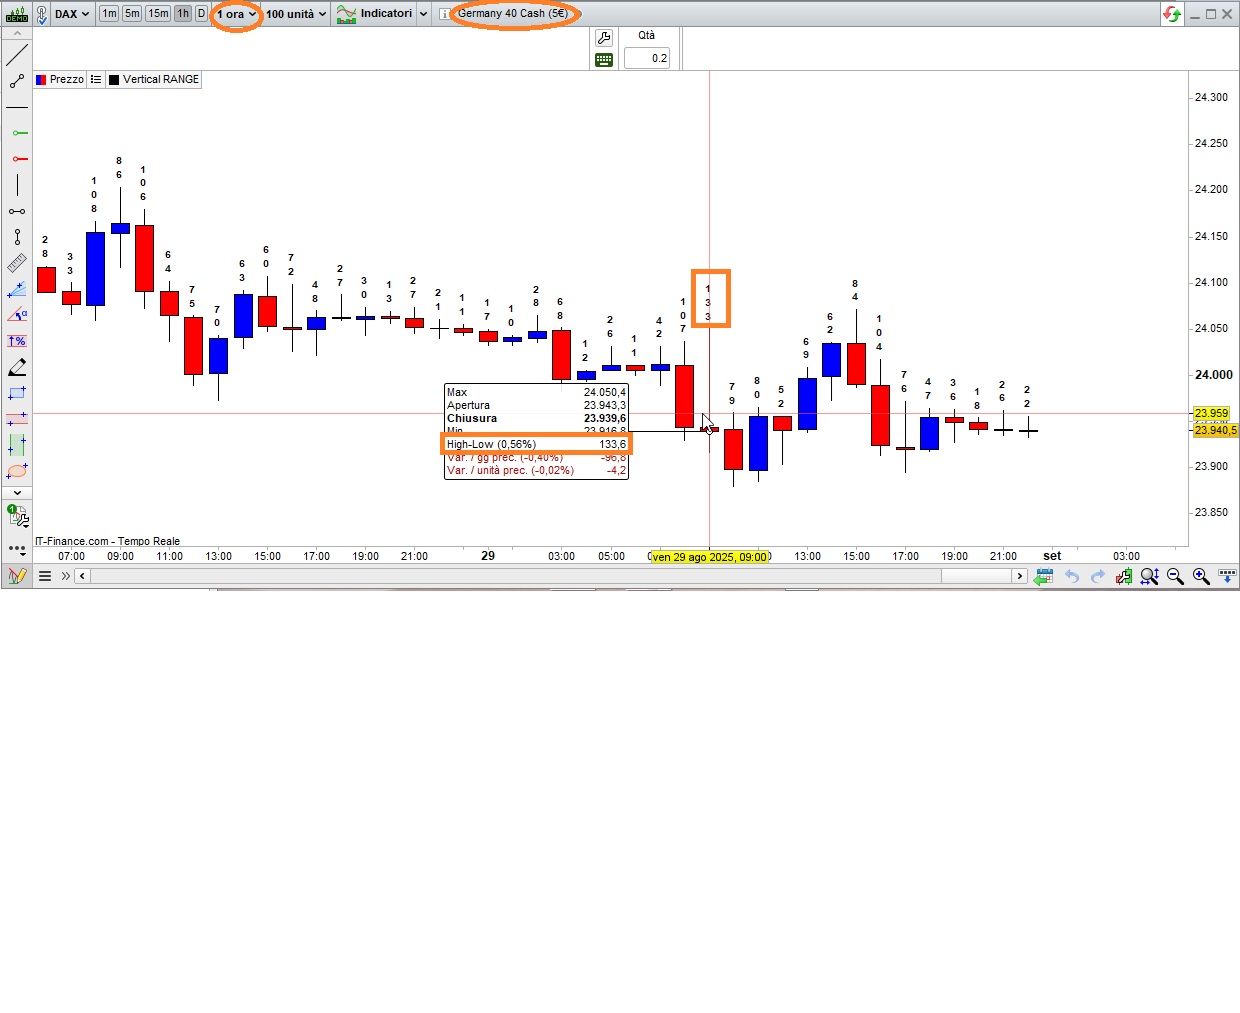
    Please help with an indicator showing the High-low difference value displayed just above the relevant candle.

    Shown vertically not horizontally.

    Text size to be the with of the candle. Trying to prevent lapping of text

    Regards,
    Segie

    #250220 quote
    robertogozzi
    Moderator
    Legend

    There you go:

    //DEFPARAM DrawOnLastBarOnly = true
    thisRANGE = range / PipSize
    Offset    = 40*PipSize
    range1    = floor(thisRANGE / 1000,0)
    thisRANGE = thisRANGE mod 1000
    range2    = floor(thisRANGE / 100,0)
    thisRANGE = thisRANGE mod 100
    range3    = floor(thisRANGE / 10,0)
    range4    = thisRANGE mod 10
    IF range1 > 0 THEN
       DrawText("#range1#",BarIndex,high + Offset*2.0,dialog,bold,10)
    ENDIF
    IF range2 > 0 OR (range2 = 0 and range1 > 0) THEN
       DrawText("#range2#",BarIndex,high + Offset*1.5,dialog,bold,10)
    ENDIF
    IF range3 > 0 OR (range3 = 0 and (range2 + range1 > 0)) THEN
       DrawText("#range3#",BarIndex,high + Offset*1.0,dialog,bold,10)
    ENDIF
    DrawText("#range4#",BarIndex,high + Offset*0.5,dialog,bold,10)
    RETURN

    this will plot the range (high – low) with NO decimal point, above each candle. To plot it only on the last candle, uncomment line 1.

    Line 3 is the value to space the lines from each orther, this is for DAXm, 1-hour TF; on DAX, Daily TF, 100 seems more appropriate. So you will have to adjust it yourself.

    segie thanked this post
    DrawRange.jpg DrawRange.jpg
    #250222 quote
    robertogozzi
    Moderator
    Legend

    With this version you can easily change the character size (default is 10) and the colour for each digit (transparency included):

    //DEFPARAM DrawOnLastBarOnly = true
    CharSize  = 10   // size of characters (digits)
    t         = 255  // Transparency (or Alpha)
    thisRANGE = range / PipSize
    Offset    = 30*PipSize
    range1    = floor(thisRANGE / 1000,0)
    thisRANGE = thisRANGE mod 1000
    range2    = floor(thisRANGE / 100,0)
    thisRANGE = thisRANGE mod 100
    range3    = floor(thisRANGE / 10,0)
    range4    = thisRANGE mod 10
    IF range1 > 0 THEN
       DrawText("#range1#",BarIndex,high + Offset*2.0,dialog,bold,CharSize) coloured("Black",t)
    ENDIF
    IF range2 > 0 OR (range2 = 0 and range1 > 0) THEN
       DrawText("#range2#",BarIndex,high + Offset*1.5,dialog,bold,CharSize) coloured("Red",t)
    ENDIF
    IF range3 > 0 OR (range3 = 0 and (range2 + range1 > 0)) THEN
       DrawText("#range3#",BarIndex,high + Offset*1.0,dialog,bold,CharSize) coloured("Blue",t)
    ENDIF
    DrawText("#range4#",BarIndex,high + Offset*0.5,dialog,bold,CharSize)    coloured("Green",t)
    RETURN
    Iván González and segie thanked this post
    Vertical-RANGE.txt Vertical-RANGE.itf DrawRange2.jpg DrawRange2.jpg
    #250287 quote
    segie
    Participant
    Senior

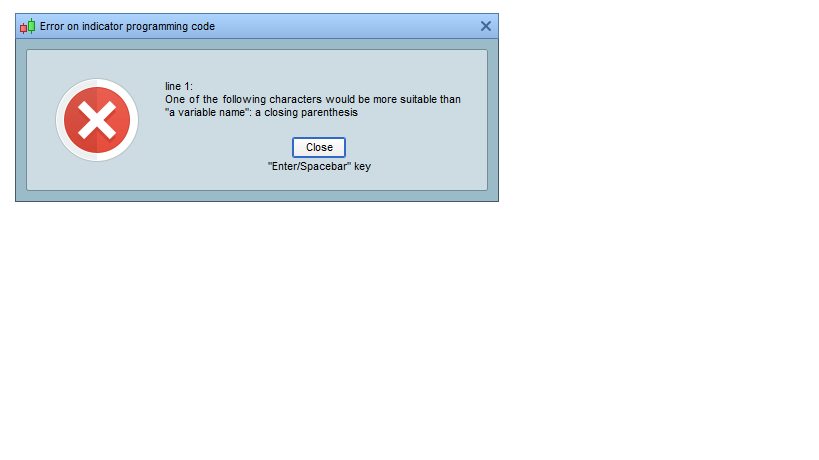
    Please see attached error

    Error.1.png Error.1.png
    #250306 quote
    robertogozzi
    Moderator
    Legend

    Import the ITF file (or try again doing Copy & Paste).

    segie thanked this post
Viewing 5 posts - 1 through 5 (of 5 total)
  • You must be logged in to reply to this topic.

ProRealAI ProRealAI New

Stuck on this ProBuilder code?

Describe what this topic is trying to build, in plain English, and ProRealAI writes the ProRealTime™ indicator, screener or system for you.

Available in 7 languages
Try ProRealAI

High-low difference displayed above candle


ProBuilder: Indicators & Custom Tools

New Reply
Author
author-avatar
segie @segie Participant
Summary

This topic contains 4 replies,
has 2 voices, and was last updated by robertogozzi
1 year ago.

Topic Details
Forum: ProBuilder: Indicators & Custom Tools
Language: English
Started: 08/31/2025
Status: Active
Attachments: 5 files
Logo Logo
Loading...