High / low / close – Yesterday, Premarket

Viewing 7 posts - 1 through 7 (of 7 total)

  • Author
    Posts
  • #201099 quote
    memoselamemosela
    Participant
    New

    Hello,
    I would like to have an indicator that shows me the high / low / close / of the previous day and that shows me the premarket high / low from 4:00 to 9:30 EST. NY
    With horizontal lines.

    Thanks for your help

    #201118 quote
    denmardenmar
    Participant
    Veteran

    This thread should help to get you going – does not include premarket window. you will have to adjust the times for your region.

    Plot Yesterday’s High, Low and Close

    #201163 quote
    robertogozzirobertogozzi
    Moderator
    Legend

    There you go:

    DEFPARAM DrawOnLastBarOnly = true
    ONCE PrevHH = high
    ONCE PrevLL = low
    ONCE PrecCL = close
    ONCE HH     = high
    ONCE LL     = low
    ONCE CL     = close
    ONCE pmHH   = high
    ONCE pmLL   = low
    If OpenTime = 000000 OR (OpenTime >= 000000 AND OpenTime < OpenTime[1])THEN
       PrevHH = HH
       PrevLL = LL
       PrevCL = close[1]
       LL     = low
       HH     = high
       CL     = close
       BarID  = BarIndex
    ENDIF
    If OpenTime = 040000 OR (OpenTime >= 040000 AND OpenTime < OpenTime[1])THEN
       pmLL   = low
       pmHH   = high
       pmBarID= BarIndex
    ENDIF
    IF (OpenTime >= 040000) AND (OpenTime <= 093000) THEN
       pmLL   = min(pmLL,low)
       pmHH   = max(pmHH,high)
    ENDIF
    HH = max(HH,high)
    LL = min(LL,low)
    CL = close
    //
    DrawSegment(BarID,PrevHH,BarIndex,PrevHH) coloured(0,128,0,155)   style(line,2)       //Green
    DrawSegment(BarID,PrevLL,BarIndex,PrevLL) coloured(0,0,255,255)   style(line,2)       //Blue
    DrawSegment(BarID,PrevCL,BarIndex,PrevCL) coloured(255,0,0,255)   style(line,2)       //Red
    //
    DrawSegment(pmBarID,pmHH,BarIndex,pmHH)   coloured(0,178,238,255) style(dottedline,3) //Cyan
    DrawSegment(pmBarID,pmLL,BarIndex,pmLL)   coloured(0,178,238,255) style(dottedline,3) //Cyan
    RETURN

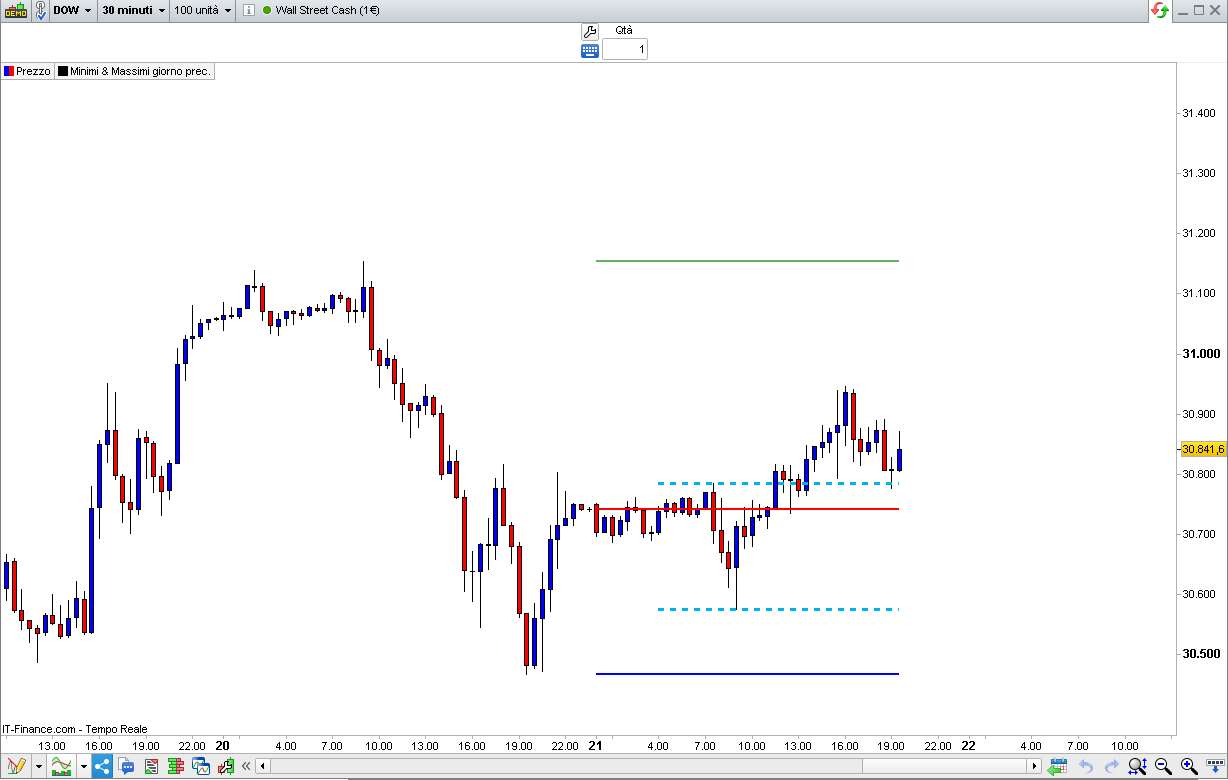
    premarket data are plotted using cyan dotted bolder lines.

    PLermite thanked this post
    x-3.jpg x-3.jpg
    #201170 quote
    memoselamemosela
    Participant
    New

    Thank you very much, how can I make a change so that the measurement of the previous day is only between 9:00 and 16:00?

    #201209 quote
    robertogozzirobertogozzi
    Moderator
    Legend

    Replace 040000 with 090000 and 093000 with 160000.

    memosela thanked this post
    #201246 quote
    memoselamemosela
    Participant
    New

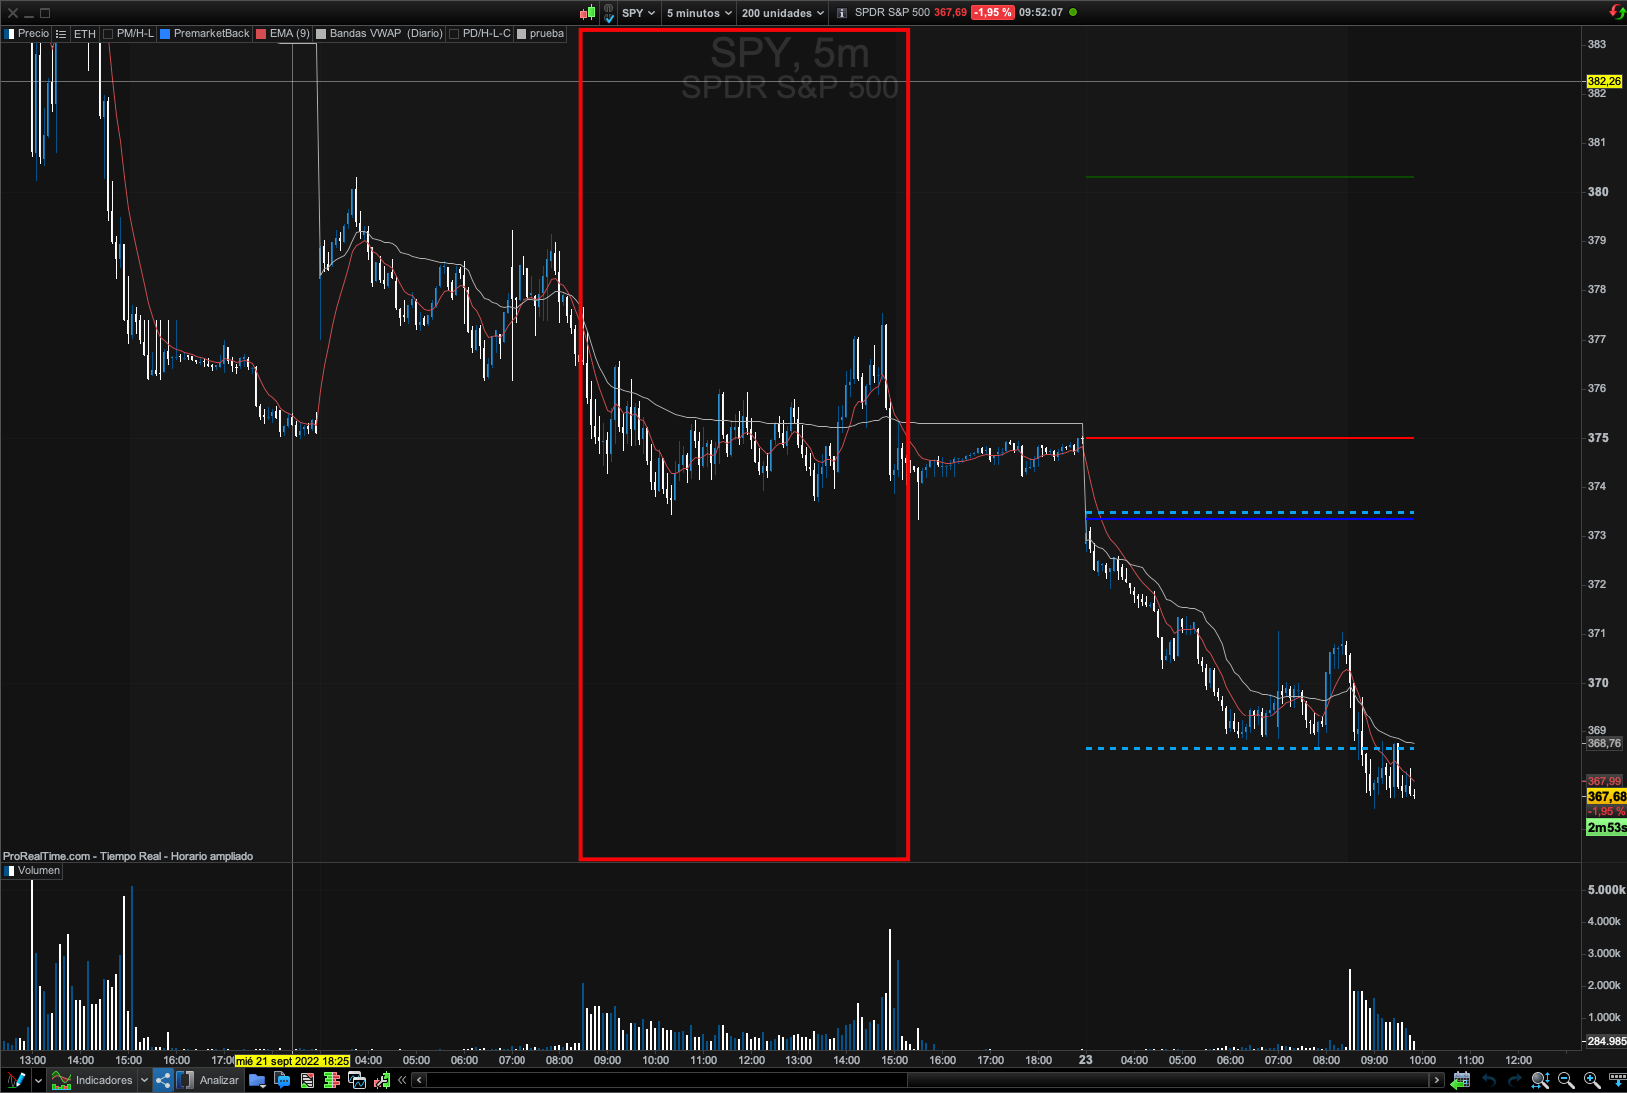
    The Premarket Lines, works great, but for the Previous Day I only want to take the time for the previous day between 8:30 to 15:00.

    ¿How can i change this?

    Thanks.

    Screenshot-at-Sep-23-09-52-39.png Screenshot-at-Sep-23-09-52-39.png
    #201796 quote
    robertogozzirobertogozzi
    Moderator
    Legend

    There you go:

    DEFPARAM DrawOnLastBarOnly = true
    ONCE PrevHH = high
    ONCE PrevLL = low
    ONCE PrecCL = close
    ONCE HH     = high
    ONCE LL     = low
    ONCE CL     = close
    ONCE pmHH   = high
    ONCE pmLL   = low
    If OpenTime = 083000 OR (OpenTime >= 083000 AND OpenTime < OpenTime[1])THEN
       PrevHH = HH
       PrevLL = LL
       PrevCL = CL//close[1]
       LL     = low
       HH     = high
       CL     = close
       BarID  = BarIndex
    ENDIF
    If OpenTime = 040000 OR (OpenTime >= 040000 AND OpenTime < OpenTime[1])THEN
       pmLL   = low
       pmHH   = high
       pmBarID= BarIndex
    ENDIF
    IF (OpenTime >= 040000) AND (OpenTime <= 093000) THEN
       pmLL   = min(pmLL,low)
       pmHH   = max(pmHH,high)
    ENDIF
    IF (OpenTime >= 083000) AND (OpenTime <= 150000) THEN
       HH = max(HH,high)
       LL = min(LL,low)
       CL = close
    ENDIF
    //
    DrawSegment(BarID,PrevHH,BarIndex,PrevHH) coloured(0,128,0,155)   style(line,2)       //Green
    DrawSegment(BarID,PrevLL,BarIndex,PrevLL) coloured(0,0,255,255)   style(line,2)       //Blue
    DrawSegment(BarID,PrevCL,BarIndex,PrevCL) coloured(255,0,0,255)   style(line,2)       //Red
    //
    DrawSegment(pmBarID,pmHH,BarIndex,pmHH)   coloured(0,178,238,255) style(dottedline,3) //Cyan
    DrawSegment(pmBarID,pmLL,BarIndex,pmLL)   coloured(0,178,238,255) style(dottedline,3) //Cyan
    RETURN
    memosela thanked this post
Viewing 7 posts - 1 through 7 (of 7 total)

  • You must be logged in to reply to this topic.

ProRealAI ProRealAI New

Stuck on this ProBuilder code?

Describe what this topic is trying to build, in plain English, and ProRealAI writes the ProRealTime™ indicator, screener or system for you.

Available in 7 languages
Try ProRealAI

High / low / close – Yesterday, Premarket


ProBuilder: Indicators & Custom Tools

New Reply
Author
author-avatar
memosela @memosela Participant
Summary

This topic contains 6 replies,
has 3 voices, and was last updated by robertogozzirobertogozzi
3 years, 11 months ago.

Topic Details
Forum: ProBuilder: Indicators & Custom Tools
Language: English
Started: 09/20/2022
Status: Active
Attachments: 2 files
ProRealCode ProRealCode
Loading...