Bonjour,
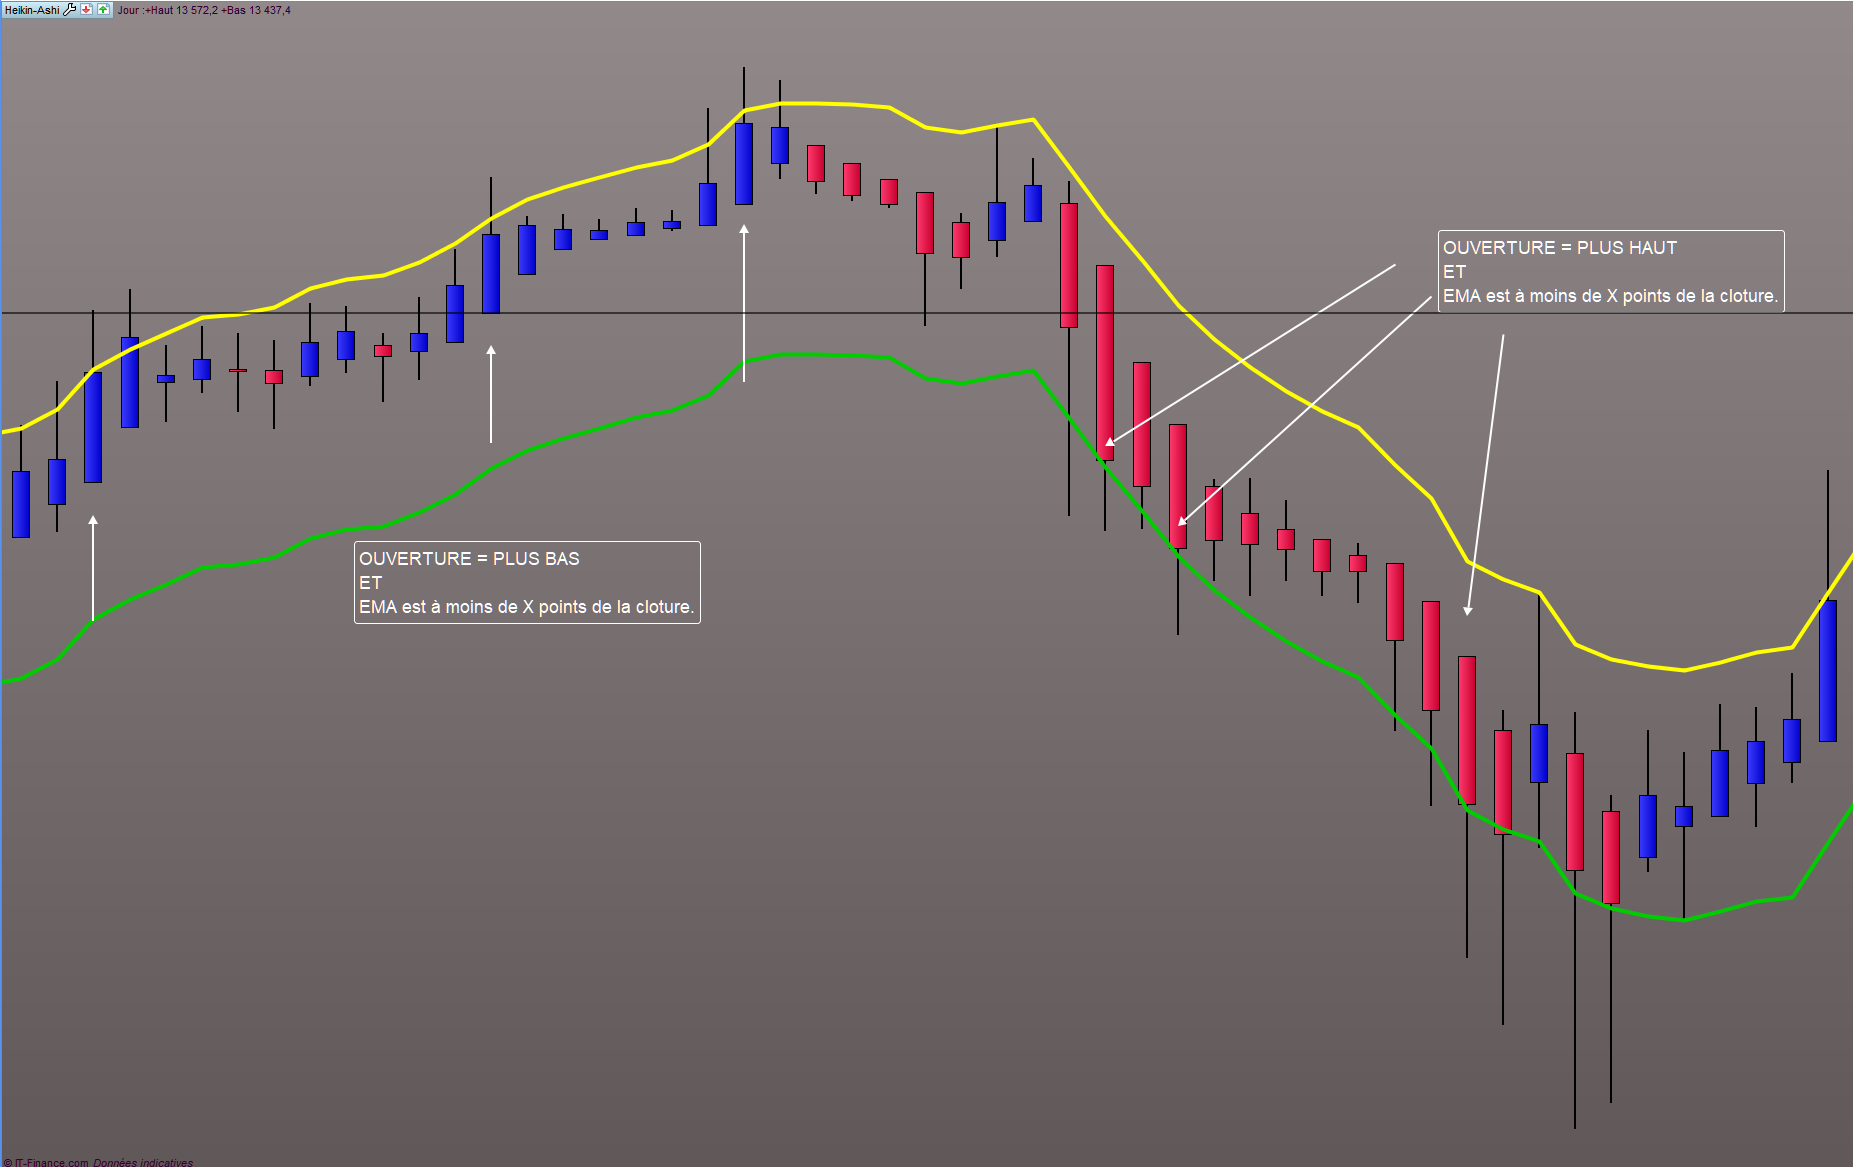
Je cherche (pour le moment sans succès) à obtenir sur un graphique en Heikin Ashi des flèches indiquant lorsque :
Le code de l’indicateur ci-dessous devrait fournir les signaux attendus. Bougie haussière ou baissière, dessus/dessous une moyenne mobile de X périodes et de type Y, avec clôture à moins de Z points.
period = 20
type = 1
distance = 10
// ----

xClose = (open+high+low+close)/4
IF BarIndex=0 THEN
xOpen = open
xHigh = high
xLow = low
ELSe
xOpen = (xOpen[1] + xClose[1])/2
xHigh = Max(Max(high, xOpen), xClose)
xLow = Min(Min(low, xOpen), xClose)
ENDIF

green = xclose>xopen
avg = average[period,type](customclose)

if green and xclose>avg and xclose-avg<distance*pointsize then
drawarrowup(barindex,xlow) coloured(0,200,0)
endif

if not green and xclose<avg and avg-xclose<distance*pointsize then
drawarrowdown(barindex,xhigh) coloured(200,0,0)
endif

return
Rapide comme l’éclair Nicolas Merci !
En revanche cela ne fonctionne pas totalement, bizarrement.
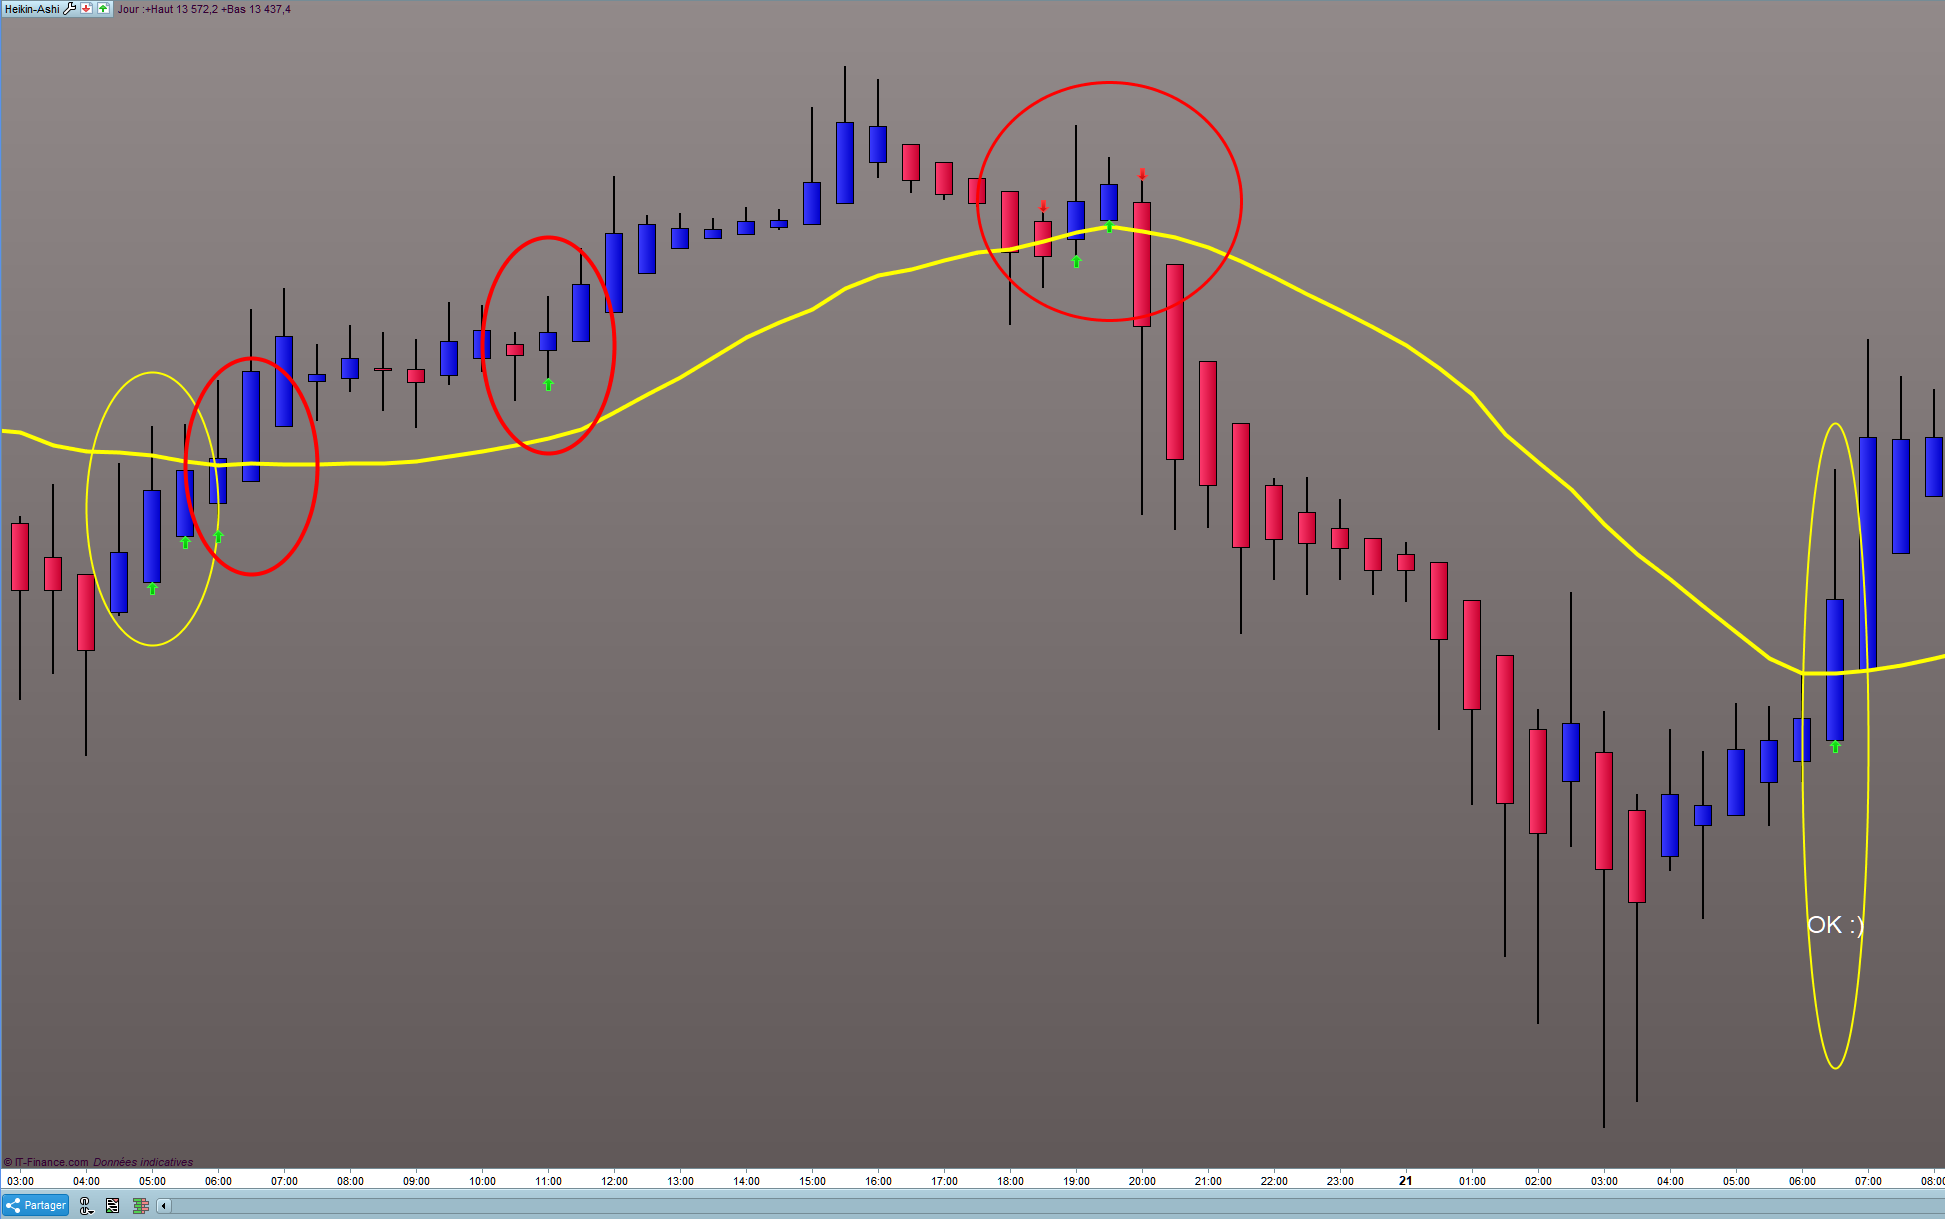
Voir graphique joint M30 et Sma 20.
L’indicateur ne prend visiblement pas en compte tout le temps les (Ouverture=Plus bas) et les (ouverture=Plus haut)
Cercle jaune ok
Cercle rouge pas ok.
Bon,
j’ai remplacé ça :
Ligne 17
green = xclose>xopen
Par ça :
green = xopen=xlow
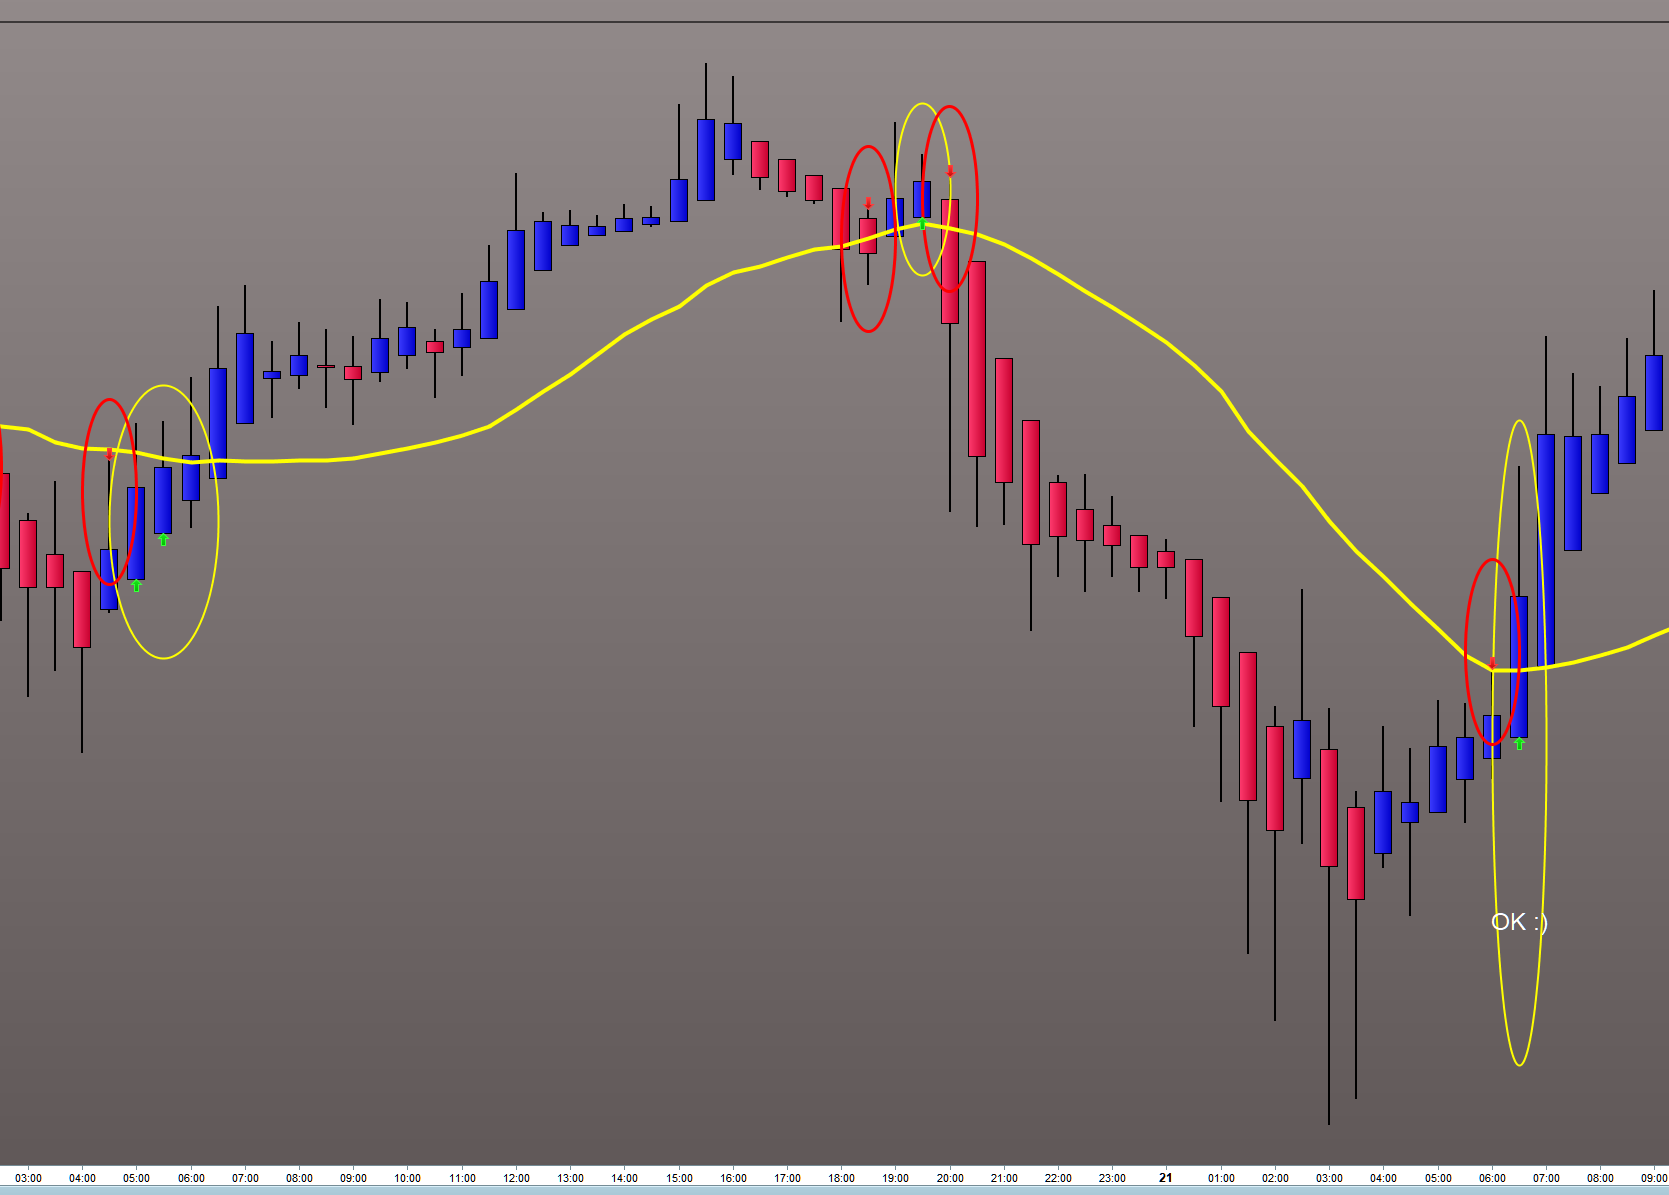
Cela semble fonctionner pour la partie Haussière (ellipses jaunes) graphique joint
En revanche, je ne sais pas quoi modifier pour la “partie” baissière (ellipses rouges).
Dernier coup de main ?
J’ai bricolé un truc sûrement pas très académique, mais cela semble fonctionner.
Remplacement de la ligne 26 et modif cosmétiques sur suivantes…
red=Xopen=xhigh

if red and xclose<avg and avg-xclose<distance*pointsize then
drawarrowdown(barindex,xhigh+10*pipsize) coloured(255,0,255)
endif
Question :
Quelle serait la ligne à modifier/rajouter si je voulais que la flèche signale que la MM est entre +10 et -10 points de la clôture de la bougie Heikin Ashi (avec les conditions de Bougies HA citées plus haut) ?
Pour le moment on est à moins de Z points (10)
A suivre…
Il faut inverser la soustraction à la ligne 3 , je pense que tu vas trouver 😉
Arghh c’est cruel…
Ligne 3 de mon post de 7.58 pm ?
Si oui , j’ai remplacé “-” par “+”, pas de changement.
Etait cela que tu voulais m’indiquer ?
En fait, je souhaite avoir une flèche si la MM est située entre 2 bornes (+10 / -10 points) de la clôture de la bougie HAshi par exemple.
Je n’ai pas le code en entier, donc je ne peux pas tester mais il faudrait essayer avec :
if red and xclose<avg and avg-xclose<distance*pointsize and xclose-avg<distance then
Bonjour,
Merci Nicolas pour ta proposition mais cela ne fonctionne pas.
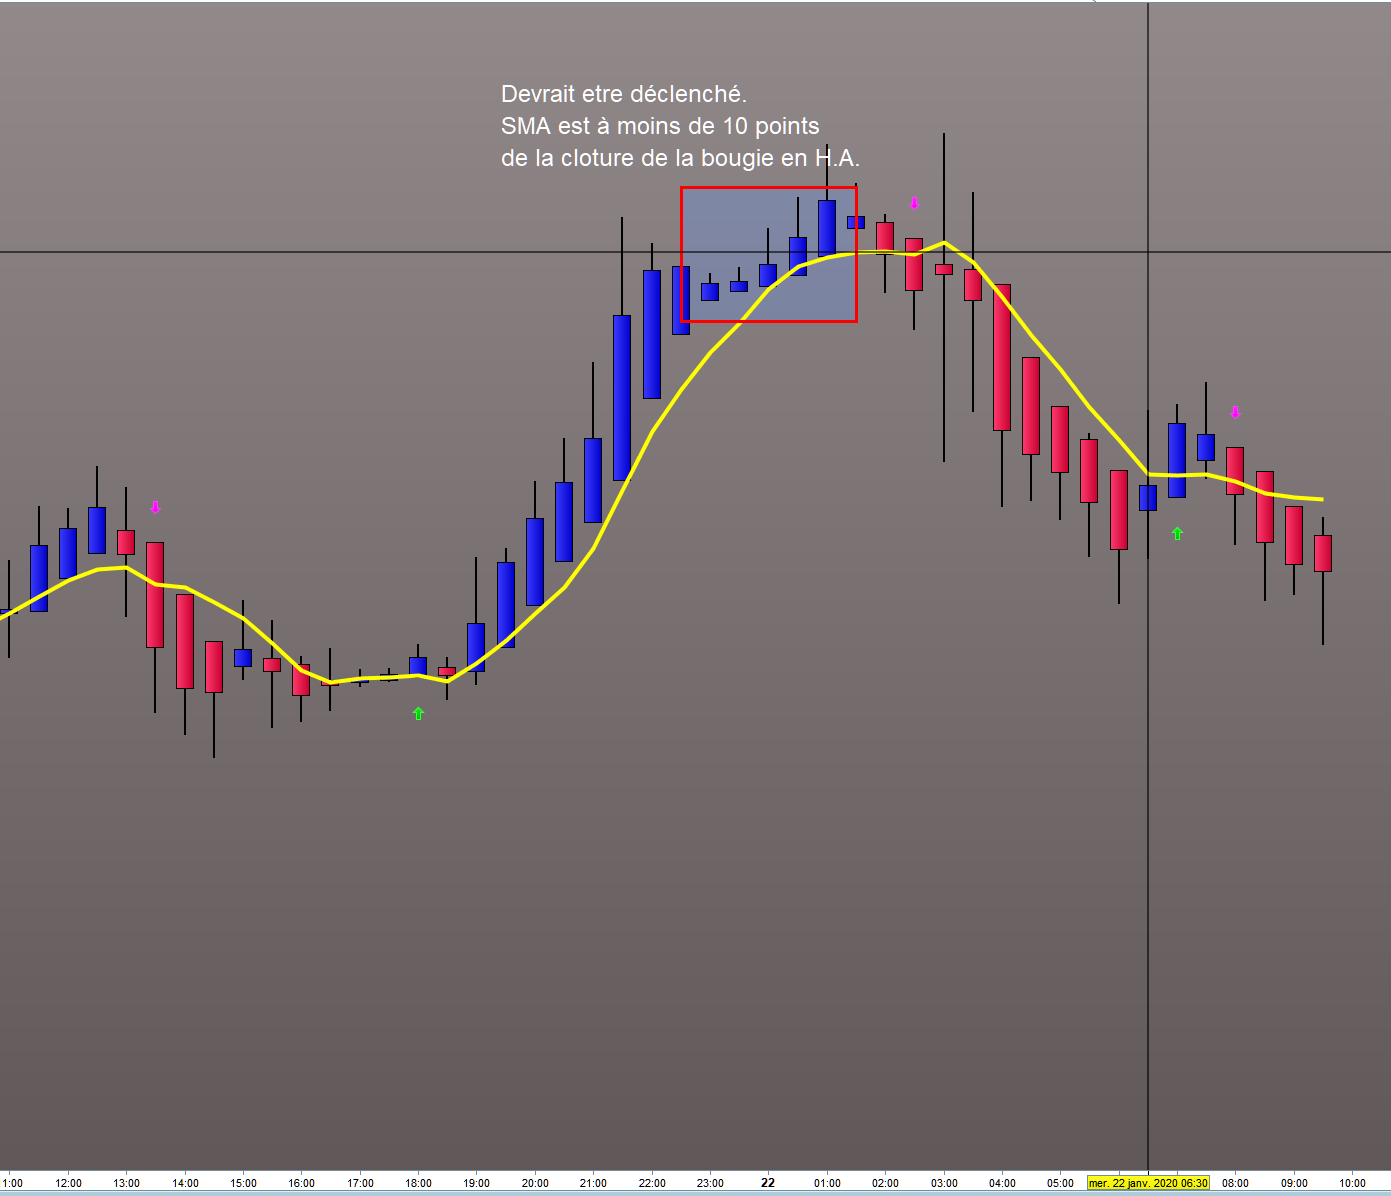
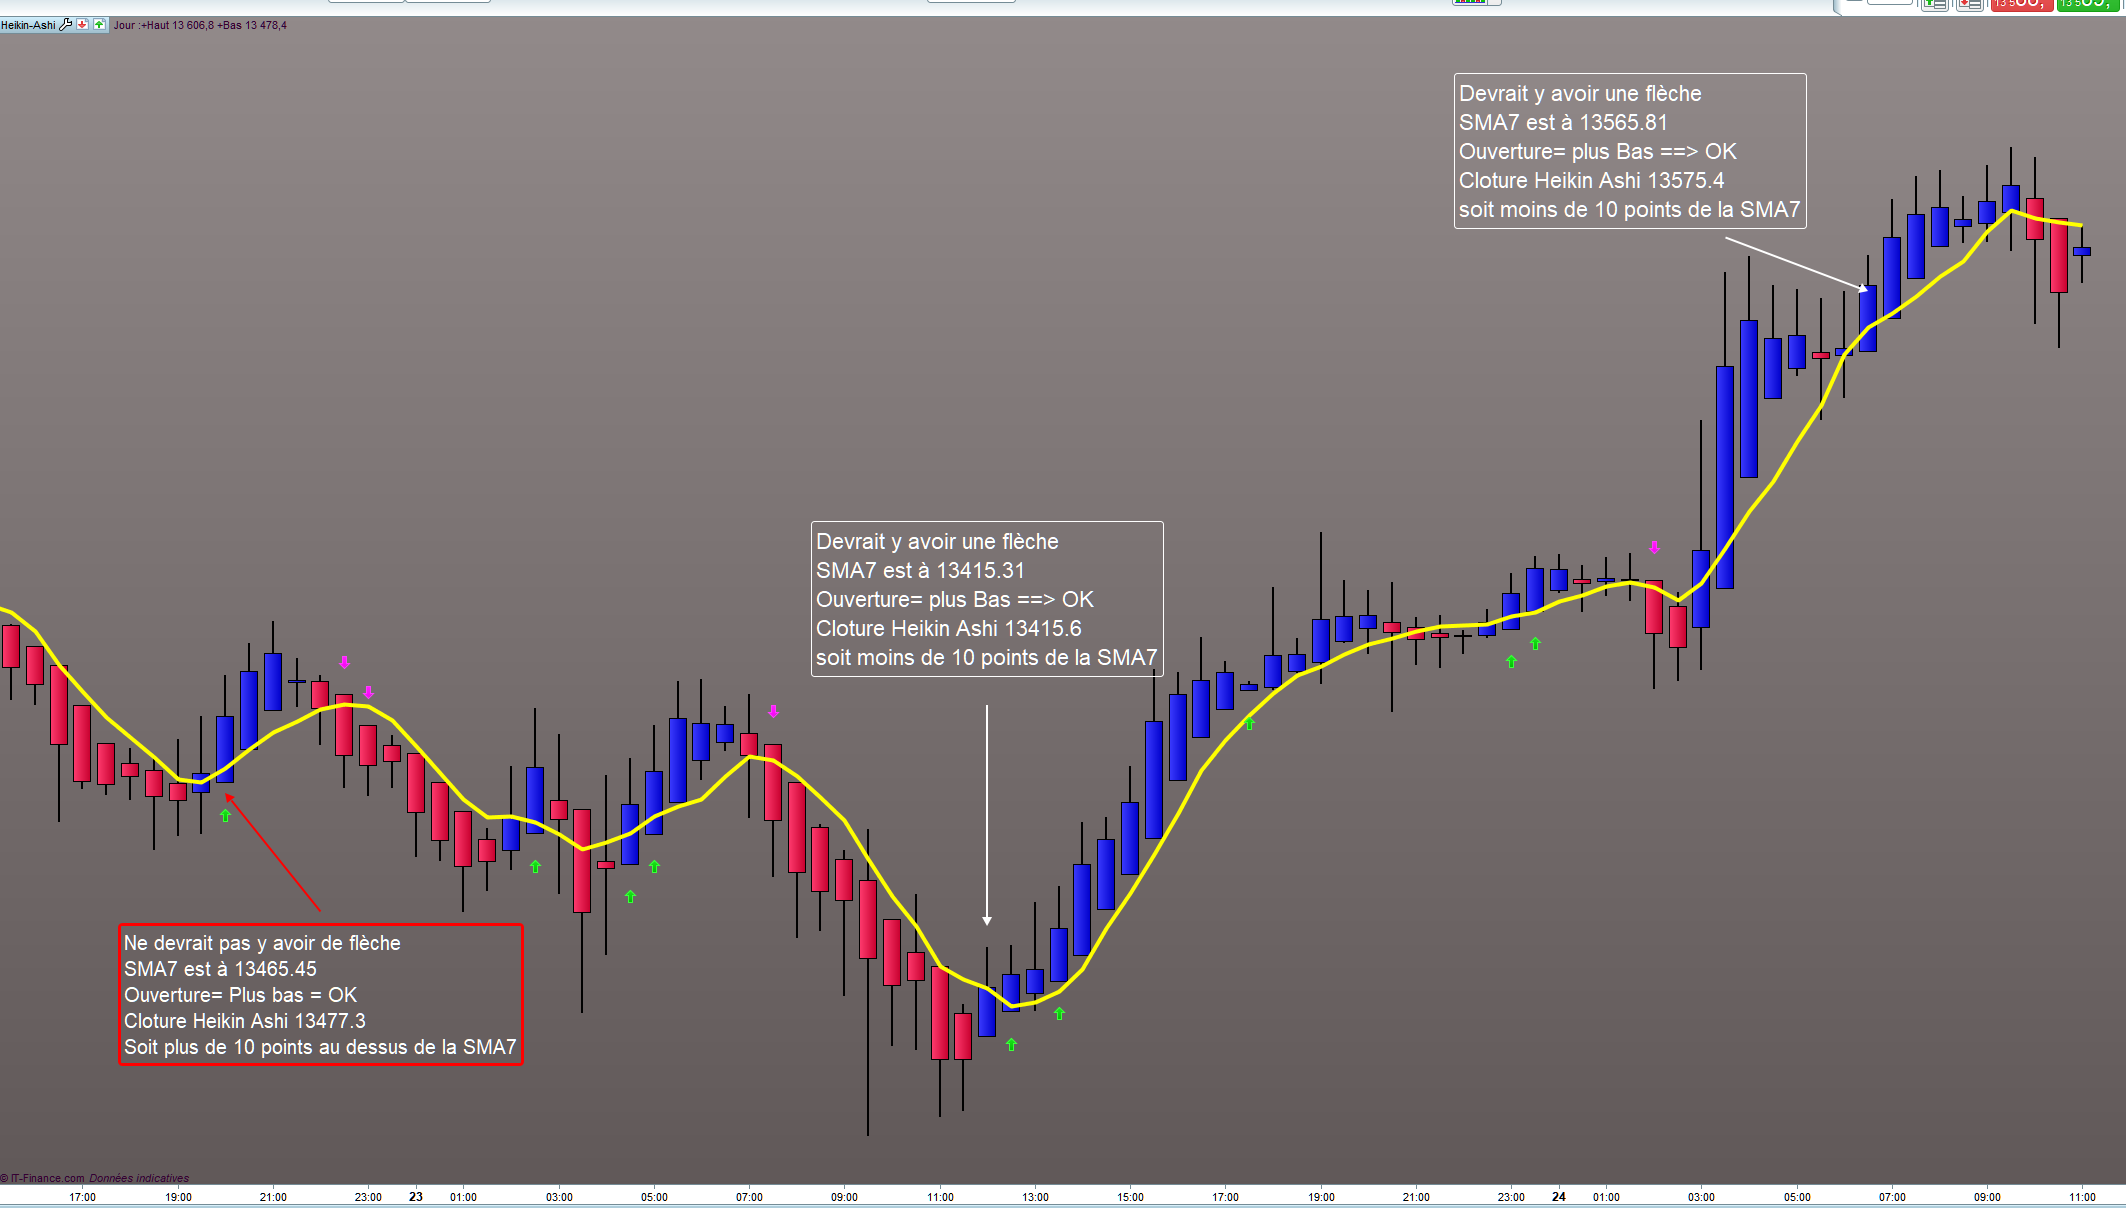
Voir graphique joint.
En fait c’est ok lorsque la SMA se trouve à l’intérieur du corps de la bougie en H.A.
Lorsque la SMA se trouve en dehors mais toujours à moins de 10 points cela n’est pas notifié.
Voici le code lié au graphique DAX avec ta proposition.
period = 7
type = 1
distance = 10
// ----

xClose = (open+high+low+close)/4
IF BarIndex=0 THEN
xOpen = open
xHigh = high
xLow = low
ELSe
xOpen = (xOpen[1] + xClose[1])/2
xHigh = Max(Max(high, xOpen), xClose)
xLow = Min(Min(low, xOpen), xClose)
ENDIF

green = xopen=xlow
avg = average[period,type](customclose)

if green and xclose>=avg and xclose-avg<distance*pointsize then
drawarrowup(barindex,xlow-6*pipsize) coloured(0,200,0)
endif

red=Xopen=xhigh

if red and xclose<avg and avg-xclose<distance*pointsize and xclose-avg<distance then
drawarrowdown(barindex,xhigh+6*pipsize) coloured(255,0,255)
endif

return
Je vois que tu as oublié de mettre les mêmes conditions de distance pour la partie achat. Je corrige.
period = 7
type = 1
distance = 10
// ----

xClose = (open+high+low+close)/4
IF BarIndex=0 THEN
xOpen = open
xHigh = high
xLow = low
ELSe
xOpen = (xOpen[1] + xClose[1])/2
xHigh = Max(Max(high, xOpen), xClose)
xLow = Min(Min(low, xOpen), xClose)
ENDIF

green = xopen=xlow
red=Xopen=xhigh
avg = average[period,type](customclose)

if abs(avg-xclose)<distance*pointsize  then
 if green and xclose>=avg  then
  drawarrowup(barindex,xlow-6*pipsize) coloured(0,200,0)
 endif

 if red and xclose<avg  then
  drawarrowdown(barindex,xhigh+6*pipsize) coloured(255,0,255)
 endif
endif

return
Non testé.
Bonjour Nicolas,
Merci pour la correction.
Hélas, ce n’est pas encore satisfaisant.
L’idée est bien que la flèche apparaissent lorsqu’elle se situe entre + 10 et – 10 points de la clôture de la bougie H.A + l’autre condition concernant H.A.
Regarde le graphe ci dessous.
Qu’en penses-tu ?