Bonjour,
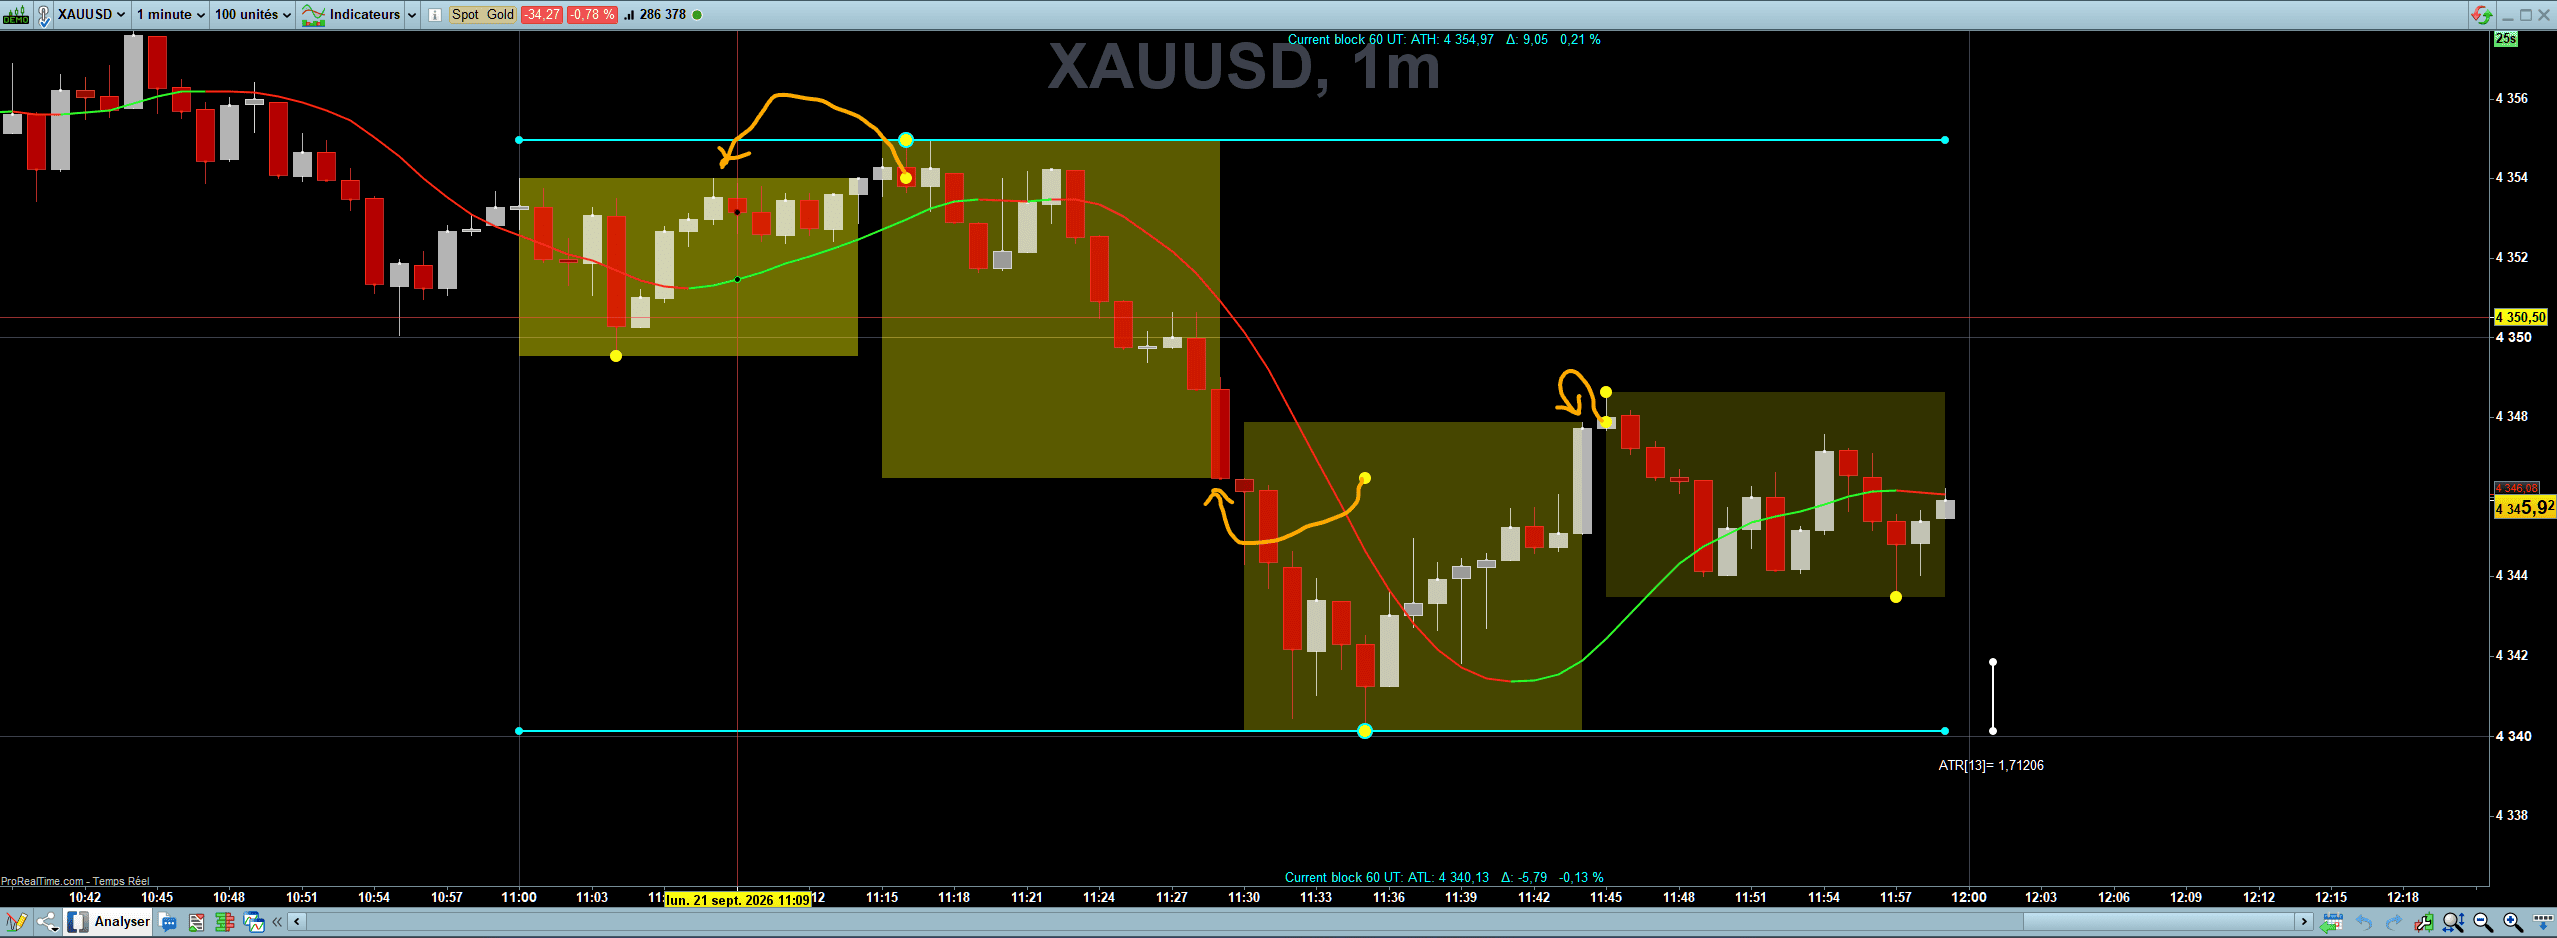
Le positionnement des points plus haut/ plus bas me semblait évident, mais je cale lamentablement à trouver la solution. Voici le problème:
1 En UT 1 m création d’un block flottant de 60 bars soit 1 heure flottante.calée sur la dernière bougie courante
2 Calculs du Plus Haut / Plus Bas et positionnement de ces 2 points de couleur cyan.
3 Subdivisions en quart d’heure, 4 blocks de 15mn de couleur yellow dégradée. Les Plus Haut / Plus Bas des rectangles sont toujours exacts.
4 Le positionnement des points PlusHaut / Plus Bas yellow des rectangles n’est pas fiable. (Dernières lignes du code)
Quelle est ma faute de programmation ?
Ci-joint une capture, et mon code.
Merci par avance de votre aide.
DEFPARAM DrawOnlastBarOnly= True // Force the graph to the right


X= BarIndex // X-axis
Bars= 60    // 1 hour on UT 1m
a= 255      // Opacity


//=======================================================================================================================
//                                  1. CURRENT BLOCK (X, X[Bars])
//=======================================================================================================================
//----- Calculations
xATH= HighestBars[Bars](High)
yATH= Highest[Bars](High)
dATH= yATH - Close
vATH= ROUND((yATH / Close - 1) * 100, 2)


xATL= LowestBars[Bars](Low)
yATL= Lowest[Bars](Low)
dATL= yATL - Close
vATL= ROUND((yATL / Close - 1) * 100, 2)


//----- Graphic display
DrawSegment(X-Bars+1, yATH, X, yATH) Coloured("Cyan",a) Style(Line,2)
DrawSegment(X-Bars+1, yATL, X, yATL) Coloured("Cyan",a) Style(Line,2)


DrawPoint(X-Bars+1, yATH, 2) Coloured("Cyan",a)
DrawPoint(X-xATH, yATH, 4) Coloured("Cyan",a)
DrawPoint(X, yATH, 2) Coloured("Cyan",a)


DrawPoint(X-Bars+1, yATL, 2) Coloured("Cyan",a)
DrawPoint(X-xATL, yATL, 4) Coloured("Cyan",a)
DrawPoint(X, yATL, 2) Coloured("Cyan",a)


//----- Digital display
DrawText("Current block #Bars#bars: ATH: #yATH#  Δ: #dATH#  #vATH#%", 200, -10) Coloured("Cyan",a) Anchor(Top)
DrawText("Current block #Bars#bars: ATL: #yATL#  Δ: #dATL#  #vATL#%", 200, +10) Coloured("Cyan",a) Anchor(Bottom)


//----- Tag for a visual ATR of the price
ATR= ROUND(AverageTrueRange[13](Close), 5)
DrawPoint(X+2, yATL, 2) Coloured("White",a) Anchor(TopRight,Index,Value)
DrawPoint(X+2, yATL+ATR, 2) Coloured("White",a) Anchor(TopRight,Index,Value)
DrawSegment(X+2, yATL, X+2, yATL+ATR) Coloured("White",a) Style(Line,2) Anchor(TopRight,Index,Value)
DrawText("ATR[13]= #ATR#", X+2, yATL-ATR/2) Coloured("White",a) Anchor(TopRight,Index,Value)


//=======================================================================================================================
//                                 1.1 Subdivisions 15m of the current block 1H
//=======================================================================================================================
aRec= 30 // Opacity rectangle
step= 15


IF IsLastBarUpdate THEN
FOR i= 0 TO 3 // 4 Blocks of 15m
yHH= High[i*step]
yLL= Low[i*step]


FOR j= i*step + 1 TO i*step + 14 // 14 bars to compare
IF yHH < High[j] THEN
yHH= High[j]
xHH= X[j]
ENDIF
IF yLL > Low[j] THEN
yLL= Low[j]
xLL= X[j]
ENDIF
NEXT //...// 14 bars to compare


// Display
aRec= aRec + 20 // Opacity
DrawRectangle(X-i*step, yHH, X-i*step-14, yLL) Coloured("Yellow",aRec)BorderColor("Yellow",0)
DrawPoint(xHH, yHH, 3) Coloured("Yellow")
DrawPoint(xLL, yLL, 3) Coloured("Yellow")


NEXT //... 4 Block of 15m
ENDIF


//=======================================================================================================================
RETURN
//=======================================================================================================================