


fibonacci de la veille

Viewing 6 posts - 1 through 6 (of 6 total)

  • Author
    Posts
  • #129990 quote
    DavidTDavidT
    Participant
    New

    Bonjour à tous,

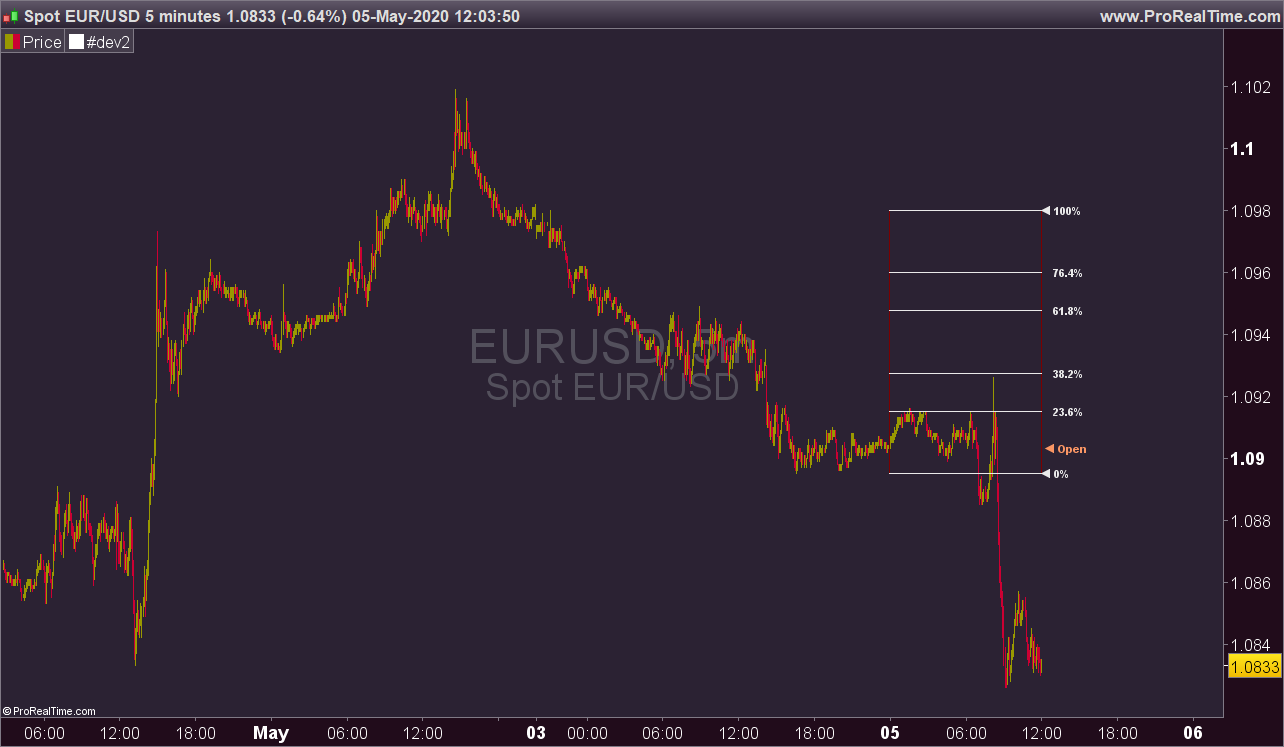
    je suis à la recherche d’un indicateur permettant de tracer de façon automatique sur le graphique du jour les niveaux de Fibonacci de la veille.

    Existe-t-il déjà une formule ? Apres quelques recherches je n’ai rien trouvé sur le forum.

    Merci à tous

    #130022 quote
    NicolasNicolas
    Keymaster
    Legend

    sur le graphique du jour les niveaux de Fibonacci de la veille

    Les niveaux de Fibonacci en fonction du High et Low de la veille ?

    #130024 quote
    NicolasNicolas
    Keymaster
    Legend

    Si oui, cette modification d’un indicateur de notre bibliothèque devrait faire l’affaire :

    // Daily Fibo_Percent | Graph Indicator
    // 15.12.2018
    // Swapping @ www.forexswap.fr
    // Sharing ProRealTime knowledge (alt+16)
    
    DefParam DrawOnLastBarOnly = true
    
    // --- settings
    rectangle = 1 //(0=false;1=true)
    pourcentage = 0 //(0=false;1=true)
    fibonacci = 1 //(0=false;1=true)
    alpha = 255
    // --- end of settings
    
    if day <> day[1] then
    startbar = barindex
    endif
    
    HiDay = dhigh(1)
    LowDay = dlow(1)
    if rectangle = 1 then
    DrawRectangle(startbar,HiDay,barindex,LowDay) coloured(123,0,0,alpha)
    else
    rectangle = 0
    endif
    DrawText(" ◄ Open",barindex,dopen(0),Dialog,Bold,11) coloured(250,150,100,alpha)
    
    if pourcentage = 1 then
    pourcentage100 = (hiday-lowday)*1.0+lowday
    DrawSegment(startbar,pourcentage100,barindex,pourcentage100) coloured(150,200,50,alpha)
    DrawText(" ◄ 100%",barindex,pourcentage100,Dialog,Bold,11) coloured(150,200,50,alpha)
    pourcentage80 = (hiday-lowday)*.80+lowday
    DrawSegment(startbar,pourcentage80,barindex,pourcentage80) coloured(150,200,50,alpha)
    DrawText(" 80%",barindex,pourcentage80,Dialog,Bold,11) coloured(150,200,50,alpha)
    pourcentage60 = (hiday-lowday)*.6+lowday
    DrawSegment(startbar,pourcentage60,barindex,pourcentage60) coloured(150,200,50,alpha)
    DrawText(" 60%",barindex,pourcentage60,Dialog,Bold,11) coloured(150,200,50,alpha)
    pourcentage40 = (hiday-lowday)*.4+lowday
    DrawSegment(startbar,pourcentage40,barindex,pourcentage40) coloured(150,200,50,alpha)
    DrawText(" 40%",barindex,pourcentage40,Dialog,Bold,11) coloured(150,200,50,alpha)
    pourcentage20 = (hiday-lowday)*.2+lowday
    DrawSegment(startbar,pourcentage20,barindex,pourcentage20) coloured(150,200,50,alpha)
    DrawText(" 20%",barindex,pourcentage20,Dialog,Bold,11) coloured(150,200,50,alpha)
    pourcentage0 = (hiday-lowday)*.0+lowday
    DrawSegment(startbar,pourcentage0,barindex,pourcentage0) coloured(150,200,50,alpha)
    DrawText(" ◄ 0%",barindex,pourcentage0,Dialog,Bold,11) coloured(150,200,50,alpha)
    else
    pourcentage = 0
    endif
    
    if fibonacci = 1 then
    fib100 = (hiday-lowday)*1.0+lowday
    DrawSegment(startbar,fib100,barindex,fib100) coloured(234,234,234,alpha)
    DrawText(" ◄ 100%",barindex,fib100,Dialog,Bold,11) coloured(234,234,234,alpha)
    fib764 = (hiday-lowday)*.764+lowday
    DrawSegment(startbar,fib764,barindex,fib764) coloured(234,234,234,alpha)
    DrawText(" 76.4%",barindex,fib764,Dialog,Bold,11) coloured(234,234,234,alpha)
    fib618 = (hiday-lowday)*.618+lowday
    DrawSegment(startbar,fib618,barindex,fib618) coloured(234,234,234,alpha)
    DrawText(" 61.8%",barindex,fib618,Dialog,Bold,11) coloured(234,234,234,alpha)
    fib382 = (hiday-lowday)*.382+lowday
    DrawSegment(startbar,fib382,barindex,fib382) coloured(234,234,234,alpha)
    DrawText(" 38.2%",barindex,fib382,Dialog,Bold,11) coloured(234,234,234,alpha)
    fib236 = (hiday-lowday)*.236+lowday
    DrawSegment(startbar,fib236,barindex,fib236) coloured(234,234,234,alpha)
    DrawText(" 23.6%",barindex,fib236,Dialog,Bold,11) coloured(234,234,234,alpha)
    fib0 = (hiday-lowday)*.0+lowday
    DrawSegment(startbar,fib0,barindex,fib0) coloured(234,234,234,alpha)
    DrawText(" ◄ 0%",barindex,fib0,Dialog,Bold,11) coloured(234,234,234,alpha)
    else
    fibonacci = 0
    endif
    
    return
    fibonacci-retracement-from-previous-day.png fibonacci-retracement-from-previous-day.png
    #130034 quote
    DavidTDavidT
    Participant
    New

    Bonjour Nicolas,

    cela correspond exactement à ce que je cherchais, je me suis effectivement mal exprimé.

    Serait-il possible d’avoir ce même tracé de Fibonacci qui respecte les pourcentages haussier lors d’une journée haussière et baissière lors d’une journée baissière ?

    Enfin comment supprimer le fond du rectangle qui se dessine et modifier la couleur des lignes tracées ?

    Merci d’avance de votre aide.

    #130035 quote
    NicolasNicolas
    Keymaster
    Legend

    Quelle version de la plateforme stp ?

    #130036 quote
    NicolasNicolas
    Keymaster
    Legend

    Pour avoir les niveaux inversés, sauf erreur de ma part, il faut modifier ce type de variable :

    fib100 = (hiday-lowday)*1.0+lowday

    par

    fib100 = lowday-(hiday-lowday)*1.0

    on soustrait le retracement au lieu de l’ajouter.

Viewing 6 posts - 1 through 6 (of 6 total)
  • You must be logged in to reply to this topic.

ProRealAI ProRealAI New

Stuck on this ProBuilder code?

Describe what this topic is trying to build, in plain English, and ProRealAI writes the ProRealTime™ indicator, screener or system for you.

Available in 7 languages
Try ProRealAI

fibonacci de la veille


ProBuilder : Indicateurs & Outils Personnalisés

New Reply
Author
author-avatar
DavidT @davidt Participant
Summary

This topic contains 5 replies,
has 2 voices, and was last updated by NicolasNicolas

6 years, 4 months ago.

Topic Details
Forum: ProBuilder : Indicateurs & Outils Personnalisés
Language: French
Started: 05/05/2020
Status: Active
Attachments: 1 files
ProRealCode ProRealCode
Loading...

