Hola:
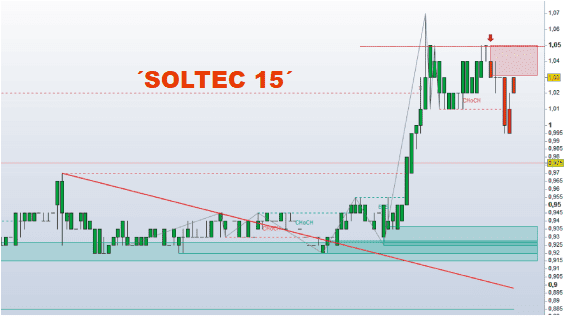
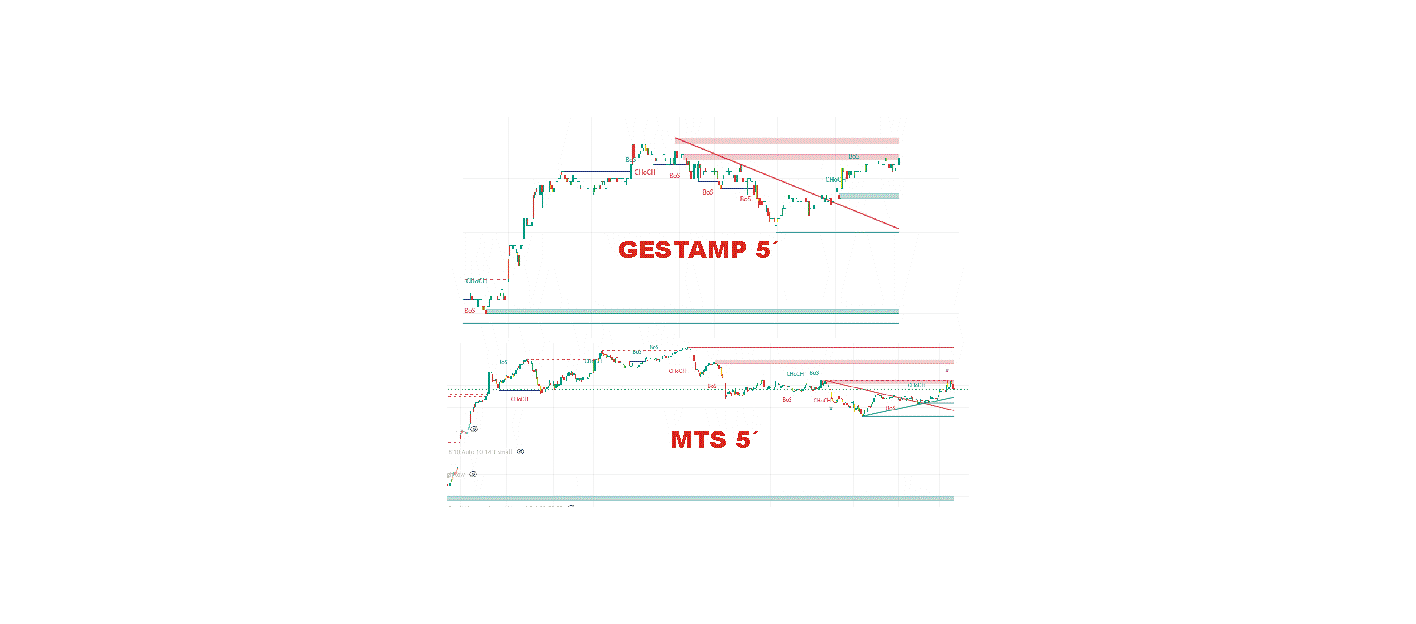
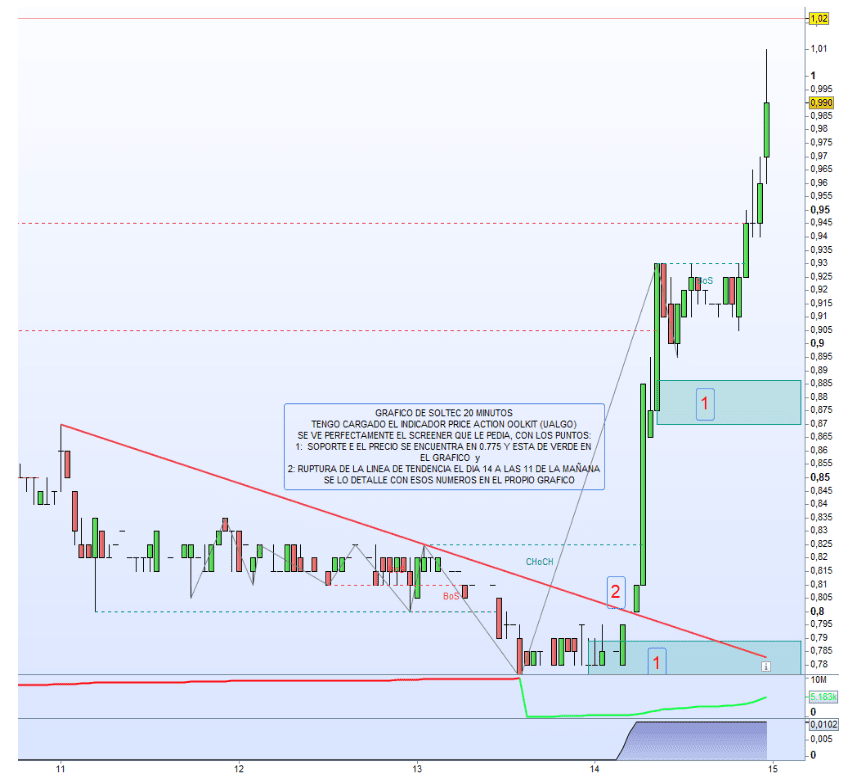
Sería posible hacer el Screener que recoja: 1 para Soportes por un lado y 2 para Rupturas de Tendencia. Gracias
//Sería posible hacer el Screener que recoja: 1 para Soportes por un lado y 2 para Rupturas de Tendencia. Gracias                                                                                                                                                                           //--------------------------------------------
// PRC_Price Action Toolkit (by UAlgo)
// version = 0
// 17.03.2026
// Iván González @ www.prorealcode.com
// Sharing ProRealTime knowledge
//--------------------------------------------
defparam drawonlastbaronly = true
//--------------------------------------------
// ── PARAMETERS ──
//--------------------------------------------
// Toggle modules: 1=show, 0=hide
showMS = 1
showLiq = 1
showOB = 1
showTL = 1
// Settings
zzLen = 9
liqLen = 30
maxOBShow = 3
tlSens = 20
// ── COLORS (RGB) ──
// Bullish: teal
bR = 0
bG = 153
bB = 129
// Bearish: red
sR = 242
sG = 54
sB = 69
//--------------------------------------------
// CALCULATION SECTION
//--------------------------------------------
myATR = averagetruerange[14]
// ── STATE VARIABLES ──
once trendDir = 1
once drewUp = 0
once drewDown = 0
once stateDir = 0
once swCount = 0
once msCount = 0
once obCount = 0
once blCount = 0
once ulCount = 0
once lastSHPrice = -1
once lastSHBar = -1
once lastSLPrice = -1
once lastSLBar = -1
// ── ZIGZAG TREND DETECTION ──
toUp = 0
toDown = 0
if barindex >= 2 * zzLen then
if high[zzLen] >= highest[zzLen](high) then
toUp = 1
endif
if low[zzLen] <= lowest[zzLen](low) then
toDown = 1
endif
endif
// Trend flip
if trendDir = 1 and toDown = 1 then
trendDir = -1
elsif trendDir = -1 and toUp = 1 then
trendDir = 1
endif
if barindex > zzLen then
trendChanged = (trendDir <> trendDir[1])
else
trendChanged = 0
endif
// ── NEW SWING HIGH (trend flipped from -1 to 1) ──
if trendChanged and trendDir = 1 then
lastSHPrice = high[zzLen]
lastSHBar = barindex - zzLen
$swBar[swCount] = barindex - zzLen
$swPrice[swCount] = high[zzLen]
$swType[swCount] = 1
swCount = swCount + 1
drewUp = 0
endif
// ── NEW SWING LOW (trend flipped from 1 to -1) ──
if trendChanged and trendDir = -1 then
lastSLPrice = low[zzLen]
lastSLBar = barindex - zzLen
$swBar[swCount] = barindex - zzLen
$swPrice[swCount] = low[zzLen]
$swType[swCount] = -1
swCount = swCount + 1
drewDown = 0
endif
// ── BEARISH BREAK (close < last swing low) ──
if lastSLPrice > 0 and drewDown = 0 then
if close < lastSLPrice then
if stateDir = 0 or stateDir = 1 then
mType = 1
else
mType = 2
endif
stateDir = -1
drewDown = 1


// Store CHoCH/BoS label
$msBar[msCount] = round((lastSLBar + barindex) / 2)
$msPrice[msCount] = lastSLPrice
$msType[msCount] = mType
$msDir[msCount] = -1
$msLineBar1[msCount] = lastSLBar
$msLineBar2[msCount] = barindex
msCount = msCount + 1


// Bearish Order Block: highest candle in the range
if showOB = 1 then
dist = barindex - lastSLBar
maxVal = -1
obLoc = barindex
if dist > 0 then
for i = 0 to dist do
if high[i] > maxVal then
maxVal = high[i]
obLoc = barindex - i
endif
next
else
maxVal = high
obLoc = barindex
endif
$obVal[obCount] = maxVal
$obBar[obCount] = obLoc
$obSide[obCount] = -1
$obBrk[obCount] = 0
$obATR[obCount] = myATR
obCount = obCount + 1
endif
endif
endif
// ── BULLISH BREAK (close > last swing high) ──
if lastSHPrice > 0 and drewUp = 0 then
if close > lastSHPrice then
if stateDir = 0 or stateDir = -1 then
mType = 1
else
mType = 2
endif
stateDir = 1
drewUp = 1


// Store CHoCH/BoS label
$msBar[msCount] = round((lastSHBar + barindex) / 2)
$msPrice[msCount] = lastSHPrice
$msType[msCount] = mType
$msDir[msCount] = 1
$msLineBar1[msCount] = lastSHBar
$msLineBar2[msCount] = barindex
msCount = msCount + 1


// Bullish Order Block: lowest candle in the range
if showOB = 1 then
dist = barindex - lastSHBar
minVal = 999999999
obLoc = barindex
if dist > 0 then
for i = 0 to dist do
if low[i] < minVal then
minVal = low[i]
obLoc = barindex - i
endif
next
else
minVal = low
obLoc = barindex
endif
$obVal[obCount] = minVal
$obBar[obCount] = obLoc
$obSide[obCount] = 1
$obBrk[obCount] = 0
$obATR[obCount] = myATR
obCount = obCount + 1
endif
endif
endif
// ── UPDATE ORDER BLOCKS (mark broken) ──
if obCount > 0 then
for i = 0 to obCount - 1 do
if $obBrk[i] = 0 then
if $obSide[i] = 1 and close < $obVal[i] then
$obBrk[i] = 1
elsif $obSide[i] = -1 and close > $obVal[i] then
$obBrk[i] = 1
endif
endif
next
endif
// ── LIQUIDITY DETECTION ──
if barindex >= 2 * liqLen and showLiq = 1 then
// Bearish liquidity (pivot high)
if high[liqLen] = highest[2 * liqLen + 1](high) then
$blVal[blCount] = high[liqLen]
$blBar[blCount] = barindex - liqLen
$blBrk[blCount] = 0
$blBrkBar[blCount] = 0
$blSwept[blCount] = 0
$blSwBar[blCount] = 0
blCount = blCount + 1
endif


// Bullish liquidity (pivot low)
if low[liqLen] = lowest[2 * liqLen + 1](low) then
$ulVal[ulCount] = low[liqLen]
$ulBar[ulCount] = barindex - liqLen
$ulBrk[ulCount] = 0
$ulBrkBar[ulCount] = 0
$ulSwept[ulCount] = 0
$ulSwBar[ulCount] = 0
ulCount = ulCount + 1
endif
endif


// ── UPDATE LIQUIDITY (detect sweeps) ──
if blCount > 0 then
for i = 0 to blCount - 1 do
if $blBrk[i] = 0 then
if high > $blVal[i] then
$blBrk[i] = 1
$blBrkBar[i] = barindex
if close < $blVal[i] then
$blSwept[i] = 1
$blSwBar[i] = barindex
endif
endif
endif
next
endif


if ulCount > 0 then
for i = 0 to ulCount - 1 do
if $ulBrk[i] = 0 then
if low < $ulVal[i] then
$ulBrk[i] = 1
$ulBrkBar[i] = barindex
if close > $ulVal[i] then
$ulSwept[i] = 1
$ulSwBar[i] = barindex
endif
endif
endif
next
endif


// ── TREND LINES (valuewhen pattern) ──
once tlBearEnd = -1
once tlBearEndVal = 0
once tlBearStart = -1
once tlBearStartVal = 0
once tlBullEnd = -1
once tlBullEndVal = 0
once tlBullStart = -1
once tlBullStartVal = 0


if barindex >= 2 * tlSens and showTL = 1 then
if high[tlSens] = highest[2 * tlSens + 1](high) then
tlBearStart = tlBearEnd
tlBearStartVal = tlBearEndVal
tlBearEnd = barindex - tlSens
tlBearEndVal = high[tlSens]
endif
if low[tlSens] = lowest[2 * tlSens + 1](low) then
tlBullStart = tlBullEnd
tlBullStartVal = tlBullEndVal
tlBullEnd = barindex - tlSens
tlBullEndVal = low[tlSens]
endif
endif


//--------------------------------------------
// DRAWING SECTION
//--------------------------------------------
if islastbarupdate then


// ── ZIGZAG SEGMENTS (last 10 swings) ──
if showMS = 1 and swCount >= 2 then
startSw = max(0, swCount - 11)
for i = startSw to swCount - 2 do
drawsegment($swBar[i], $swPrice[i], $swBar[i + 1], $swPrice[i + 1]) coloured(128, 128, 128) style(line, 1)
next
endif


// ── MARKET STRUCTURE LABELS (last 10) ──
if showMS = 1 and msCount > 0 then
startMs = max(0, msCount - 10)
for i = startMs to msCount - 1 do
// Horizontal break line (colored by direction)
if $msDir[i] = -1 then
drawsegment($msLineBar1[i], $msPrice[i], $msLineBar2[i], $msPrice[i]) coloured(sR, sG, sB) style(dottedline, 1)
else
drawsegment($msLineBar1[i], $msPrice[i], $msLineBar2[i], $msPrice[i]) coloured(bR, bG, bB) style(dottedline, 1)
endif


atrOff = myATR * 0.3
// CHoCH bearish
if $msType[i] = 1 and $msDir[i] = -1 then
drawtext("CHoCH", $msBar[i], $msPrice[i] + atrOff) coloured(sR, sG, sB)
endif
// CHoCH bullish
if $msType[i] = 1 and $msDir[i] = 1 then
drawtext("CHoCH", $msBar[i], $msPrice[i] - atrOff) coloured(bR, bG, bB)
endif
// BoS bearish
if $msType[i] = 2 and $msDir[i] = -1 then
drawtext("BoS", $msBar[i], $msPrice[i] + atrOff) coloured(sR, sG, sB)
endif
// BoS bullish
if $msType[i] = 2 and $msDir[i] = 1 then
drawtext("BoS", $msBar[i], $msPrice[i] - atrOff) coloured(bR, bG, bB)
endif
next
endif


// ── ORDER BLOCKS (last N unbroken per side) ──
if showOB = 1 and obCount > 0 then
bullShown = 0
bearShown = 0
for j = 0 to obCount - 1 do
i = obCount - 1 - j
if $obBrk[i] = 0 then
if $obSide[i] = 1 and bullShown < maxOBShow then
drawrectangle($obBar[i], $obVal[i], barindex + 5, $obVal[i] + $obATR[i]) coloured(bR, bG, bB) fillcolor(bR, bG, bB, 50)
bullShown = bullShown + 1
endif
if $obSide[i] = -1 and bearShown < maxOBShow then
drawrectangle($obBar[i], $obVal[i] - $obATR[i], barindex + 5, $obVal[i]) coloured(sR, sG, sB) fillcolor(sR, sG, sB, 50)
bearShown = bearShown + 1
endif
endif
if bullShown >= maxOBShow and bearShown >= maxOBShow then
break
endif
next
endif


// ── LIQUIDITY LINES ──
if showLiq = 1 then
// Bearish liquidity (active = solid, broken = dashed)
blShown = 0
blBrkShown = 0
if blCount > 0 then
for j = 0 to blCount - 1 do
i = blCount - 1 - j
if $blBrk[i] = 0 and blShown < 7 then
drawsegment($blBar[i], $blVal[i], barindex, $blVal[i]) coloured(sR, sG, sB) style(line, 1)
blShown = blShown + 1
endif
if $blBrk[i] = 1 and blBrkShown < 7 then
drawsegment($blBar[i], $blVal[i], $blBrkBar[i], $blVal[i]) coloured(sR, sG, sB) style(dottedline, 1)
if $blSwept[i] = 1 then
drawtext("x", $blSwBar[i], $blVal[i] + myATR * 0.2) coloured(156, 39, 176)
endif
blBrkShown = blBrkShown + 1
endif
next
endif


// Bullish liquidity (active = solid, broken = dashed)
ulShown = 0
ulBrkShown = 0
if ulCount > 0 then
for j = 0 to ulCount - 1 do
i = ulCount - 1 - j
if $ulBrk[i] = 0 and ulShown < 7 then
drawsegment($ulBar[i], $ulVal[i], barindex, $ulVal[i]) coloured(bR, bG, bB) style(line, 1)
ulShown = ulShown + 1
endif
if $ulBrk[i] = 1 and ulBrkShown < 7 then
drawsegment($ulBar[i], $ulVal[i], $ulBrkBar[i], $ulVal[i]) coloured(bR, bG, bB) style(dottedline, 1)
if $ulSwept[i] = 1 then
drawtext("x", $ulSwBar[i], $ulVal[i] - myATR * 0.2) coloured(0, 128, 128)
endif
ulBrkShown = ulBrkShown + 1
endif
next
endif
endif


// ── TREND LINES ──
if showTL = 1 then
// Bearish trend line (connecting last 2 pivot highs)
if tlBearStart > 0 and tlBearEnd > tlBearStart then
tlBearSlope = (tlBearEndVal - tlBearStartVal) / (tlBearEnd - tlBearStart)
if tlBearSlope < 0 then
tlBearExtVal = tlBearEndVal + tlBearSlope * (barindex - tlBearEnd)
drawsegment(tlBearStart, tlBearStartVal, barindex, tlBearExtVal) coloured(sR, sG, sB) style(line, 2)
endif
endif


// Bullish trend line (connecting last 2 pivot lows)
if tlBullStart > 0 and tlBullEnd > tlBullStart then
tlBullSlope = (tlBullEndVal - tlBullStartVal) / (tlBullEnd - tlBullStart)
if tlBullSlope > 0 then
tlBullExtVal = tlBullEndVal + tlBullSlope * (barindex - tlBullEnd)
drawsegment(tlBullStart, tlBullStartVal, barindex, tlBullExtVal) coloured(bR, bG, bB) style(line, 2)
endif
endif
endif


endif
//--------------------------------------------
return