


doppelter RSI Methode

Viewing 6 posts - 1 through 6 (of 6 total)

  • Author
    Posts
  • #240045 quote
    axmichiaxmichi
    Participant
    Senior

    Hallo für einen code fehlt mir die Info wie ich den Indikator rsi  richtig schreiben muss.


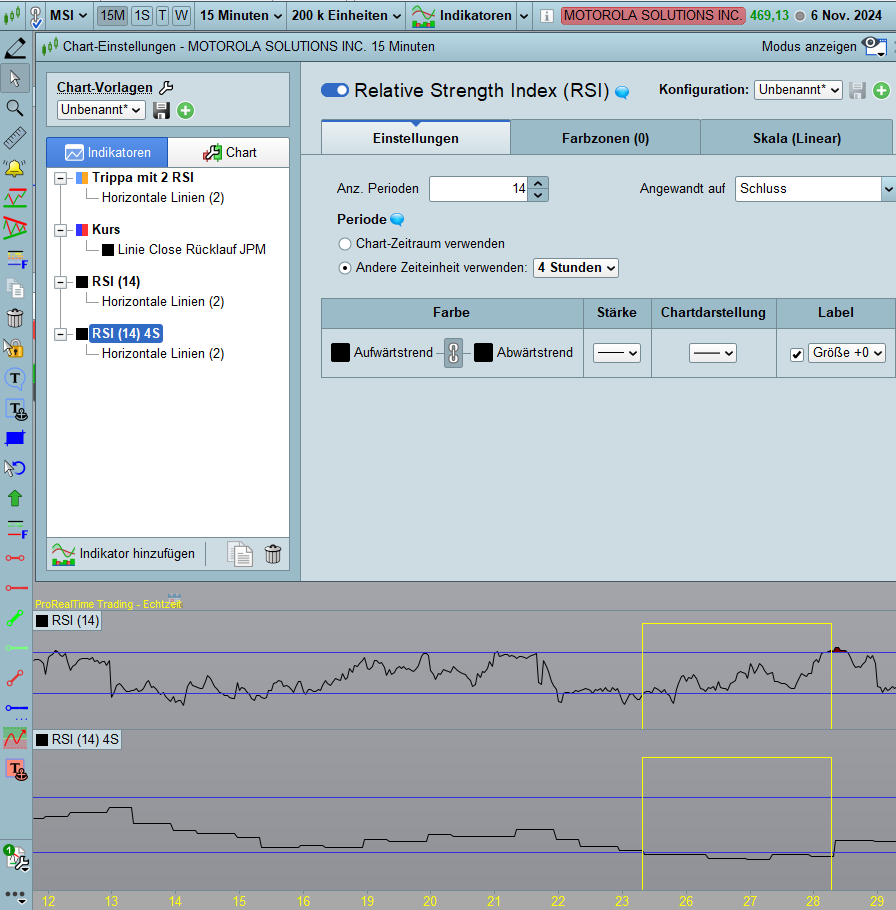
    Es geht darum den rsi zwei mal auf einem 15 Minuten chart zu verwenden .

    der 1. RSI soll in den Standarteinstellungen von 15 min bleiben, bei dem 2. RSI jedoch soll der Timeframe auf 4 Stunden umgestellt werden.

    Es soll eingestiegen werden, wenn der RSI (unten) unter der 30er Linie ist und gleichzeitig der RSI (oben) im Bild die 30er Linie überkreuzt

    Wie muss ich das im code schreiben?

    Mein Code funktioniert leider nicht.

    Danke für die Hilfe…

    TIMEFRAME(15 minutes, UPDATEONCLOSE)
    indicator2 = RSI[14](close)
    c2 = (indicator2 CROSSES OVER 30)
    TIMEFRAME(default)

    TIMEFRAME(4 hours, UPDATEONCLOSE)
    indicator1 = RSI[14](close)
    c1 = (indicator1[1] < 30)
    TIMEFRAME(default)
    //
    IF c1 and c2 THEN
    BUY 1 SHARES AT MARKET

    c7 = close-(Lowest[5](low))// SL auf die letzten 5 Bars
    set stop loss c7
    set target profit c7*2
    ENDIF

    doppel-rsi.png doppel-rsi.png
    #240051 quote
    Iván GonzálezIván González
    Moderator
    Legend

    Hallo. Hier sind sie:

    timeframe(4h,updateonclose)
    rsi4h=rsi[14](close)
    c1=rsi4h[1]<30
    
    TIMEFRAME(15 minutes, UPDATEONCLOSE)
    rsi15mn = RSI[14](close)
    c2 = rsi15mn CROSSES OVER 30
    
    IF c1 and c2 THEN
    
    BUY 1 SHARES AT MARKET
    
    c7 = close-(Lowest[5](low))// SL auf die letzten 5 Bars
    sl=close-c7
    tp=close+2*c7
    set stop loss c7
    set target profit c7*2
    ENDIF
    
    graphonprice sl coloured("red")
    graphonprice tp coloured("blue")
    
    graph rsi4h coloured("orange")
    graph rsi15mn coloured("fuchsia")
    graph 30 coloured("grey")
    robertogozzi thanked this post
    #240054 quote
    axmichiaxmichi
    Participant
    Senior

    wunderbar danke, können Sie bitte im 15 minutenchart auch noch den Tageschlusskurs vor 3 Tagen im Chart mit einer kleinen Linie kennzeichnen?


    Danke Ihnen

    #240067 quote
    Iván GonzálezIván González
    Moderator
    Legend

    Hier bist du.

    timeframe(daily,updateonclose)
    prevclose=close[3]
    timeframe(4h,updateonclose)
    rsi4h=rsi[14](close)
    c1=rsi4h[1]<30
    
    TIMEFRAME(15 minutes, UPDATEONCLOSE)
    rsi15mn = RSI[14](close)
    c2 = rsi15mn CROSSES OVER 30
    
    IF c1 and c2 THEN
    
    BUY 1 SHARES AT MARKET
    
    c7 = close-(Lowest[5](low))// SL auf die letzten 5 Bars
    sl=close-c7
    tp=close+2*c7
    set stop loss c7
    set target profit c7*2
    ENDIF
    
    graphonprice sl coloured("red")
    graphonprice tp coloured("blue")
    graphonprice prevclose coloured("orange")
    
    graph rsi4h coloured("orange")
    graph rsi15mn coloured("fuchsia")
    graph 30 coloured("grey")
    
    #240093 quote
    axmichiaxmichi
    Participant
    Senior

    Vielen Dank,

    Ist es möglich die Linien (graphonprice) noch etwas dicker zu machen?

    #240143 quote
    robertogozzirobertogozzi
    Moderator
    Legend

    Nein, leider verfügen GRAPH und GRAPHONPRICE nicht über diese Option.

Viewing 6 posts - 1 through 6 (of 6 total)
  • You must be logged in to reply to this topic.

ProRealAI ProRealAI New

Stuck on this ProBuilder code?

Describe what this topic is trying to build, in plain English, and ProRealAI writes the ProRealTime™ indicator, screener or system for you.

Available in 7 languages
Try ProRealAI

doppelter RSI Methode


ProOrder: Automatischer Handel & Backtesting

New Reply
Author
author-avatar
axmichi @axmichi Participant
Summary

This topic contains 5 replies,
has 3 voices, and was last updated by robertogozzirobertogozzi
1 year, 10 months ago.

Topic Details
Forum: ProOrder: Automatischer Handel & Backtesting
Language: German
Started: 11/07/2024
Status: Active
Attachments: 1 files
ProRealCode ProRealCode
Loading...


