


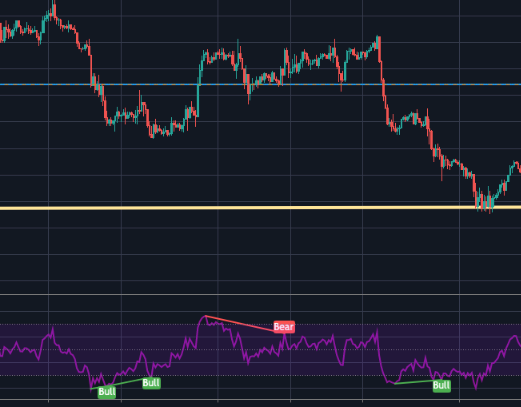
Divergence Indicator

Viewing 2 posts - 1 through 2 (of 2 total)

  • Author
    Posts
  • #149402 quote
    boonetboonet
    Participant
    Senior
    //@version=4
    study(title="Divergence Indicator", format=format.price, resolution="")
    len = input(title="RSI Period", minval=1, defval=14)
    src = input(title="RSI Source", defval=close)
    lbR = input(title="Pivot Lookback Right", defval=5)
    lbL = input(title="Pivot Lookback Left", defval=5)
    rangeUpper = input(title="Max of Lookback Range", defval=60)
    rangeLower = input(title="Min of Lookback Range", defval=5)
    plotBull = input(title="Plot Bullish", defval=true)
    plotHiddenBull = input(title="Plot Hidden Bullish", defval=false)
    plotBear = input(title="Plot Bearish", defval=true)
    plotHiddenBear = input(title="Plot Hidden Bearish", defval=false)
    bearColor = color.red
    bullColor = color.green
    hiddenBullColor = color.new(color.green, 80)
    hiddenBearColor = color.new(color.red, 80)
    textColor = color.white
    noneColor = color.new(color.white, 100)
    osc = rsi(src, len)
    
    plot(osc, title="RSI", linewidth=2, color=#8D1699)
    hline(50, title="Middle Line", linestyle=hline.style_dotted)
    obLevel = hline(70, title="Overbought", linestyle=hline.style_dotted)
    osLevel = hline(30, title="Oversold", linestyle=hline.style_dotted)
    fill(obLevel, osLevel, title="Background", color=#9915FF, transp=90)
    
    plFound = na(pivotlow(osc, lbL, lbR)) ? false : true
    phFound = na(pivothigh(osc, lbL, lbR)) ? false : true
    _inRange(cond) =>
    	bars = barssince(cond == true)
    	rangeLower <= bars and bars <= rangeUpper
    
    //------------------------------------------------------------------------------
    // Regular Bullish
    // Osc: Higher Low
    
    oscHL = osc[lbR] > valuewhen(plFound, osc[lbR], 1) and _inRange(plFound[1])
    
    // Price: Lower Low
    
    priceLL = low[lbR] < valuewhen(plFound, low[lbR], 1)
    bullCond = plotBull and priceLL and oscHL and plFound
    
    plot(
         plFound ? osc[lbR] : na,
         offset=-lbR,
         title="Regular Bullish",
         linewidth=2,
         color=(bullCond ? bullColor : noneColor),
         transp=0
         )
    
    plotshape(
    	 bullCond ? osc[lbR] : na,
    	 offset=-lbR,
    	 title="Regular Bullish Label",
    	 text=" Bull ",
    	 style=shape.labelup,
    	 location=location.absolute,
    	 color=bullColor,
    	 textcolor=textColor,
    	 transp=0
    	 )
    
    //------------------------------------------------------------------------------
    // Hidden Bullish
    // Osc: Lower Low
    
    oscLL = osc[lbR] < valuewhen(plFound, osc[lbR], 1) and _inRange(plFound[1])
    
    // Price: Higher Low
    
    priceHL = low[lbR] > valuewhen(plFound, low[lbR], 1)
    hiddenBullCond = plotHiddenBull and priceHL and oscLL and plFound
    
    plot(
    	 plFound ? osc[lbR] : na,
    	 offset=-lbR,
    	 title="Hidden Bullish",
    	 linewidth=2,
    	 color=(hiddenBullCond ? hiddenBullColor : noneColor),
    	 transp=0
    	 )
    
    plotshape(
    	 hiddenBullCond ? osc[lbR] : na,
    	 offset=-lbR,
    	 title="Hidden Bullish Label",
    	 text=" H Bull ",
    	 style=shape.labelup,
    	 location=location.absolute,
    	 color=bullColor,
    	 textcolor=textColor,
    	 transp=0
    	 )
    
    //------------------------------------------------------------------------------
    // Regular Bearish
    // Osc: Lower High
    
    oscLH = osc[lbR] < valuewhen(phFound, osc[lbR], 1) and _inRange(phFound[1])
    
    // Price: Higher High
    
    priceHH = high[lbR] > valuewhen(phFound, high[lbR], 1)
    
    bearCond = plotBear and priceHH and oscLH and phFound
    
    plot(
    	 phFound ? osc[lbR] : na,
    	 offset=-lbR,
    	 title="Regular Bearish",
    	 linewidth=2,
    	 color=(bearCond ? bearColor : noneColor),
    	 transp=0
    	 )
    
    plotshape(
    	 bearCond ? osc[lbR] : na,
    	 offset=-lbR,
    	 title="Regular Bearish Label",
    	 text=" Bear ",
    	 style=shape.labeldown,
    	 location=location.absolute,
    	 color=bearColor,
    	 textcolor=textColor,
    	 transp=0
    	 )
    
    //------------------------------------------------------------------------------
    // Hidden Bearish
    // Osc: Higher High
    
    oscHH = osc[lbR] > valuewhen(phFound, osc[lbR], 1) and _inRange(phFound[1])
    
    // Price: Lower High
    
    priceLH = high[lbR] < valuewhen(phFound, high[lbR], 1)
    
    hiddenBearCond = plotHiddenBear and priceLH and oscHH and phFound
    
    plot(
    	 phFound ? osc[lbR] : na,
    	 offset=-lbR,
    	 title="Hidden Bearish",
    	 linewidth=2,
    	 color=(hiddenBearCond ? hiddenBearColor : noneColor),
    	 transp=0
    	 )
    
    plotshape(
    	 hiddenBearCond ? osc[lbR] : na,
    	 offset=-lbR,
    	 title="Hidden Bearish Label",
    	 text=" H Bear ",
    	 style=shape.labeldown,
    	 location=location.absolute,
    	 color=bearColor,
    	 textcolor=textColor,
    	 transp=0
    	 )

    Can I please request you to convert this pinescript to PRT?
    I would have done it with me beginner’s knowledge, but I got stuck with codes like – “valuewhen”

    2020-11-03_1825.png 2020-11-03_1825.png
    #149438 quote
    NicolasNicolas
    Keymaster
    Legend

    The “valuewhen” instruction is not available in ProBuilder programming language. Something similar will be added in an upcoming new instructions package for PRT v11.

    valuewhen(condition, source, occurrence)

    It returns the “Source” value when “condition” was true on the “occurrence” number. So you have to make a loop in order to get the value.

Viewing 2 posts - 1 through 2 (of 2 total)
  • You must be logged in to reply to this topic.

ProRealAI ProRealAI New

Stuck on this ProBuilder code?

Describe what this topic is trying to build, in plain English, and ProRealAI writes the ProRealTime™ indicator, screener or system for you.

Available in 7 languages
Try ProRealAI

Divergence Indicator


ProBuilder: Indicators & Custom Tools

New Reply
Author
author-avatar
boonet @boonet Participant
Summary

This topic contains 1 reply,
has 2 voices, and was last updated by NicolasNicolas

5 years, 11 months ago.

Topic Details
Forum: ProBuilder: Indicators & Custom Tools
Language: English
Started: 11/03/2020
Status: Active
Attachments: 1 files
ProRealCode ProRealCode
Loading...

