Dessin multiframe

Viewing 3 posts - 1 through 3 (of 3 total)
  • Author
    Posts
  • #249118 quote
    larouedegannlarouedegann
    Participant
    Master

    Bonjour à tous,

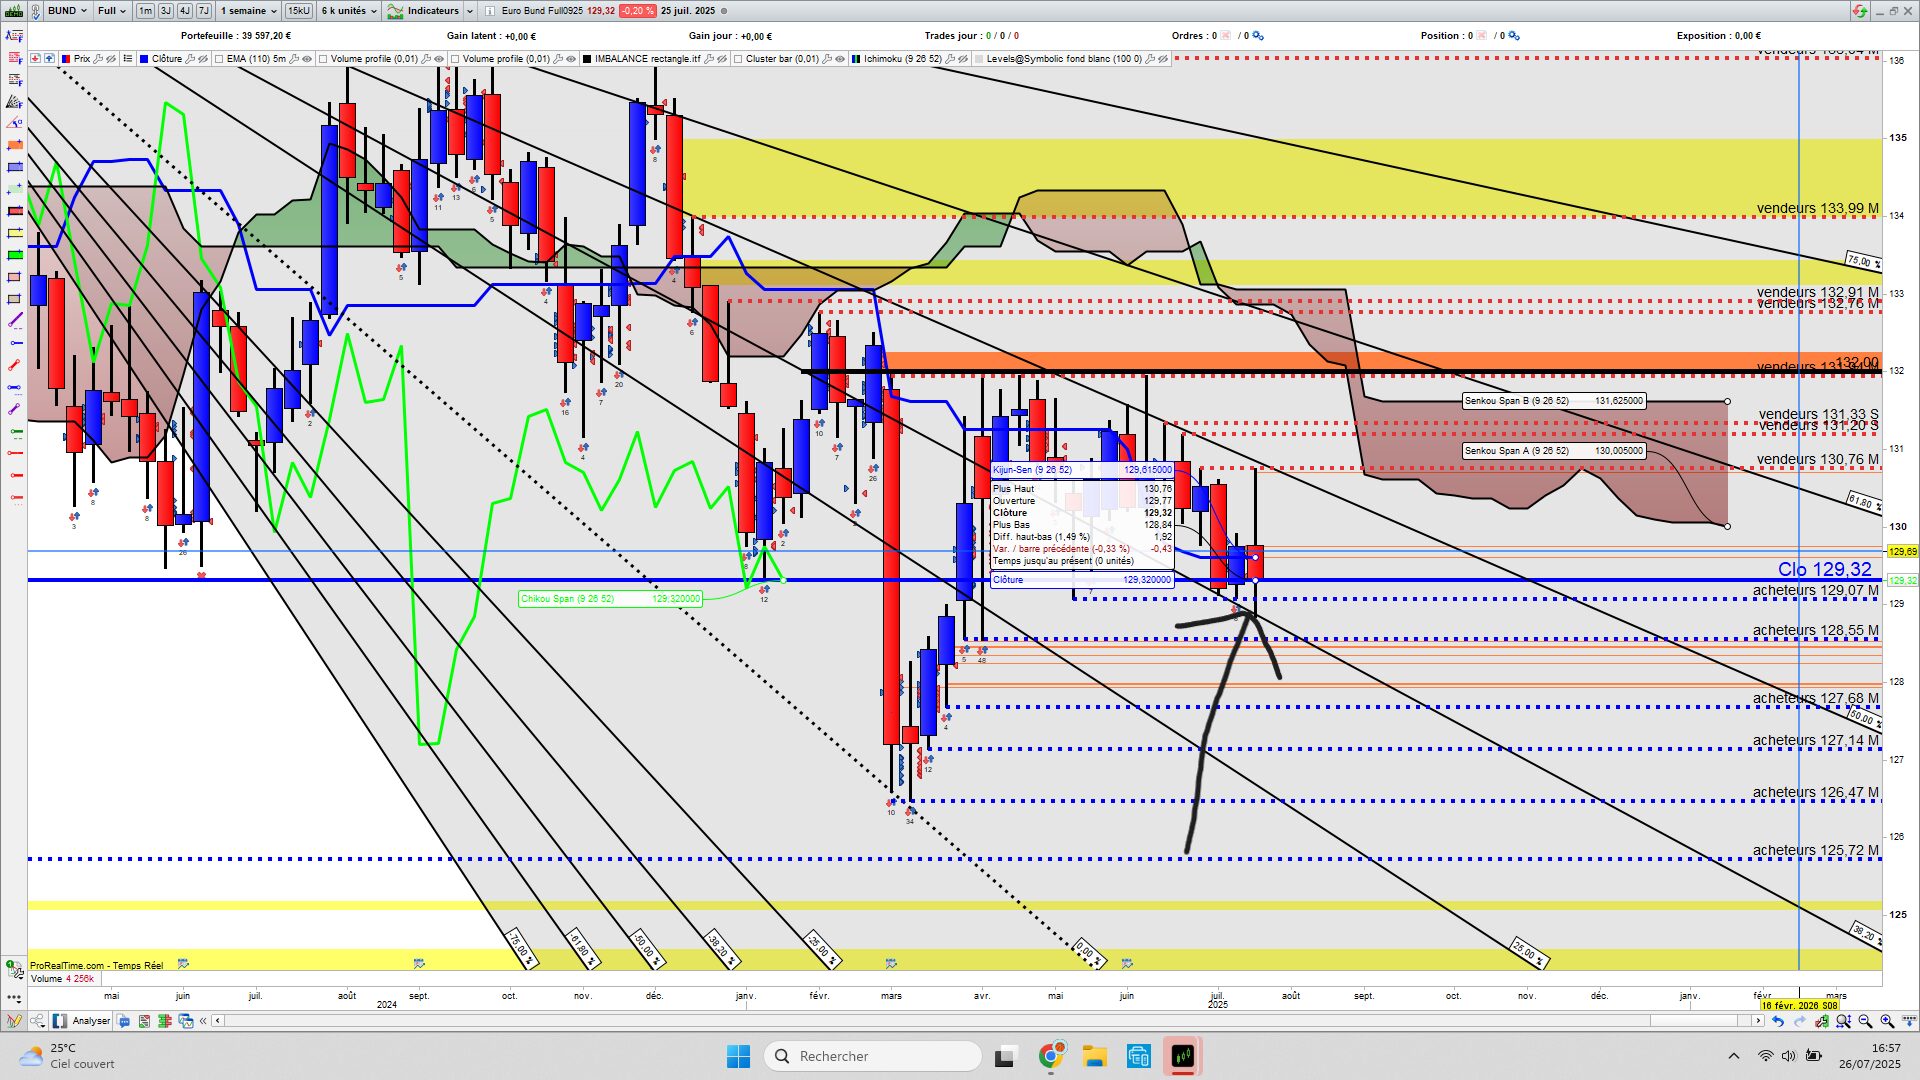
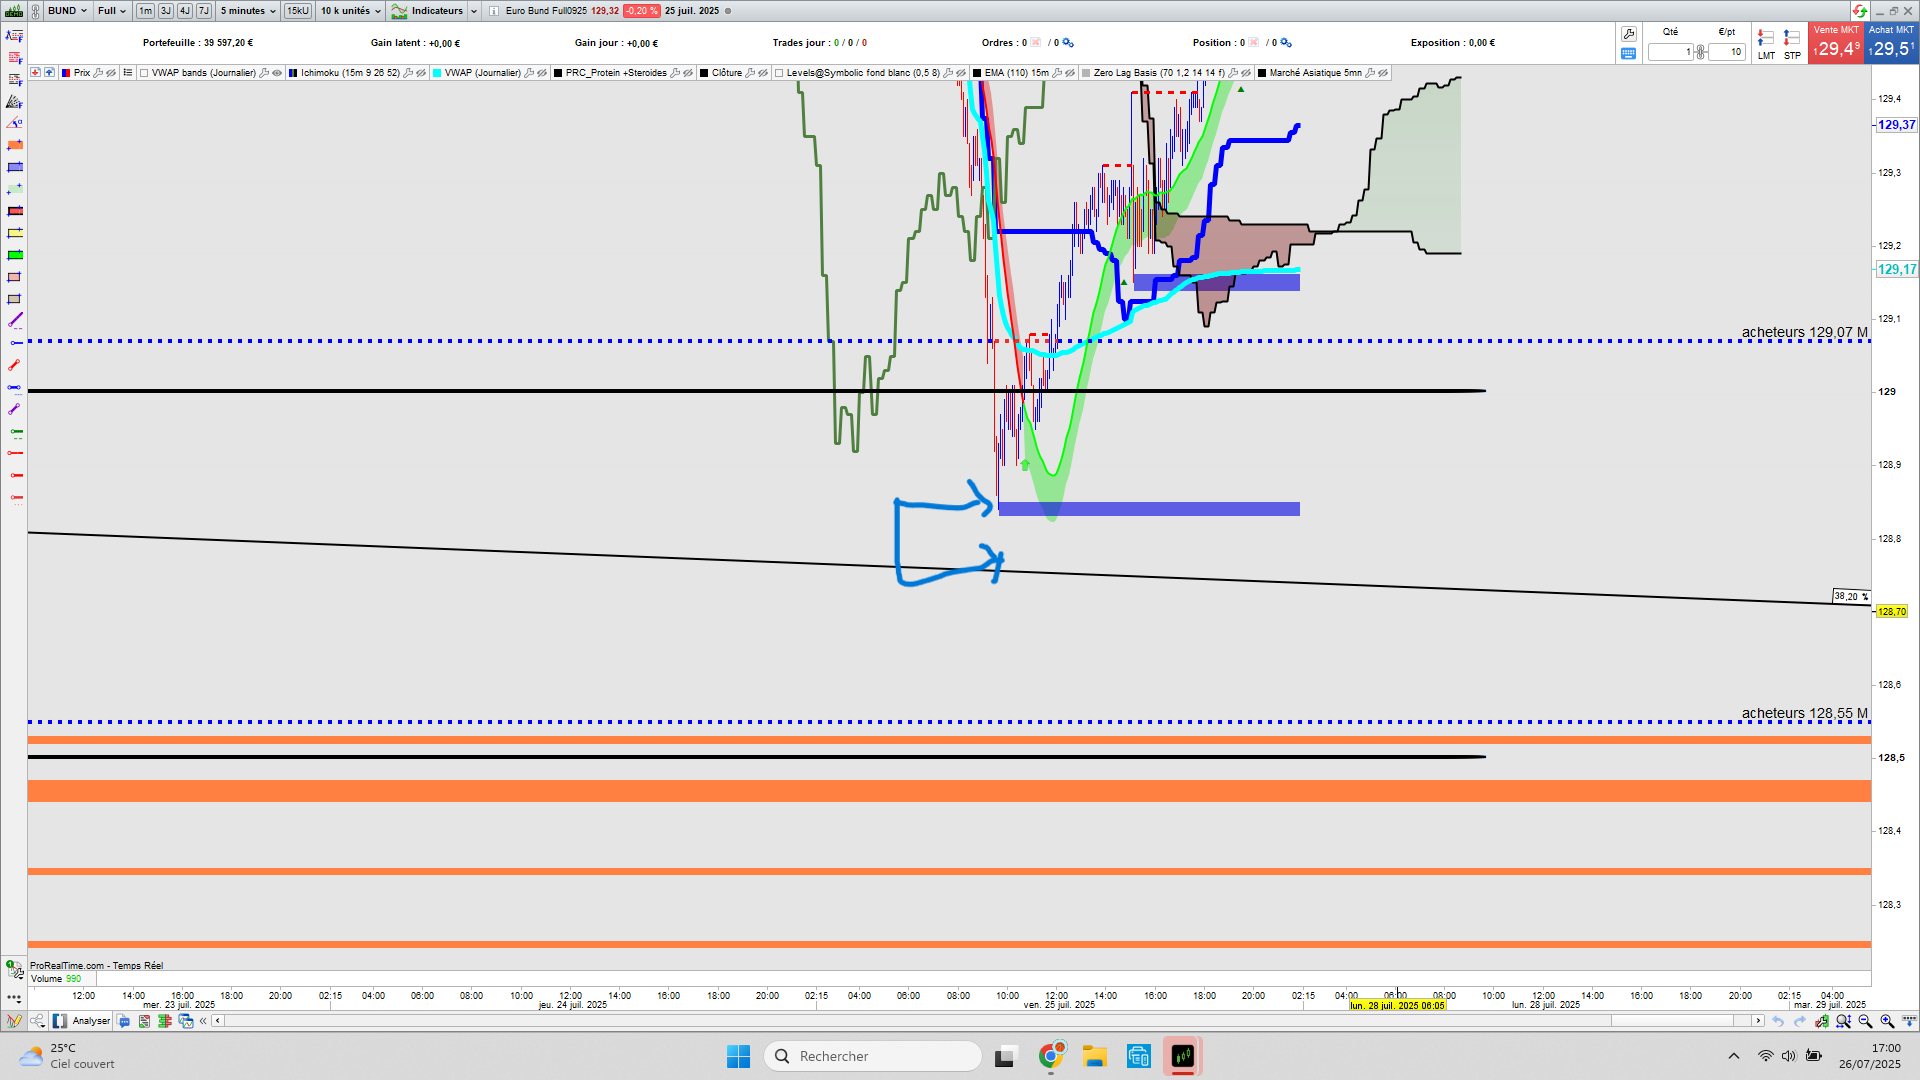
    je vous joint ci-dessous deux graphiques (semaine et 5 minutes) sur lesquelles j’ai dessiné un éventail de fibonacci.

    Quel n’est pas ma surprise de voir un décalage entre les deux graphiques de 10 pips sur le plus bas. J’ai cherché mais pas trouvé un éventail commun à tous

    les timeframes.

    merci de vos réponses

    Capture-decran-2025-07-26-165729.jpg Capture-decran-2025-07-26-165729.jpg Capture-decran-2025-07-26-170047.png Capture-decran-2025-07-26-170047.png
    #249143 quote
    Iván GonzálezIván González
    Moderator
    Legend

    Bonjour, je ne suis pas sûr d’avoir bien compris la question.
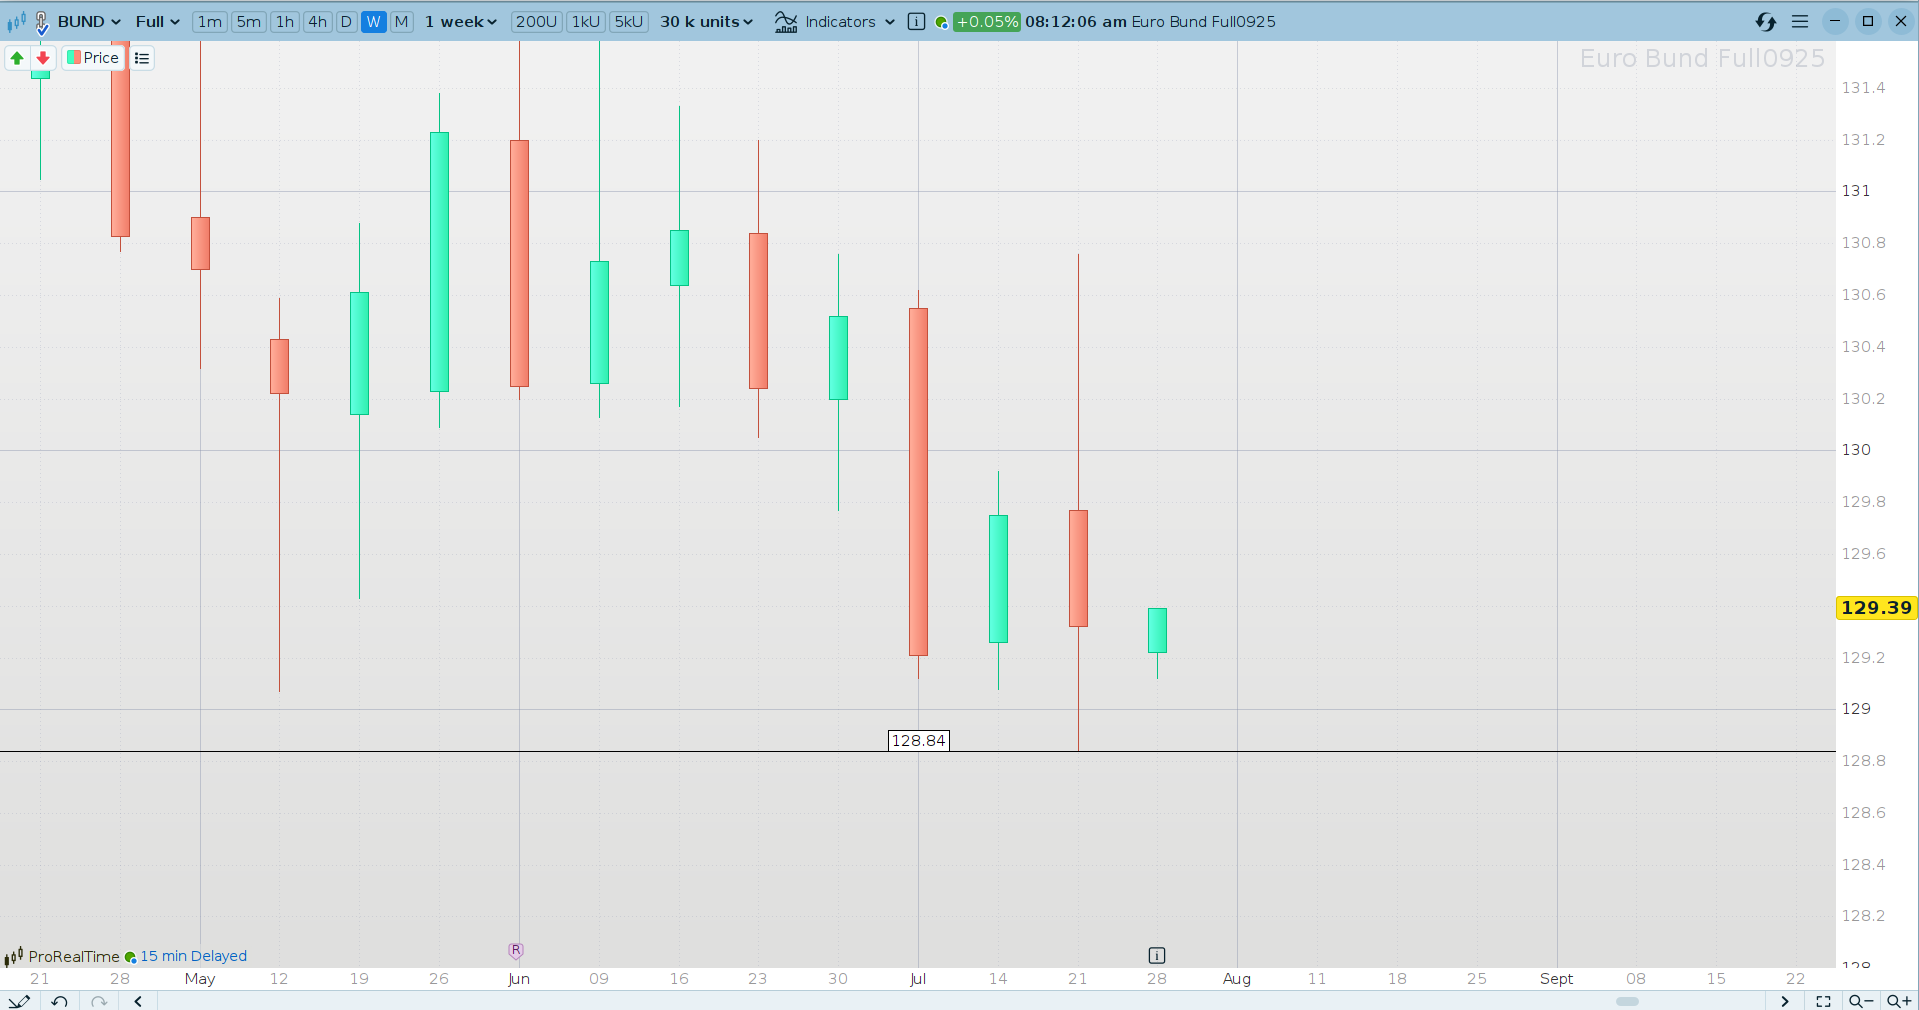
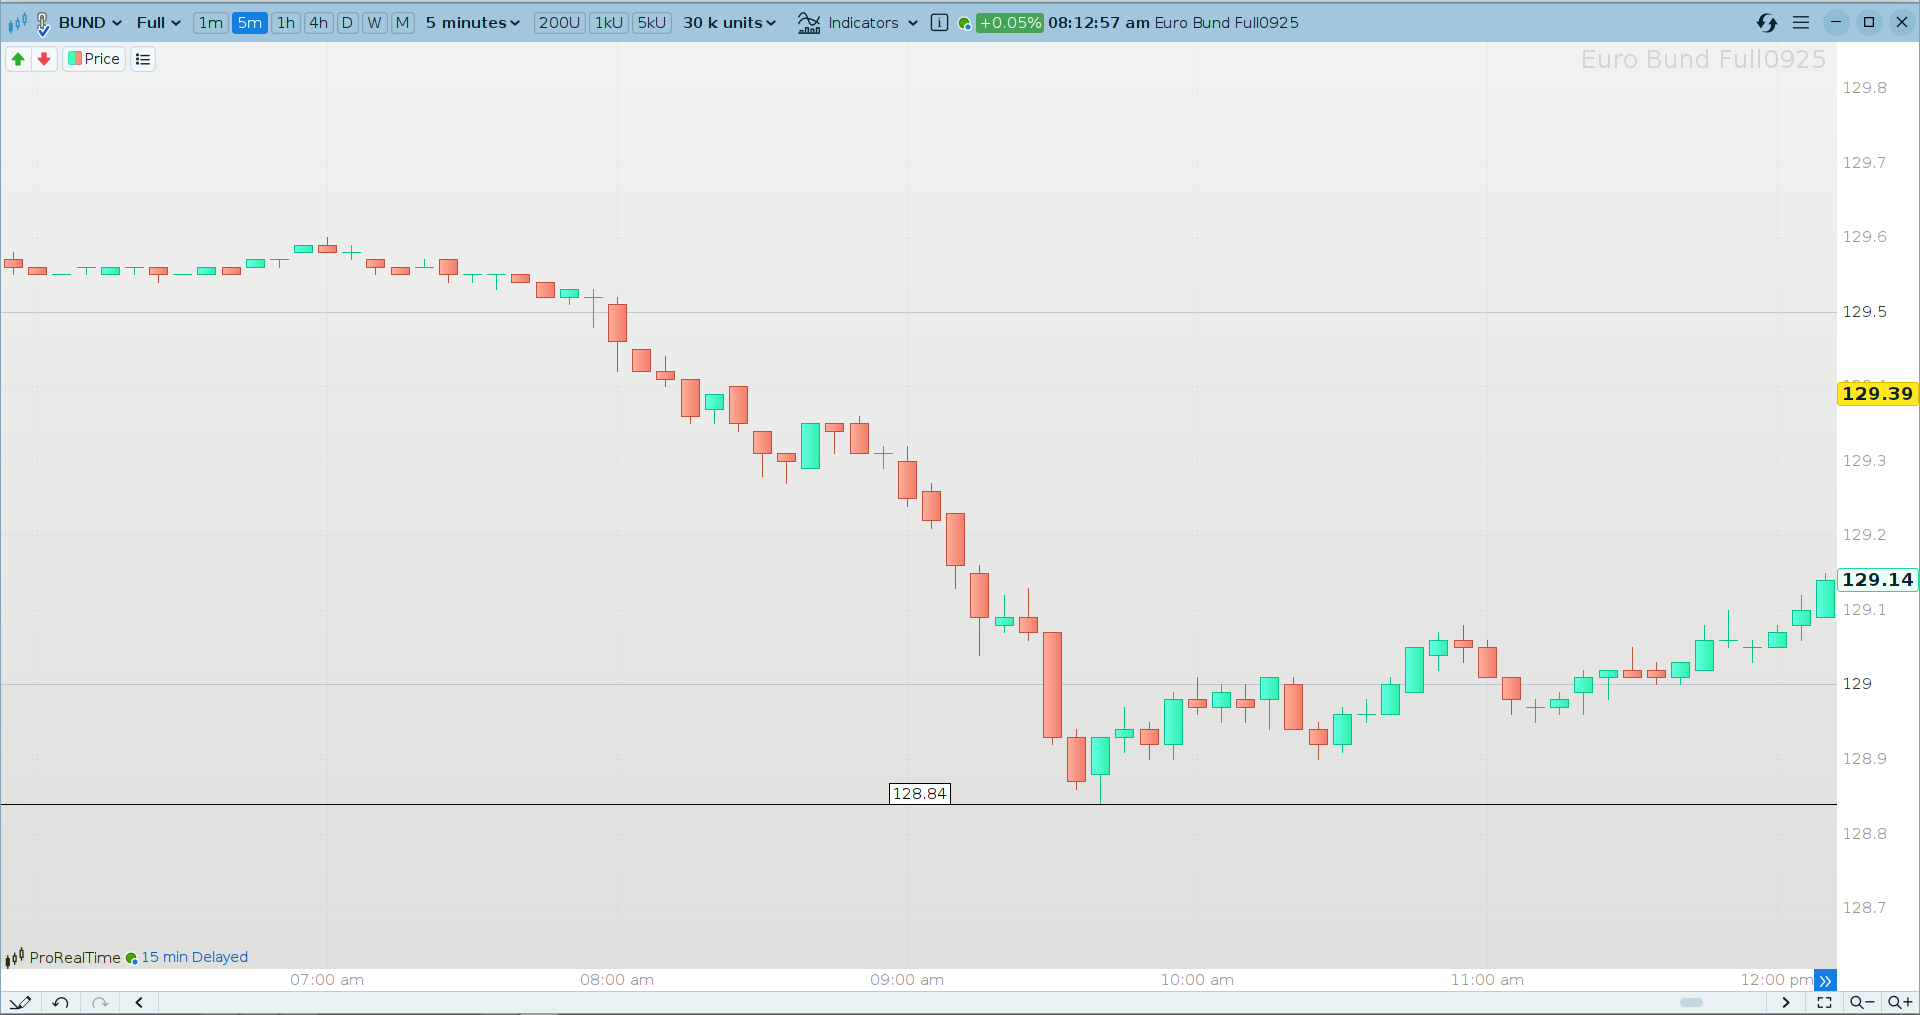
    En regardant le graphique, je ne vois pas de différence entre le plus bas de la semaine sur le graphique hebdomadaire et celui en 5 minutes.
    Je joins des images en hebdomadaire et en 5 minutes.

    2025-07-28_08-26.png 2025-07-28_08-26.png 2025-07-28_08-27.png 2025-07-28_08-27.png
    #249172 quote
    larouedegannlarouedegann
    Participant
    Master

    Je parlais de l’éventail de fibonacci à 38,20 % qui descend.

Viewing 3 posts - 1 through 3 (of 3 total)
  • You must be logged in to reply to this topic.

ProRealAI ProRealAI New

Stuck on this ProBuilder code?

Describe what this topic is trying to build, in plain English, and ProRealAI writes the ProRealTime™ indicator, screener or system for you.

Available in 7 languages
Try ProRealAI

Dessin multiframe


ProBuilder : Indicateurs & Outils Personnalisés

New Reply
Author
Summary

This topic contains 2 replies,
has 2 voices, and was last updated by larouedegannlarouedegann
1 year, 1 month ago.

Topic Details
Forum: ProBuilder : Indicateurs & Outils Personnalisés
Language: French
Started: 07/26/2025
Status: Active
Attachments: 4 files
ProRealCode ProRealCode
Loading...