Daily Range boxes at three different time periods in one indicator Tradingview

Viewing 7 posts - 1 through 7 (of 7 total)
  • Author
    Posts
  • #206002 quote
    TraderGlynTraderGlyn
    Participant
    Senior
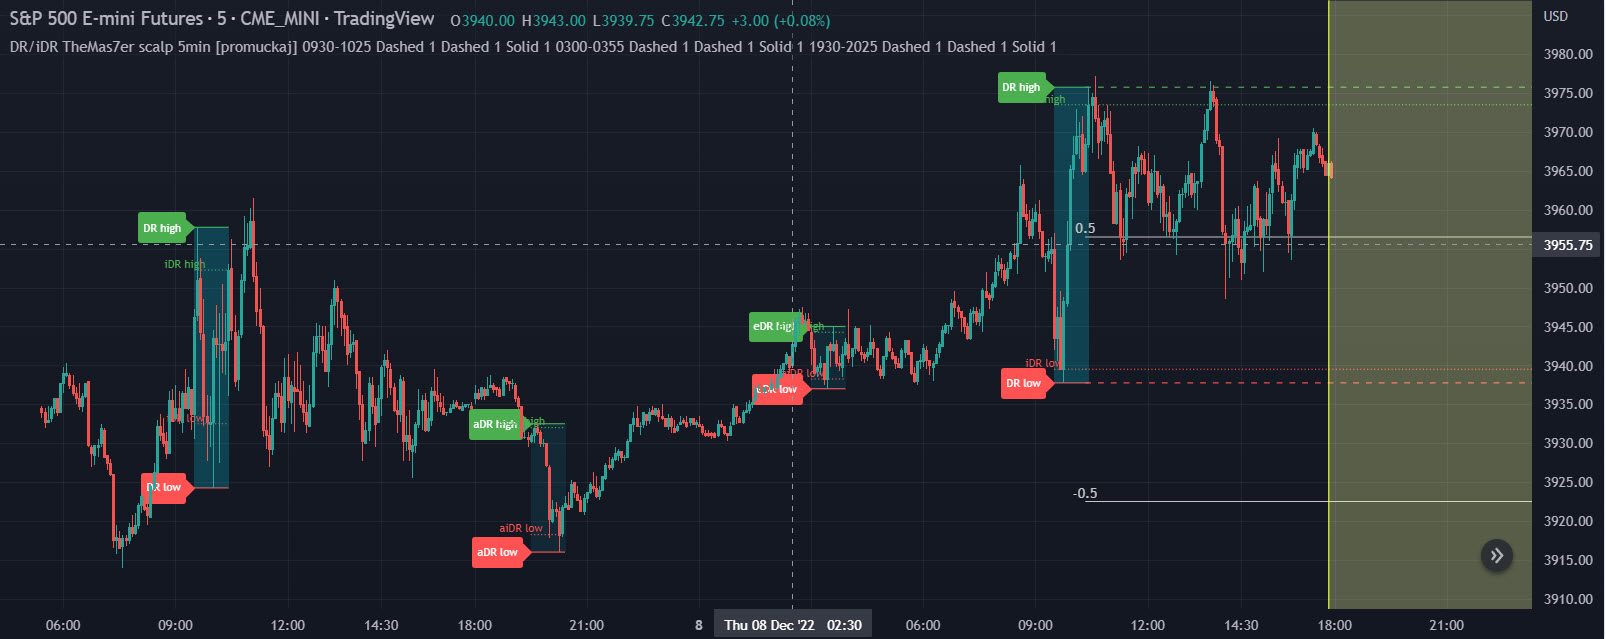
    Hi, I would be most grateful if this indicator could be coded for PRT or if not feedback as to how to create something with a similar function. It creates three range boxes at three different hourly  periods within 24h ( 0930-1025,0300-0355, 1930-2025) highlighting the high and low of price and within each box the highest candle close is marked with a dotted line. Lines extend forward from the high and low into following time periods and includes options to adjust time range, colours, style labels and lines. Thanks!
    tradingview-TheMas7er-scalp-.jpg tradingview-TheMas7er-scalp-.jpg Tradingview-indicator-DR-iDR-TheMas7er-scalp-5min.txt
    #206018 quote
    TraderGlynTraderGlyn
    Participant
    Senior
    I also have the NT8 code for this, if that is better to look at.
    #206107 quote
    JSJS
    Participant
    Master

    Hi @TraderGlyn

    I can draw the three “range boxes” at the different times but the lines are a problem (for me?) because the lines can be drawn but once drawn they can not be removed in PRT…

    Maybe a start…

    Regards Jaap

    If IntraDayBarIndex = 0 then
    x0300=0
    x0930=0
    x1930=0
    EndIf
    If OpenTime = 035500 and x0300=0 then
    HH = Highest[12](High)
    LL = Lowest[12](Low)
    xBarIndex = BarIndex
    DrawRectangle(xBarIndex-11,LL,xBarIndex,HH) Coloured(0,255,0)
    DrawSegment(xBarIndex-12,HH,xBarIndex,HH)Coloured(0,255,0)
    DrawSegment(xBarIndex-12,LL,xBarIndex,LL)Coloured(255,0,0)
    DrawText("High=#HH#",xBarIndex-12,HH+5*pipsize)Coloured(0,255,0)
    DrawText("Low=#LL#",xBarIndex-12,LL-5*pipsize)Coloured(255,0,0)
    //DrawRay(xBarIndex,HH,xBarIndex+1,HH)Coloured(0,255,0)Style(DottedLine)
    //DrawRay(xBarIndex,LL,xBarIndex+1,LL)Coloured(255,0,0)Style(DottedLine)
    x0300=1
    EndIf
    
    If OpenTime = 102500 and x0930=0 then
    HH = Highest[12](High)
    LL = Lowest[12](Low)
    xBarIndex = BarIndex
    DrawRectangle(xBarIndex-11,LL,xBarIndex,HH) Coloured(0,255,0)
    DrawSegment(xBarIndex-12,HH,xBarIndex,HH)Coloured(0,255,0)
    DrawSegment(xBarIndex-12,LL,xBarIndex,LL)Coloured(255,0,0)
    DrawText("High=#HH#",xBarIndex-12,HH+5*pipsize)Coloured(0,255,0)
    DrawText("Low=#LL#",xBarIndex-12,LL-5*pipsize)Coloured(255,0,0)
    //DrawRay(xBarIndex,HH,xBarIndex+1,HH)Coloured(0,255,0)Style(DottedLine)
    //DrawRay(xBarIndex,LL,xBarIndex+1,LL)Coloured(255,0,0)Style(DottedLine)
    x0930=1
    EndIf
    
    If OpenTime = 202500 and x1930=0 then
    HH = Highest[12](High)
    LL = Lowest[12](Low)
    xBarIndex = BarIndex
    DrawRectangle(xBarIndex-11,LL,xBarIndex,HH) Coloured(0,255,0)
    DrawSegment(xBarIndex-12,HH,xBarIndex,HH)Coloured(0,255,0)
    DrawSegment(xBarIndex-12,LL,xBarIndex,LL)Coloured(255,0,0)
    DrawText("High=#HH#",xBarIndex-12,HH+5*pipsize)Coloured(0,255,0)
    DrawText("Low=#LL#",xBarIndex-12,LL-5*pipsize)Coloured(255,0,0)
    //DrawRay(xBarIndex,HH,xBarIndex+1,HH)Coloured(0,255,0)Style(DottedLine)
    //DrawRay(xBarIndex,LL,xBarIndex+1,LL)Coloured(255,0,0)Style(DottedLine)
    x1930=1
    EndIf
    Return
    TraderGlyn and Nicolas thanked this post
    Scherm­afbeelding-2022-12-20-om-22.24.51.png Scherm­afbeelding-2022-12-20-om-22.24.51.png Scherm­afbeelding-2022-12-20-om-22.30.13.png Scherm­afbeelding-2022-12-20-om-22.30.13.png
    #206999 quote
    TraderGlynTraderGlyn
    Participant
    Senior
    This has proven very useful and is a great “start” thank you very much indeed. I enquired about getting the complete code created by PRT but unfortunately the cost is prohibitive for me at this time. One issue I am totally baffled about… I am trying to get the range box to appear on other time frames, particularly the 1 minute. I have studied the probuilder documents and cannot work out how to make this happen. It could be it is not possible but I thought that multi time frame adaptations was available now? Would greatly appreciate any solution.
    #207005 quote
    JSJS
    Participant
    Master
    Hi @TraderGlyn I will have a look and let you know…
    #207014 quote
    JSJS
    Participant
    Master

    Hi @TraderGlyn

    Here is the indicator for use in a time frame of 5 minutes and a time frame of 1 minute…

    Officially they are not multiple time frames because drawn objects in multiple time frames cause problems (with me?) but I solved it in a different way with “GetTimeFrame”…

     
    If IntraDayBarIndex = 0 then
    x0300=0
    x0930=0
    x1930=0
    EndIf
    
    xTF = GetTimeFrame
    
    If xTF=300 then
    If OpenTime = 035500 and x0300=0 then
    HH = Highest[11](High)
    LL = Lowest[11](Low)
    xBarIndex = BarIndex
    DrawRectangle(xBarIndex-11,LL,xBarIndex,HH) Coloured(0,255,0)
    DrawSegment(xBarIndex-12,HH,xBarIndex,HH)Coloured(0,255,0)
    DrawSegment(xBarIndex-12,LL,xBarIndex,LL)Coloured(255,0,0)
    DrawText("High=#HH#",xBarIndex-12,HH+5*pipsize)Coloured(0,255,0)
    DrawText("Low=#LL#",xBarIndex-12,LL-5*pipsize)Coloured(255,0,0)
    //DrawRay(xBarIndex,HH,xBarIndex+1,HH)Coloured(0,255,0)Style(DottedLine)
    //DrawRay(xBarIndex,LL,xBarIndex+1,LL)Coloured(255,0,0)Style(DottedLine)
    x0300=1
    EndIf
    
    If OpenTime = 102500 and x0930=0 then
    HH = Highest[11](High)
    LL = Lowest[11](Low)
    xBarIndex = BarIndex
    DrawRectangle(xBarIndex-11,LL,xBarIndex,HH) Coloured(0,255,0)
    DrawSegment(xBarIndex-12,HH,xBarIndex,HH)Coloured(0,255,0)
    DrawSegment(xBarIndex-12,LL,xBarIndex,LL)Coloured(255,0,0)
    DrawText("High=#HH#",xBarIndex-12,HH+5*pipsize)Coloured(0,255,0)
    DrawText("Low=#LL#",xBarIndex-12,LL-5*pipsize)Coloured(255,0,0)
    //DrawRay(xBarIndex,HH,xBarIndex+1,HH)Coloured(0,255,0)Style(DottedLine)
    //DrawRay(xBarIndex,LL,xBarIndex+1,LL)Coloured(255,0,0)Style(DottedLine)
    x0930=1
    EndIf
    
    If OpenTime = 202500 and x1930=0 then
    HH = Highest[11](High)
    LL = Lowest[11](Low)
    xBarIndex = BarIndex
    DrawRectangle(xBarIndex-11,LL,xBarIndex,HH) Coloured(0,255,0)
    DrawSegment(xBarIndex-12,HH,xBarIndex,HH)Coloured(0,255,0)
    DrawSegment(xBarIndex-12,LL,xBarIndex,LL)Coloured(255,0,0)
    DrawText("High=#HH#",xBarIndex-12,HH+5*pipsize)Coloured(0,255,0)
    DrawText("Low=#LL#",xBarIndex-12,LL-5*pipsize)Coloured(255,0,0)
    //DrawRay(xBarIndex,HH,xBarIndex+1,HH)Coloured(0,255,0)Style(DottedLine)
    //DrawRay(xBarIndex,LL,xBarIndex+1,LL)Coloured(255,0,0)Style(DottedLine)
    x1930=1
    EndIf
    EndIf
    
    If xTF=60 then
    If OpenTime = 035500 and x0300=0 then
    HH = Highest[55](High)
    LL = Lowest[55](Low)
    xBarIndex = BarIndex
    DrawRectangle(xBarIndex-55,LL,xBarIndex,HH) Coloured(0,255,0)
    DrawSegment(xBarIndex-60,HH,xBarIndex,HH)Coloured(0,255,0)
    DrawSegment(xBarIndex-60,LL,xBarIndex,LL)Coloured(255,0,0)
    DrawText("High=#HH#",xBarIndex-60,HH+5*pipsize)Coloured(0,255,0)
    DrawText("Low=#LL#",xBarIndex-60,LL-5*pipsize)Coloured(255,0,0)
    //DrawRay(xBarIndex,HH,xBarIndex+1,HH)Coloured(0,255,0)Style(DottedLine)
    //DrawRay(xBarIndex,LL,xBarIndex+1,LL)Coloured(255,0,0)Style(DottedLine)
    x0300=1
    EndIf
    
    If OpenTime = 102500 and x0930=0 then
    HH = Highest[55](High)
    LL = Lowest[55](Low)
    xBarIndex = BarIndex
    DrawRectangle(xBarIndex-55,LL,xBarIndex,HH) Coloured(0,255,0)
    DrawSegment(xBarIndex-60,HH,xBarIndex,HH)Coloured(0,255,0)
    DrawSegment(xBarIndex-60,LL,xBarIndex,LL)Coloured(255,0,0)
    DrawText("High=#HH#",xBarIndex-60,HH+5*pipsize)Coloured(0,255,0)
    DrawText("Low=#LL#",xBarIndex-60,LL-5*pipsize)Coloured(255,0,0)
    //DrawRay(xBarIndex,HH,xBarIndex+1,HH)Coloured(0,255,0)Style(DottedLine)
    //DrawRay(xBarIndex,LL,xBarIndex+1,LL)Coloured(255,0,0)Style(DottedLine)
    x0930=1
    EndIf
    
    If OpenTime = 202500 and x1930=0 then
    HH = Highest[55](High)
    LL = Lowest[55](Low)
    xBarIndex = BarIndex
    DrawRectangle(xBarIndex-55,LL,xBarIndex,HH) Coloured(0,255,0)
    DrawSegment(xBarIndex-60,HH,xBarIndex,HH)Coloured(0,255,0)
    DrawSegment(xBarIndex-60,LL,xBarIndex,LL)Coloured(255,0,0)
    DrawText("High=#HH#",xBarIndex-60,HH+5*pipsize)Coloured(0,255,0)
    DrawText("Low=#LL#",xBarIndex-60,LL-5*pipsize)Coloured(255,0,0)
    //DrawRay(xBarIndex,HH,xBarIndex+1,HH)Coloured(0,255,0)Style(DottedLine)
    //DrawRay(xBarIndex,LL,xBarIndex+1,LL)Coloured(255,0,0)Style(DottedLine)
    x1930=1
    EndIf
    EndIf
    Return
    TraderGlyn and Nicolas thanked this post
    Scherm­afbeelding-2023-01-07-om-21.45.50.png Scherm­afbeelding-2023-01-07-om-21.45.50.png Scherm­afbeelding-2023-01-07-om-21.45.29.png Scherm­afbeelding-2023-01-07-om-21.45.29.png
    #207053 quote
    TraderGlynTraderGlyn
    Participant
    Senior
    Hi JS, This is excellent and works perfectly! Thanks for being so generous with your time and skills, really appreciate.
    JS thanked this post
Viewing 7 posts - 1 through 7 (of 7 total)

  • You must be logged in to reply to this topic.

ProRealAI ProRealAI New

Stuck on this ProBuilder code?

Describe what this topic is trying to build, in plain English, and ProRealAI writes the ProRealTime™ indicator, screener or system for you.

Available in 7 languages
Try ProRealAI

Daily Range boxes at three different time periods in one indicator Tradingview


ProBuilder: Indicators & Custom Tools

New Reply
Author
author-avatar
TraderGlyn @traderglyn Participant
Summary

This topic contains 6 replies,
has 2 voices, and was last updated by TraderGlynTraderGlyn
3 years, 8 months ago.

Topic Details
Forum: ProBuilder: Indicators & Custom Tools
Language: English
Started: 12/18/2022
Status: Active
Attachments: 6 files
ProRealCode ProRealCode
Loading...