// This source code is subject to the terms of the Mozilla Public License 2.0 at https://mozilla.org/MPL/2.0/
// © LonesomeTheBlue

//@version=4
study("Support Resistance - Dynamic v2", "SRv2", overlay = true)
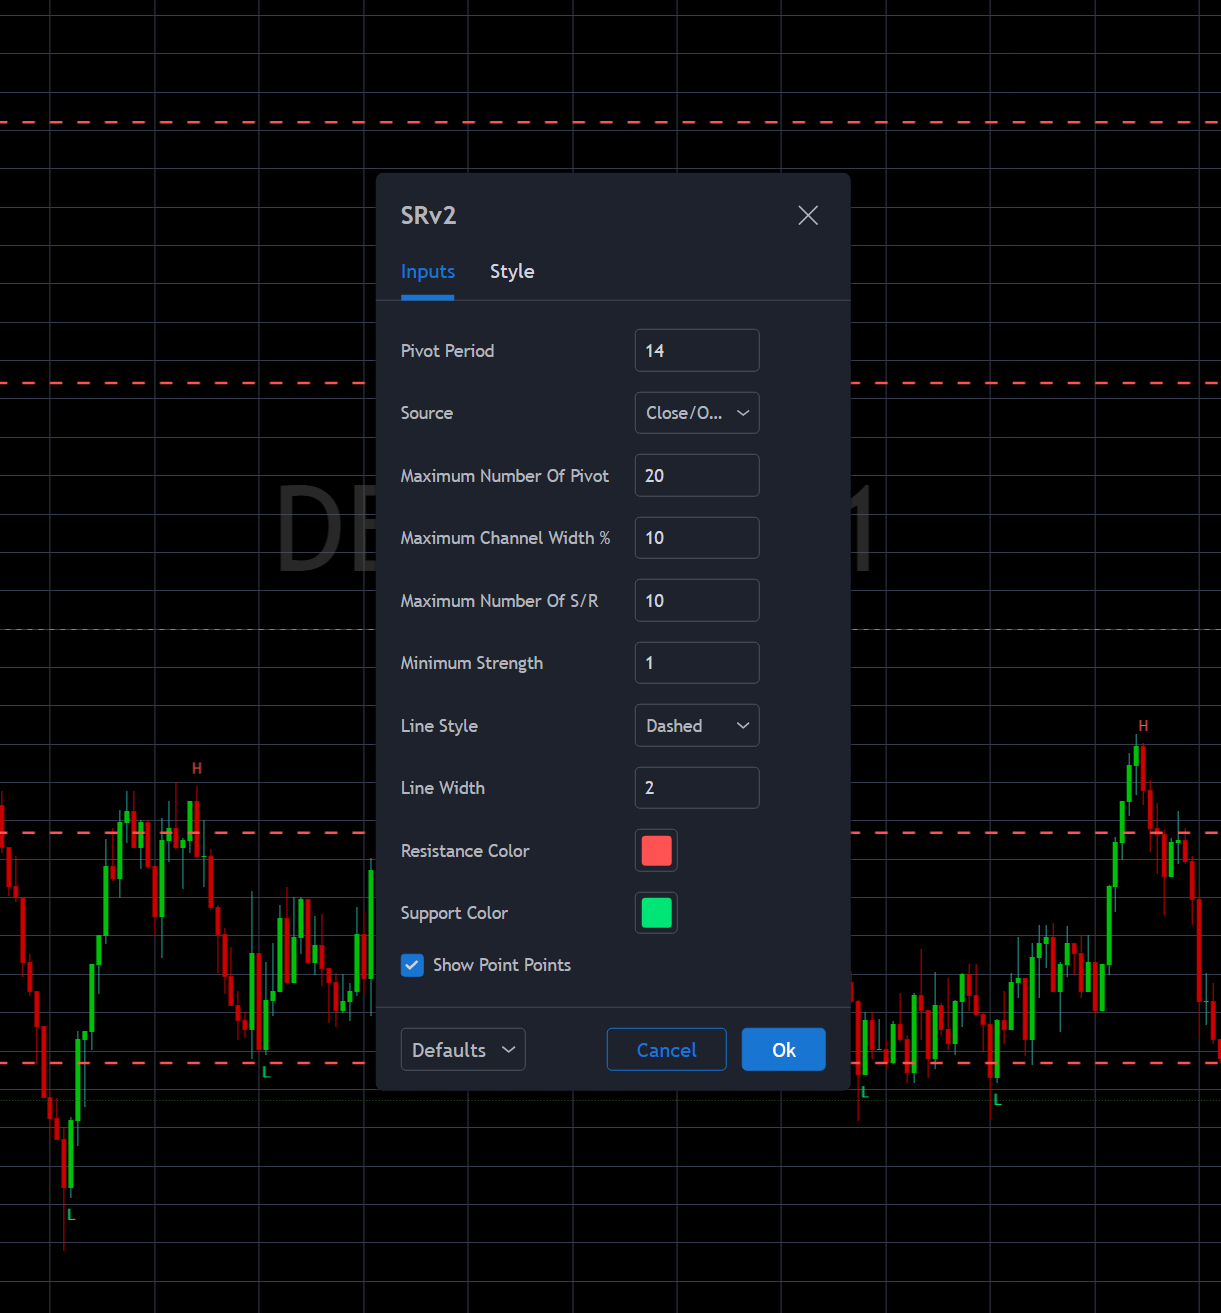
prd = input(defval = 10, title="Pivot Period", minval = 4, maxval = 30)
ppsrc = input(defval = 'High/Low', title="Source", options = ['High/Low', 'Close/Open'])
maxnumpp = input(defval = 20, title =" Maximum Number of Pivot", minval = 5, maxval = 100)
ChannelW = input(10, title = "Maximum Channel Width %", minval = 1)
maxnumsr = input(5, title =" Maximum Number of S/R", minval = 1, maxval = 10)
min_strength = input(2, title =" Minimum Strength", minval = 1, maxval = 10)
linestyle = input(defval = 'Dashed', title = "Line Style", options = ['Solid', 'Dotted', 'Dashed'])
linewidth = input(defval = 2, title = "Line Width", minval = 1, maxval = 4)
resistancecolor = input(defval = color.red, title = "Resistance Color", type = input.color)
supportcolor = input(defval = color.lime, title = "Support Color", type = input.color)
showpp = input(false, title = "Show Point Points")

float ph = na, float pl = na
float src1 =  ppsrc == 'High/Low' ? high : max(close, open)
float src2 =  ppsrc == 'High/Low' ? low: min(close, open)
ph := pivothigh(src1, prd, prd)
pl := pivotlow(src2, prd, prd)

plotshape(ph and showpp, text = "H",  style = shape.labeldown, color = na, textcolor = color.red, location = location.abovebar, transp = 0, offset = -prd)
plotshape(pl and showpp, text = "L",  style = shape.labelup, color = na, textcolor = color.lime, location = location.belowbar, transp = 0, offset = -prd)

//calculate maximum S/R channel zone width
prdhighest =  highest(300)
prdlowest = lowest(300)
cwidth = (prdhighest - prdlowest) * ChannelW / 100

var pivotvals= array.new_float(0)

if ph or pl
    array.unshift(pivotvals, ph ? ph : pl)
    if array.size(pivotvals) > maxnumpp // limit the array size
        array.pop(pivotvals)

get_sr_vals(ind)=>
    float lo = array.get(pivotvals, ind)
    float hi = lo
    int numpp = 0
    for y = 0 to array.size(pivotvals) - 1
        float cpp = array.get(pivotvals, y)
        float wdth = cpp <= lo ? hi - cpp : cpp - lo
        if wdth <= cwidth // fits the max channel width?
            lo := cpp <= lo ? cpp : lo
            hi := cpp > lo ? cpp : hi
            numpp := numpp + 1
    [hi, lo, numpp]

var sr_up_level = array.new_float(0)
var sr_dn_level = array.new_float(0)
sr_strength = array.new_float(0)

find_loc(strength)=>
    ret = array.size(sr_strength)
    if ret > 0
        for i = array.size(sr_strength) - 1 to 0
            if strength <= array.get(sr_strength, i)
                break
            ret := i
    ret

check_sr(hi, lo, strength)=>
    ret = true
    if array.size(sr_up_level) > 0
        for i = 0 to array.size(sr_up_level) - 1
            //included?
            if array.get(sr_up_level, i) >= lo and array.get(sr_up_level, i) <= hi  or
               array.get(sr_dn_level, i) >= lo and array.get(sr_dn_level, i) <= hi
                if strength >= array.get(sr_strength, i)
                    array.remove(sr_strength, i)
                    array.remove(sr_up_level, i)
                    array.remove(sr_dn_level, i)
                    ret
                else
                    ret := false
                break
    ret

//get min time
var int btime = time
btime := na(time[1]) ? btime : min(btime, time - time[1])

round_it(value)=>
    round(value / syminfo.mintick) * syminfo.mintick

draw_line(ycoor, Lstyle)=>
    line.new(x1 = bar_index,
             y1 = ycoor,
             x2 = bar_index - 1,
             y2 = ycoor,
             extend = extend.both,
             color = ycoor >= close ? resistancecolor : supportcolor,
             style = Lstyle,
             width = linewidth)

st = security(syminfo.tickerid, 'D', time)
cl = security(syminfo.tickerid, 'D', time_close)
opened = timenow > st and timenow < cl

draw_label(ycoor)=>
    rate = 100 * (ycoor - close) / close
    label.new(x = opened ? time + btime * 30 : time[100],
              y = ycoor, text = tostring(ycoor) + "(" + tostring(rate,'#.##') + "%)",
              color = ycoor >= close ? color.red : color.lime,
              textcolor = ycoor >= close ? color.white : color.black,
              style = ycoor >= close ? label.style_labeldown : label.style_labelup,
              xloc = xloc.bar_time,
              yloc = yloc.price)

set_lx(lab, lin)=>
    rate = 100 * (label.get_y(lab) - close) / close
    label.set_text(lab, text = tostring(label.get_y(lab)) + "(" + tostring(rate,'#.##') + "%)")
    label.set_x(lab, x = opened ? time + btime * 30 : time[100])
    label.set_color(lab, color = label.get_y(lab) >= close ? color.red : color.lime)
    label.set_textcolor(lab, textcolor = label.get_y(lab) >= close ? color.white : color.black)
    label.set_style(lab, style = label.get_y(lab) >= close ? label.style_labeldown : label.style_labelup)
    line.set_color(lin, color = line.get_y1(lin) >= close ? resistancecolor : supportcolor)

var line l1 = na, var line l2 = na, var line l3 = na, var line l4 = na, var line l5 = na, var line l6 = na, var line l7 = na, var line l8 = na, var line l9 = na, var line l10 = na
var label lb1 = na, var label lb2 = na, var label lb3 = na, var label lb4 = na, var label lb5 = na, var label lb6 = na, var label lb7 = na, var label lb8 = na, var label lb9 = na, var label lb10 = na

set_lx(lb1, l1), set_lx(lb2, l2), set_lx(lb3, l3), set_lx(lb4, l4), set_lx(lb5, l5), set_lx(lb6, l6), set_lx(lb7, l7), set_lx(lb8, l8), set_lx(lb9, l9), set_lx(lb10, l10)

if ph or pl
    //because of new calculation, remove old S/R levels
    array.clear(sr_up_level)
    array.clear(sr_dn_level)
    array.clear(sr_strength)
    //find S/R zones
    for x = 0 to array.size(pivotvals) - 1
        [hi, lo, strength] = get_sr_vals(x)
        if check_sr(hi, lo, strength)
            loc = find_loc(strength)
            // if strength is in first maxnumsr sr then insert it to the arrays
            if loc < maxnumsr and strength >= min_strength
                array.insert(sr_strength, loc, strength)
                array.insert(sr_up_level, loc, hi)
                array.insert(sr_dn_level, loc, lo)
                // keep size of the arrays = 5
                if array.size(sr_strength) > maxnumsr
                    array.pop(sr_strength)
                    array.pop(sr_up_level)
                    array.pop(sr_dn_level)

    line.delete(l1), line.delete(l2), line.delete(l3), line.delete(l4), line.delete(l5), line.delete(l6), line.delete(l7), line.delete(l8), line.delete(l9), line.delete(l10)
    label.delete(lb1), label.delete(lb2), label.delete(lb3), label.delete(lb4), label.delete(lb5), label.delete(lb6), label.delete(lb7), label.delete(lb8), label.delete(lb9), label.delete(lb10)
    if array.size(sr_up_level)
        Lstyle = linestyle == 'Dashed' ? line.style_dashed :
                 linestyle == 'Solid' ? line.style_solid :
                 line.style_dotted
        for x = 0 to array.size(sr_up_level) - 1
            float mid = round_it((array.get(sr_up_level, x) + array.get(sr_dn_level, x)) / 2)
            if x == 0
                l1 := draw_line(mid, Lstyle)
                lb1 := draw_label(mid)
            if x == 1
                l2 := draw_line(mid, Lstyle)
                lb2 := draw_label(mid)
            if x == 2
                l3 := draw_line(mid, Lstyle)
                lb3 := draw_label(mid)
            if x == 3
                l4 := draw_line(mid, Lstyle)
                lb4 := draw_label(mid)
            if x == 4
                l5 := draw_line(mid, Lstyle)
                lb5 := draw_label(mid)
            if x == 5
                l6 := draw_line(mid, Lstyle)
                lb6 := draw_label(mid)
            if x == 6
                l7 := draw_line(mid, Lstyle)
                lb7 := draw_label(mid)
            if x == 7
                l8 := draw_line(mid, Lstyle)
                lb8 := draw_label(mid)
            if x == 8
                l9 := draw_line(mid, Lstyle)
                lb9 := draw_label(mid)
            if x == 9
                l10 := draw_line(mid, Lstyle)
                lb10 := draw_label(mid)

f_crossed_over()=>
    ret = false
    if array.size(sr_up_level) > 0
        for x = 0 to array.size(sr_up_level) - 1
            float mid = round_it((array.get(sr_up_level, x) + array.get(sr_dn_level, x)) / 2)
            if close[1] <= mid and close > mid
                ret := true
    ret

f_crossed_under()=>
    ret = false
    if array.size(sr_up_level) > 0
        for x = 0 to array.size(sr_up_level) - 1
            float mid = round_it((array.get(sr_up_level, x) + array.get(sr_dn_level, x)) / 2)
            if close[1] >= mid and close < mid
                ret := true
    ret

alertcondition(f_crossed_over(), title='Resistance Broken', message='Resistance Broken')
alertcondition(f_crossed_under(), title='Support Broken', message='Support Broken')
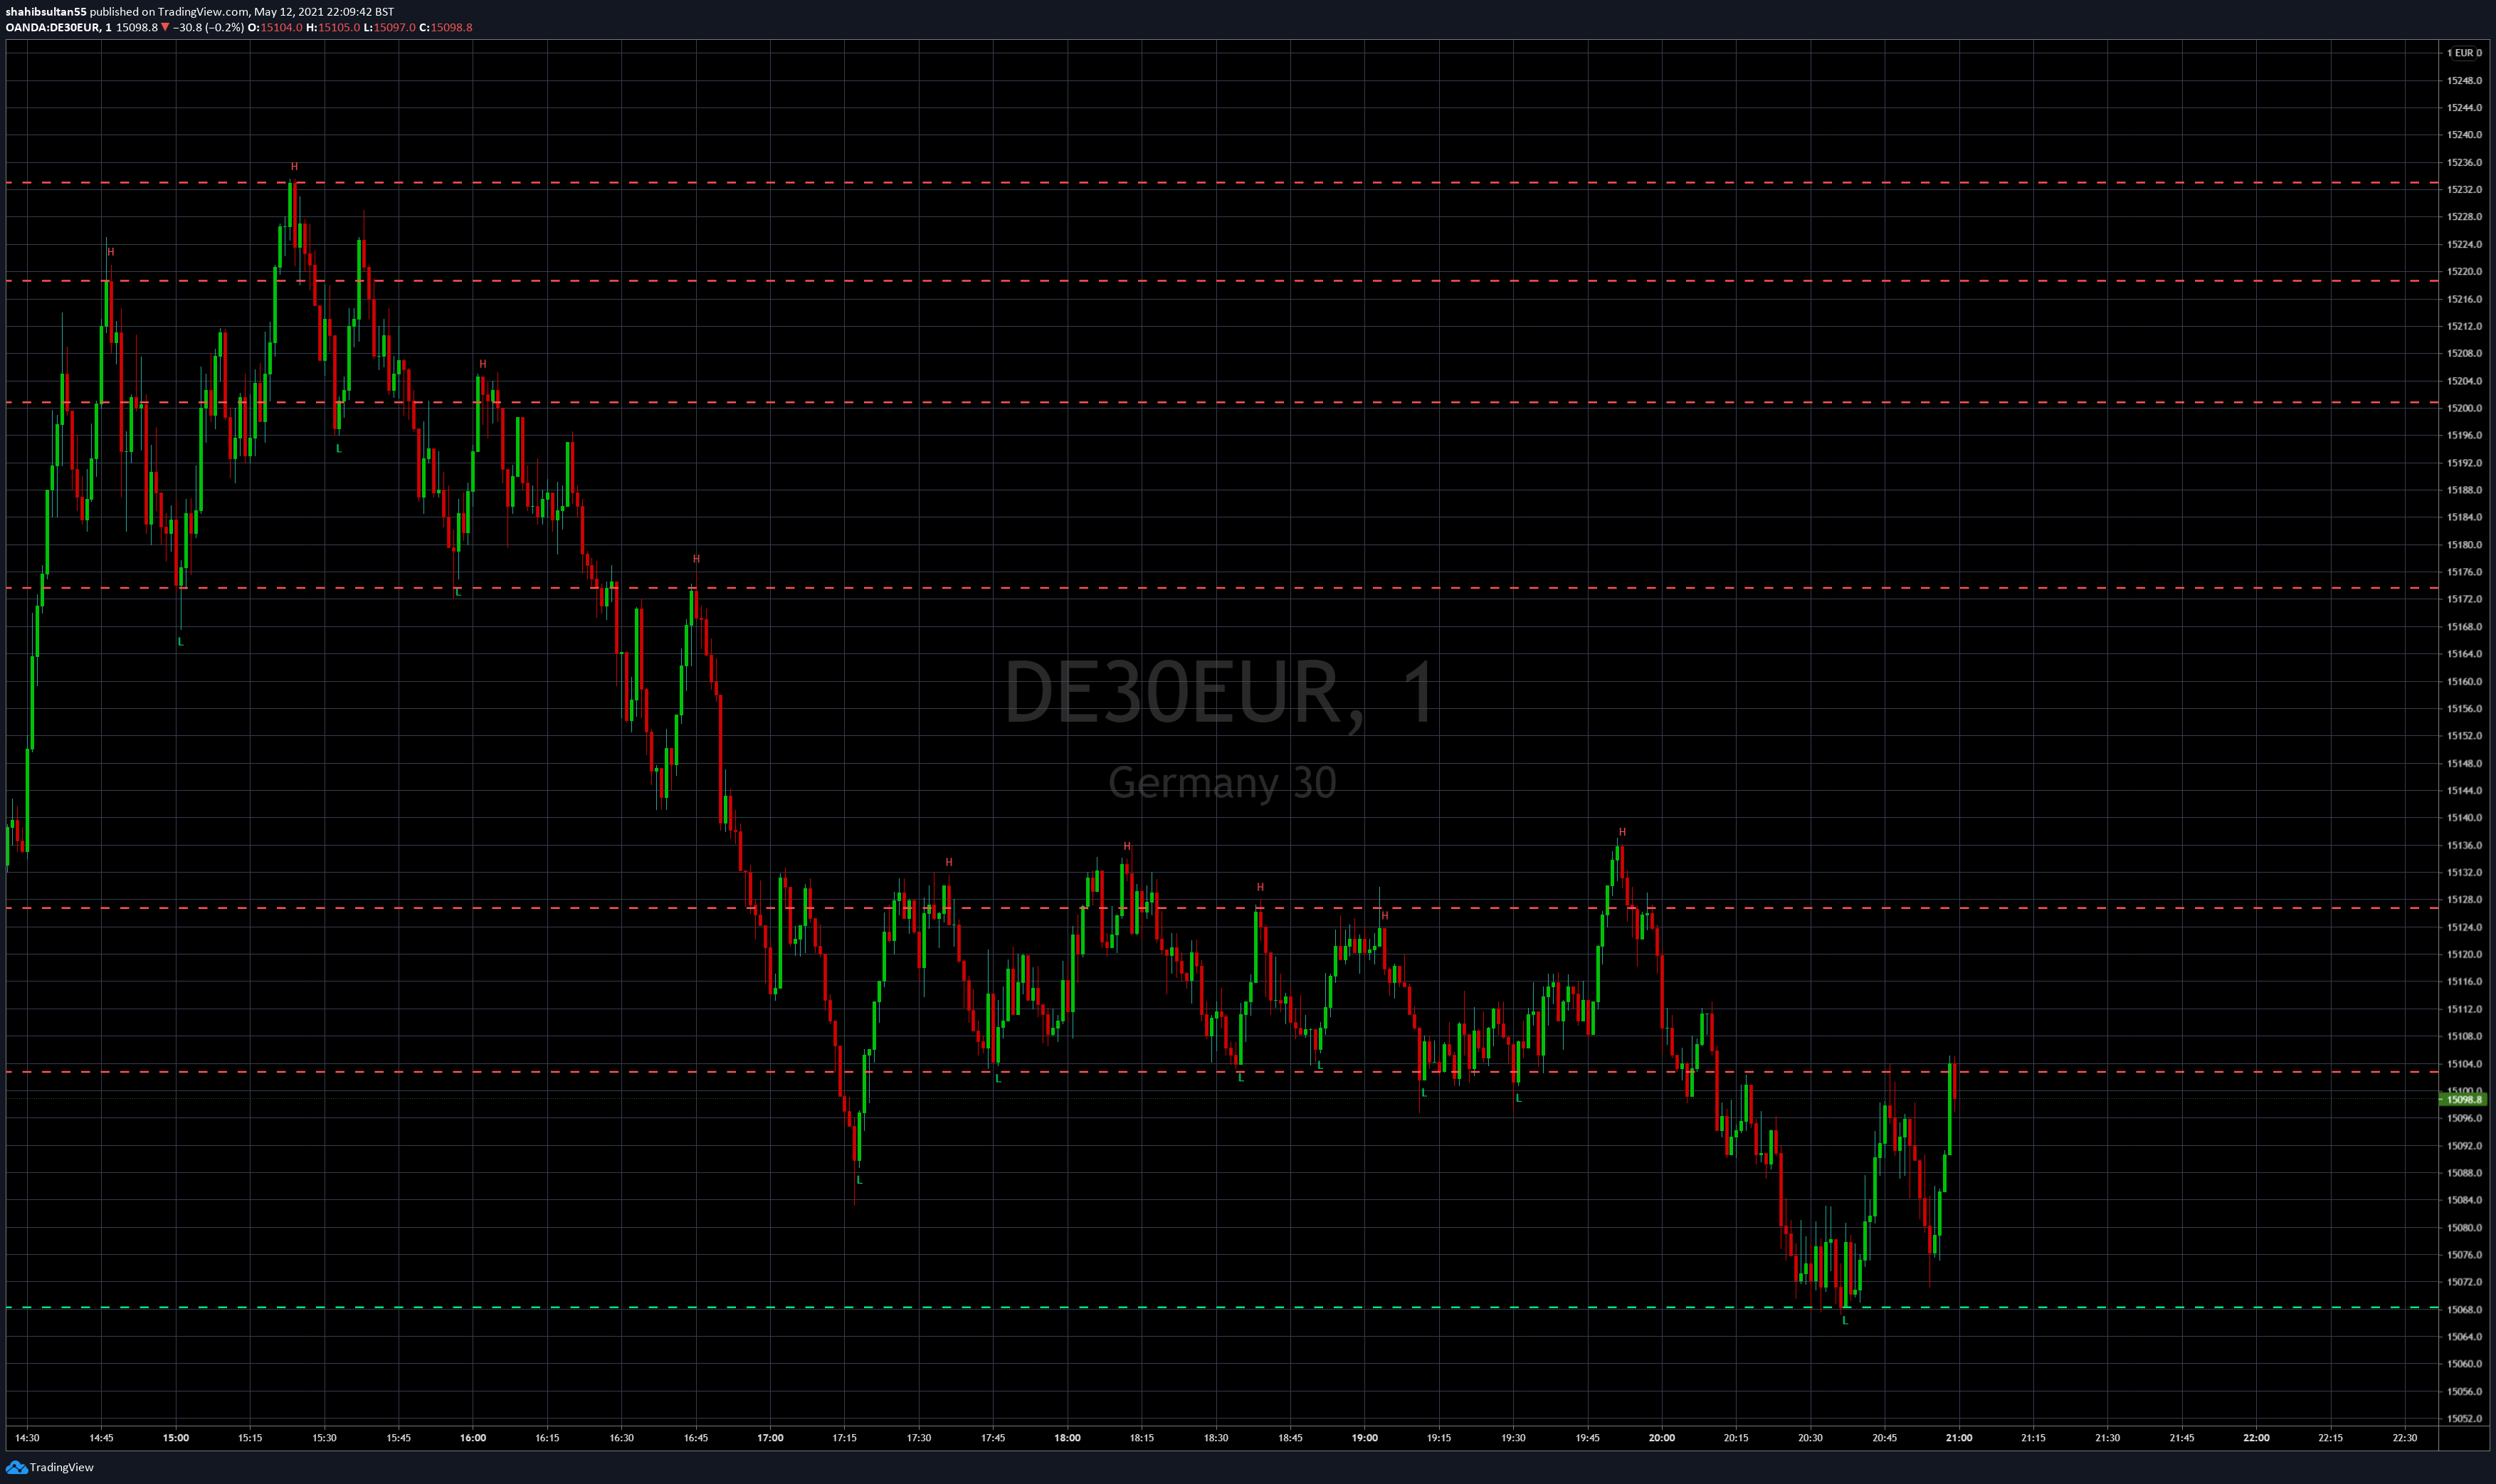
Is it possible to convert this indicator for use in prorealtime.
https://www.tradingview.com/script/va09eWAp-Support-Resistance-Dynamic-v2/