Hello,
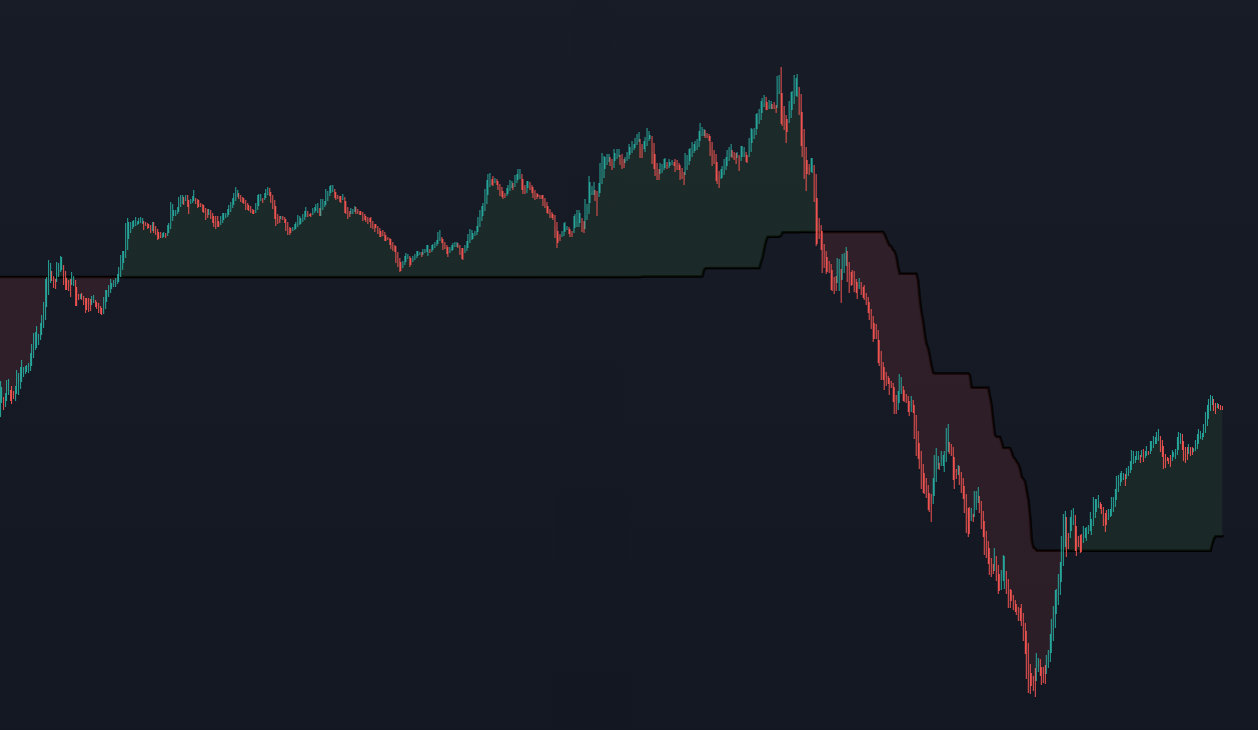
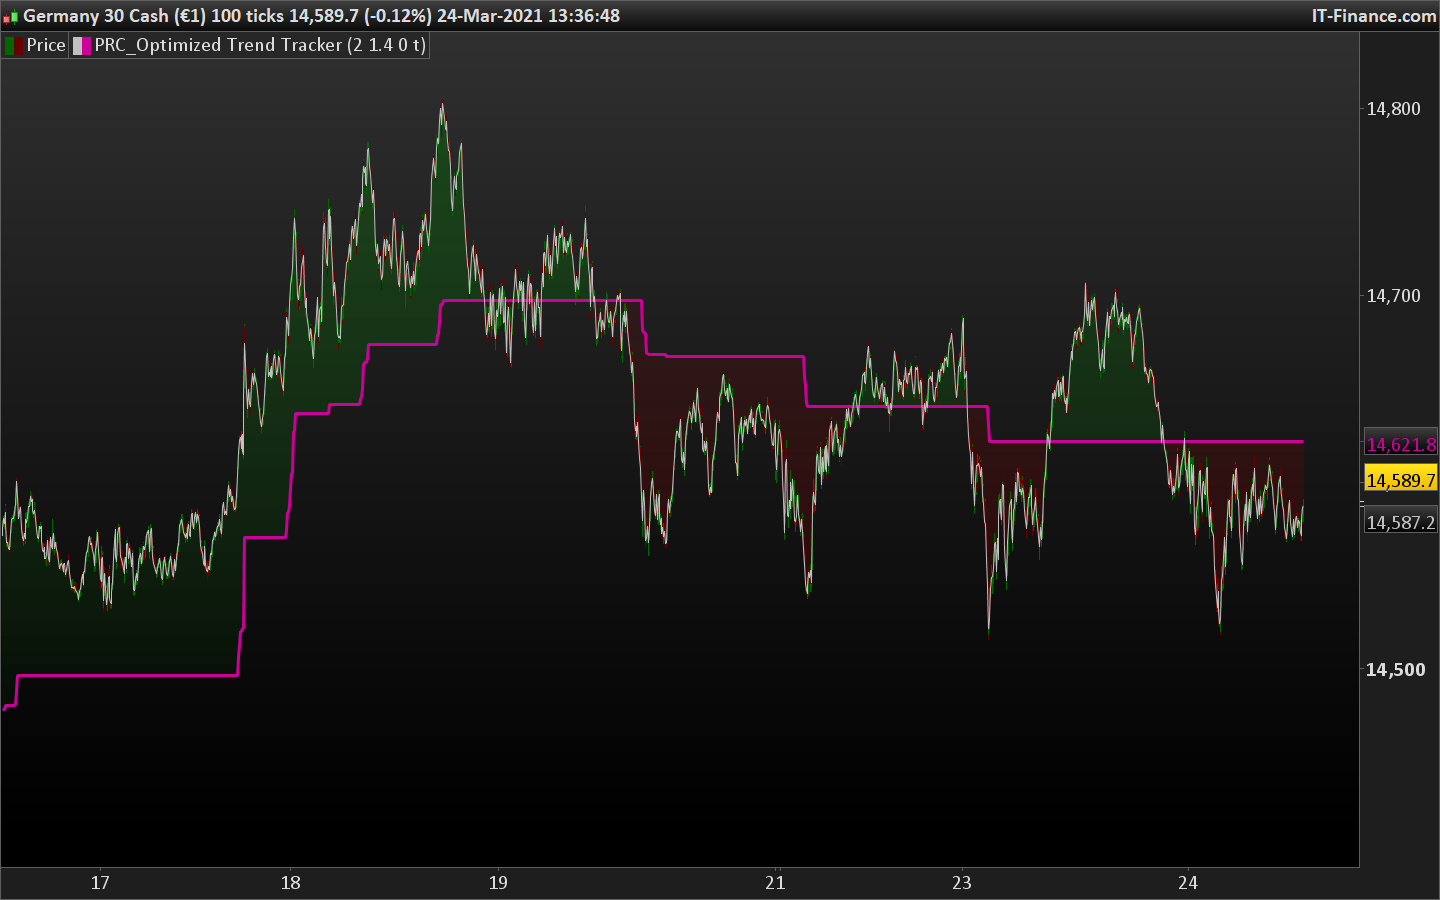
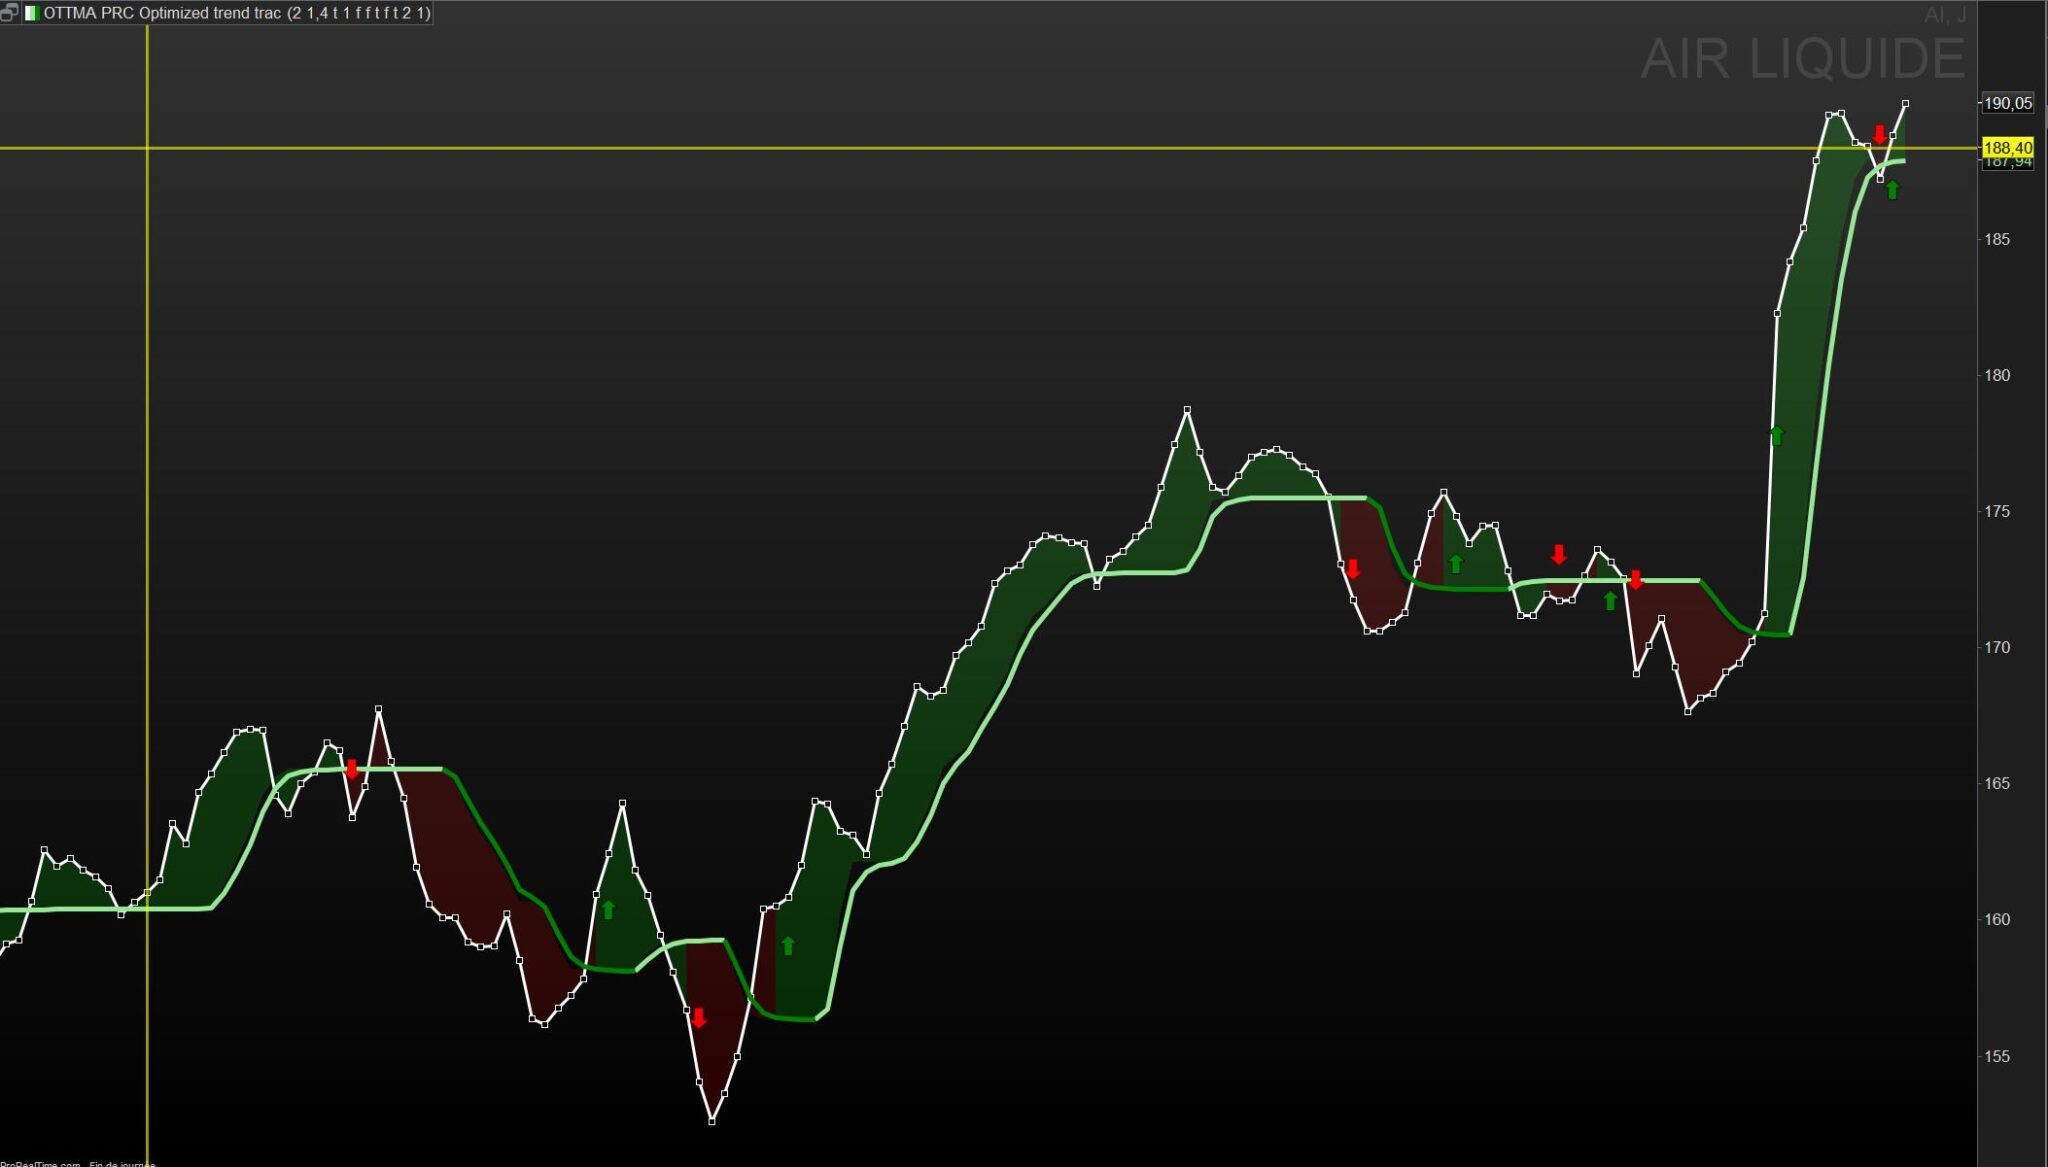
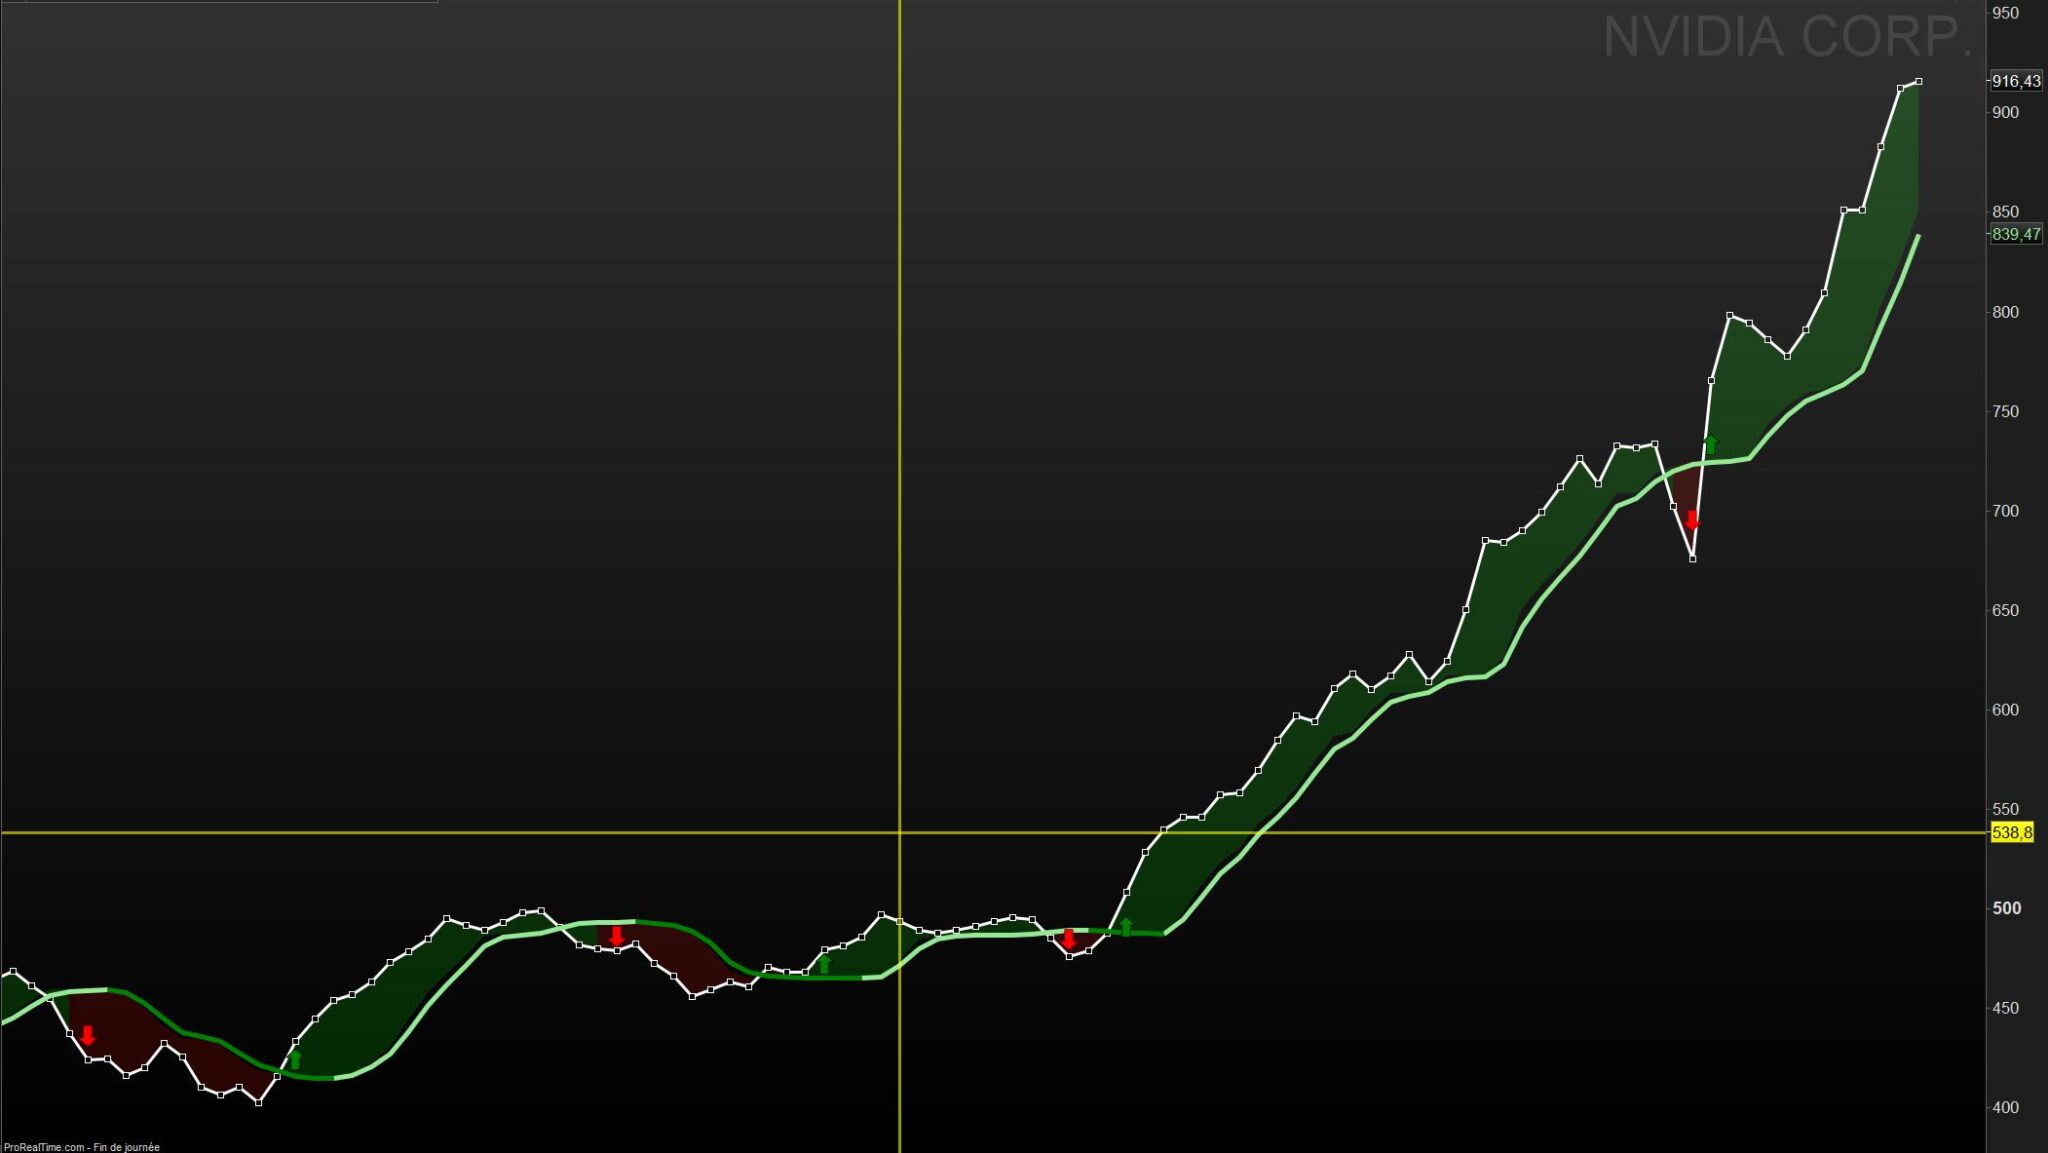
Would it be possible to convert this indicator to PRT ? It’s a dynamic S/R line. (ScreenShot attached)
This is the complete code from tradingView.
Many unecassy lines because of the moving average type options and alerts system I guess.
The 2 usefull variables are “OTT Period” and “OTT Percent”
Thanks a lot
//@version=4
// This source code is subject to the terms of the Mozilla Public License 2.0 at https://mozilla.org/MPL/2.0/
// © KivancOzbilgic

//created by: @Anil_Ozeksi
//developer: ANIL ÖZEKŞİ
//author: @kivancozbilgic

study("Optimized Trend Tracker","OTT", overlay=true)
src = input(close, title="Source")
length=input(2, "OTT Period", minval=1)
percent=input(1.4, "OTT Percent", type=input.float, step=0.1, minval=0)
showsupport = input(title="Show Support Line?", type=input.bool, defval=true)
showsignalsk = input(title="Show Support Line Crossing Signals?", type=input.bool, defval=true)
showsignalsc = input(title="Show Price/OTT Crossing Signals?", type=input.bool, defval=false)
highlight = input(title="Show OTT Color Changes?", type=input.bool, defval=false)
showsignalsr = input(title="Show OTT Color Change Signals?", type=input.bool, defval=false)
highlighting = input(title="Highlighter On/Off ?", type=input.bool, defval=true)
mav = input(title="Moving Average Type", defval="VAR", options=["SMA", "EMA", "WMA", "TMA", "VAR", "WWMA", "ZLEMA", "TSF"])
Var_Func(src,length)=>
    valpha=2/(length+1)
    vud1=src>src[1] ? src-src[1] : 0
    vdd1=src<src[1] ? src[1]-src : 0
    vUD=sum(vud1,9)
    vDD=sum(vdd1,9)
    vCMO=nz((vUD-vDD)/(vUD+vDD))
    VAR=0.0
    VAR:=nz(valpha*abs(vCMO)*src)+(1-valpha*abs(vCMO))*nz(VAR[1])
VAR=Var_Func(src,length)
Wwma_Func(src,length)=>
    wwalpha = 1/ length
    WWMA = 0.0
    WWMA := wwalpha*src + (1-wwalpha)*nz(WWMA[1])
WWMA=Wwma_Func(src,length)
Zlema_Func(src,length)=>
    zxLag = length/2==round(length/2) ? length/2 : (length - 1) / 2
    zxEMAData = (src + (src - src[zxLag]))
    ZLEMA = ema(zxEMAData, length)
ZLEMA=Zlema_Func(src,length)
Tsf_Func(src,length)=>
    lrc = linreg(src, length, 0)
    lrc1 = linreg(src,length,1)
    lrs = (lrc-lrc1)
    TSF = linreg(src, length, 0)+lrs
TSF=Tsf_Func(src,length)
getMA(src, length) =>
    ma = 0.0
    if mav == "SMA"
        ma := sma(src, length)
        ma

    if mav == "EMA"
        ma := ema(src, length)
        ma

    if mav == "WMA"
        ma := wma(src, length)
        ma

    if mav == "TMA"
        ma := sma(sma(src, ceil(length / 2)), floor(length / 2) + 1)
        ma

    if mav == "VAR"
        ma := VAR
        ma

    if mav == "WWMA"
        ma := WWMA
        ma

    if mav == "ZLEMA"
        ma := ZLEMA
        ma

    if mav == "TSF"
        ma := TSF
        ma
    ma

MAvg=getMA(src, length)
fark=MAvg*percent*0.01
longStop = MAvg - fark
longStopPrev = nz(longStop[1], longStop)
longStop := MAvg > longStopPrev ? max(longStop, longStopPrev) : longStop
shortStop =  MAvg + fark
shortStopPrev = nz(shortStop[1], shortStop)
shortStop := MAvg < shortStopPrev ? min(shortStop, shortStopPrev) : shortStop
dir = 1
dir := nz(dir[1], dir)
dir := dir == -1 and MAvg > shortStopPrev ? 1 : dir == 1 and MAvg < longStopPrev ? -1 : dir
MT = dir==1 ? longStop: shortStop
OTT=MAvg>MT ? MT*(200+percent)/200 : MT*(200-percent)/200
plot(showsupport ? MAvg : na, color=#0585E1, linewidth=2, title="Support Line")
OTTC = highlight ? OTT[2] > OTT[3] ? color.green : color.red : #B800D9
pALL=plot(nz(OTT[2]), color=OTTC, linewidth=2, title="OTT", transp=0)
alertcondition(cross(OTT[2], OTT[3]), title="Color ALARM", message="OTT Has Changed Color!")
alertcondition(crossover(OTT[2], OTT[3]), title="GREEN ALERT", message="OTT GREEN BUY SIGNAL!")
alertcondition(crossunder(OTT[2], OTT[3]), title="RED ALERT", message="OTT RED SELL SIGNAL!")
alertcondition(cross(MAvg, OTT[2]), title="Cross Alert", message="OTT - Support Line Crossing!")
alertcondition(crossover(MAvg, OTT[2]), title="Crossover Alarm", message="Support Line BUY SIGNAL!")
alertcondition(crossunder(MAvg, OTT[2]), title="Crossunder Alarm", message="Support Line SELL SIGNAL!")
alertcondition(cross(src, OTT[2]), title="Price Cross Alert", message="OTT - Price Crossing!")
alertcondition(crossover(src, OTT[2]), title="Price Crossover Alarm", message="PRICE OVER OTT - BUY SIGNAL!")
alertcondition(crossunder(src, OTT[2]), title="Price Crossunder Alarm", message="PRICE UNDER OTT - SELL SIGNAL!")
buySignalk = crossover(MAvg, OTT[2])
plotshape(buySignalk and showsignalsk ? OTT*0.995 : na, title="Buy", text="Buy", location=location.absolute, style=shape.labelup, size=size.tiny, color=color.green, textcolor=color.white, transp=0)
sellSignallk = crossunder(MAvg, OTT[2])
plotshape(sellSignallk and showsignalsk ? OTT*1.005 : na, title="Sell", text="Sell", location=location.absolute, style=shape.labeldown, size=size.tiny, color=color.red, textcolor=color.white, transp=0)
buySignalc = crossover(src, OTT[2])
plotshape(buySignalc and showsignalsc ? OTT*0.995 : na, title="Buy", text="Buy", location=location.absolute, style=shape.labelup, size=size.tiny, color=color.green, textcolor=color.white, transp=0)
sellSignallc = crossunder(src, OTT[2])
plotshape(sellSignallc and showsignalsc ? OTT*1.005 : na, title="Sell", text="Sell", location=location.absolute, style=shape.labeldown, size=size.tiny, color=color.red, textcolor=color.white, transp=0)
mPlot = plot(ohlc4, title="", style=plot.style_circles, linewidth=0,display=display.none)
longFillColor = highlighting ? (MAvg>OTT ? color.green : na) : na
shortFillColor = highlighting ? (MAvg<OTT ? color.red : na) : na
fill(mPlot, pALL, title="UpTrend Highligter", color=longFillColor)
fill(mPlot, pALL, title="DownTrend Highligter", color=shortFillColor)
buySignalr = crossover(OTT[2], OTT[3])
plotshape(buySignalr and showsignalsr ? OTT*0.995 : na, title="Buy", text="Buy", location=location.absolute, style=shape.labelup, size=size.tiny, color=color.green, textcolor=color.white, transp=0)
sellSignallr = crossunder(OTT[2], OTT[3])
plotshape(sellSignallr and showsignalsr ? OTT*1.005 : na, title="Sell", text="Sell", location=location.absolute, style=shape.labeldown, size=size.tiny, color=color.red, textcolor=color.white, transp=0)