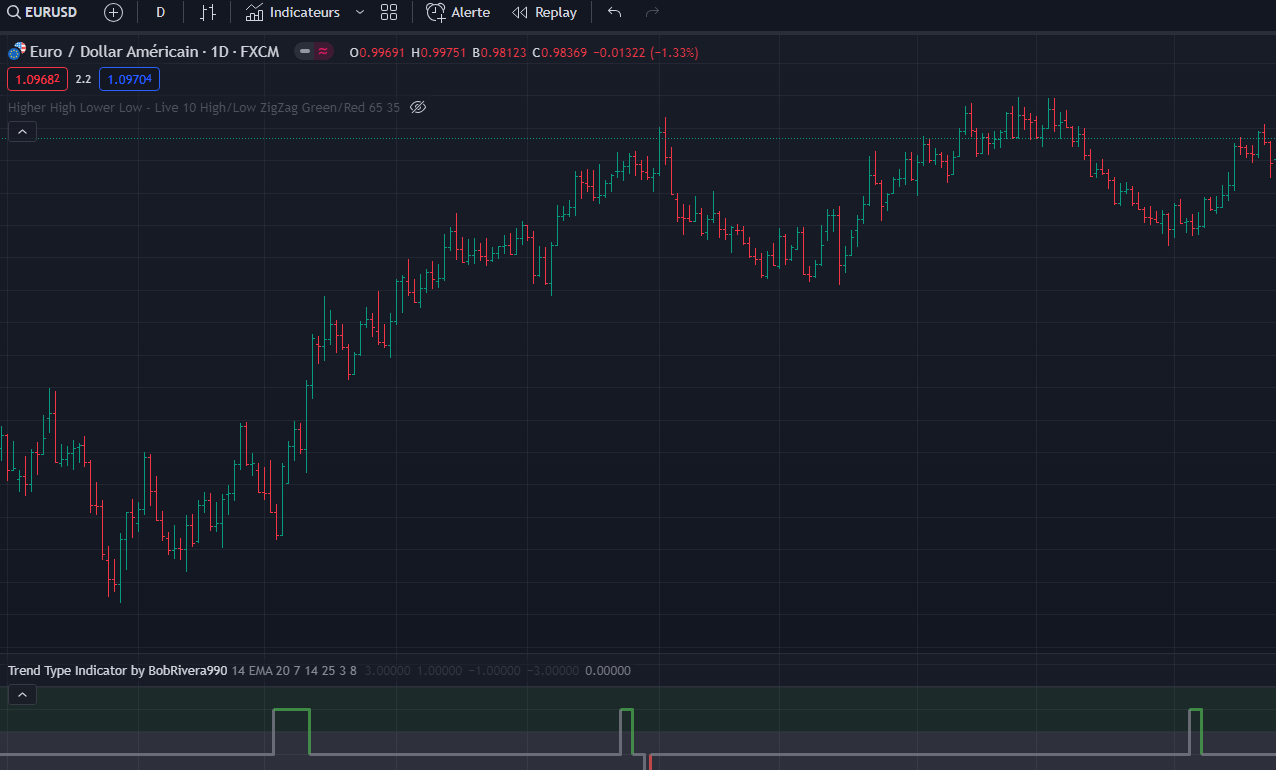
Bonjour à tous. J’aimerais savoir si quelqu’un, Nicolas ou un autre expert serait en mesure de traduire / convertir ce code tradingview pour Prorealtime.
Je joins une capture d’écran ainsi que le code dans son intégralité.
Vous remerciant par avance pour votre aide.
// This source code is subject to the terms of the Mozilla Public License 2.0 at https://mozilla.org/MPL/2.0/
// © BobRivera990

//@version=4
study(title = "Trend Type Indicator by BobRivera990", overlay = false)
//==========================================================================[Inputs]==========================================================================
useAtr = input(true, title = "Use ATR to detect Sideways Movements")            // Use Average True Range (ATR) to detect Sideways Movements

atrLen = input(14, minval = 1, title = "ATR Length")                            // length of the Average True Range (ATR) used to detect Sideways Movements

atrMaType = input("SMA", options = ["SMA", "EMA"],
     title = "ATR Moving Average Type")                                         // Type of the moving average of the ATR used to detect Sideways Movements
atrMaLen = input(20, minval = 1, title = "ATR MA Length")                       // length of the moving average of the ATR used to detect Sideways Movements

useAdx = input(true, title = "Use ADX to detect Sideways Movements")            // Use Average Directional Index (ADX) to detect Sideways Movements

adxLen = input(14, minval = 1, maxval = 50, title = "ADX Smoothing")            // length of the Average Directional Index (ADX) used to detect Sideways Movements
diLen = input(14, minval = 1, title = "DI Length")                              // length of the Plus and Minus Directional Indicators (+DI & -DI) used to determine the direction of the trend
adxLim = input(25, minval = 1, title = "ADX Limit")                             // A level of ADX used as the boundary between Trend Market and Sideways Market

smooth = input(3, minval = 1, maxval = 5, title = "Smoothing Factor")           // Factor used for smoothing the oscillator
lag = input(8, minval = 0, maxval = 15, title = "Lag")                          // lag used to match indicator and chart
//============================================================================================================================================================
//===================================================================[Initial Calculations]===================================================================

atr = atr(atrLen)                                                               // Calculate the Average True Range (ATR)
atrMa = atrMaType == "EMA" ? ema(atr, atrMaLen) : sma(atr, atrMaLen)            // Calculate the moving average of the ATR

up = change(high)                                                               // Calculate parameter related to ADX, +DI and -DI
down = -change(low)                                                             // Calculate parameter related to ADX, +DI and -DI
plusDM = na(up) ? na : (up > down and up > 0 ? up : 0)                          // Calculate parameter related to ADX, +DI and -DI
minusDM = na(down) ? na : (down > up and down > 0 ? down : 0)                   // Calculate parameter related to ADX, +DI and -DI
trur = rma(tr, diLen)                                                           // Calculate parameter related to ADX, +DI and -DI
plus = fixnan(100 * rma(plusDM, diLen) / trur)                                  // Calculate Plus Directional Indicator (+DI)
minus = fixnan(100 * rma(minusDM, diLen) / trur)                                // Calculate Minus Directional Indicator (-DI)
sum = plus + minus                                                              // Calculate parameter related to ADX

adx = 100 * rma(abs(plus - minus) / (sum == 0 ? 1 : sum), adxLen)               // Calculate Average Directional Index (ADX)
//============================================================================================================================================================
//========================================================================[Conditions]========================================================================

cndNa = na(atr) or na(adx) or na(plus) or na(minus) or na(atrMaLen)             // Conditions for lack of sufficient data for calculations

cndSidwayss1 = useAtr and atr <= atrMa                                                     // Sideways Movement condition (based on ATR)
cndSidwayss2 = useAdx and adx <= adxLim                                                    // Sideways Movement condition (based on ADX)
cndSidways = cndSidwayss1 or cndSidwayss2                                       // General Sideways Movement condition

cndUp = plus > minus                                                            // uptrend condition
cndDown = minus >= plus                                                         // downtrend condition

trendType  = cndNa ? na : cndSidways ? 0 : cndUp ? 2 : -2                       // Determine the type of trend
smoothType = na(trendType) ? na : round(sma(trendType, smooth) / 2) * 2         // Calculate the smoothed trend type oscillator
//============================================================================================================================================================
//=========================================================================[Drawing]==========================================================================

colGreen30 = color.new(color.green, 30)                                         // Define the color used in the drawings
colGreen90 = color.new(color.green, 90)                                         // Define the color used in the drawings
colGray = color.new(color.gray, 20)                                             // Define the color used in the drawings
colWhite90 = color.new(color.white, 90)                                         // Define the color used in the drawings
colRed30 = color.new(color.red, 30)                                             // Define the color used in the drawings
colRed90 = color.new(color.red, 90)                                             // Define the color used in the drawings

band3 = plot(+3, title = "Band_3", color=color.black)                           // Draw the upper limit of the uptrend area
band2 = plot(+1, title = "Band_2", color=color.black)                           // Draw the boundary between Sideways and Uptrend areas
band1 = plot(-1, title = "Band_1", color=color.black)                           // Draw the boundary between Sideways and Downtrend areas
band0 = plot(-3, title = "Band_0", color=color.black)                           // Draw the lower limit of the downtrend area

fill(band2, band3, title = "Uptrend area", color = colGreen90)                  // Highlight the Uptrend area
fill(band1, band2, title = "Sideways area", color = colWhite90)                 // Highlight the Sideways area
fill(band0, band1, title = "Downtrend area", color = colRed90)                  // Highlight the Downtrend area

var label lblUp = na
label.delete(lblUp)
lblUp := label.new(x = time, y = 2, text = "UP",
     color = color.new(color.green, 100), textcolor = color.black,
     style = label.style_label_left, xloc = xloc.bar_time,
     yloc = yloc.price, size=size.normal, textalign = text.align_left)          // Show Uptrend area label

var label lblSideways = na
label.delete(lblSideways)
lblSideways := label.new(x = time, y = 0, text = "SIDEWAYS",
     color = color.new(color.green, 100), textcolor = color.black,
     style = label.style_label_left, xloc = xloc.bar_time,
     yloc = yloc.price, size = size.normal, textalign = text.align_left)        // Show Sideways area label

var label lblDown = na
label.delete(lblDown)
lblDown := label.new(x = time, y = -2, text = "DOWN",
     color = color.new(color.green, 100), textcolor = color.black,
     style = label.style_label_left, xloc = xloc.bar_time,
     yloc = yloc.price, size = size.normal, textalign = text.align_left)        // Show Downtrend area label

var label lblCurrentType = na
label.delete(lblCurrentType)
lblCurrentType := label.new(x = time, y = smoothType,
     color = color.new(color.blue, 30), style = label.style_label_right,
     xloc = xloc.bar_time, yloc = yloc.price, size = size.small)                // Show the latest status label

trendCol = smoothType == 2 ? colGreen30 : smoothType == 0 ? colGray : colRed30  // Determine the color of the oscillator in different conditions

plot(smoothType, title = "Trend Type Oscillator", color = trendCol,
     linewidth = 3, offset = -lag, style = plot.style_stepline)                 // Draw the trend type oscillator