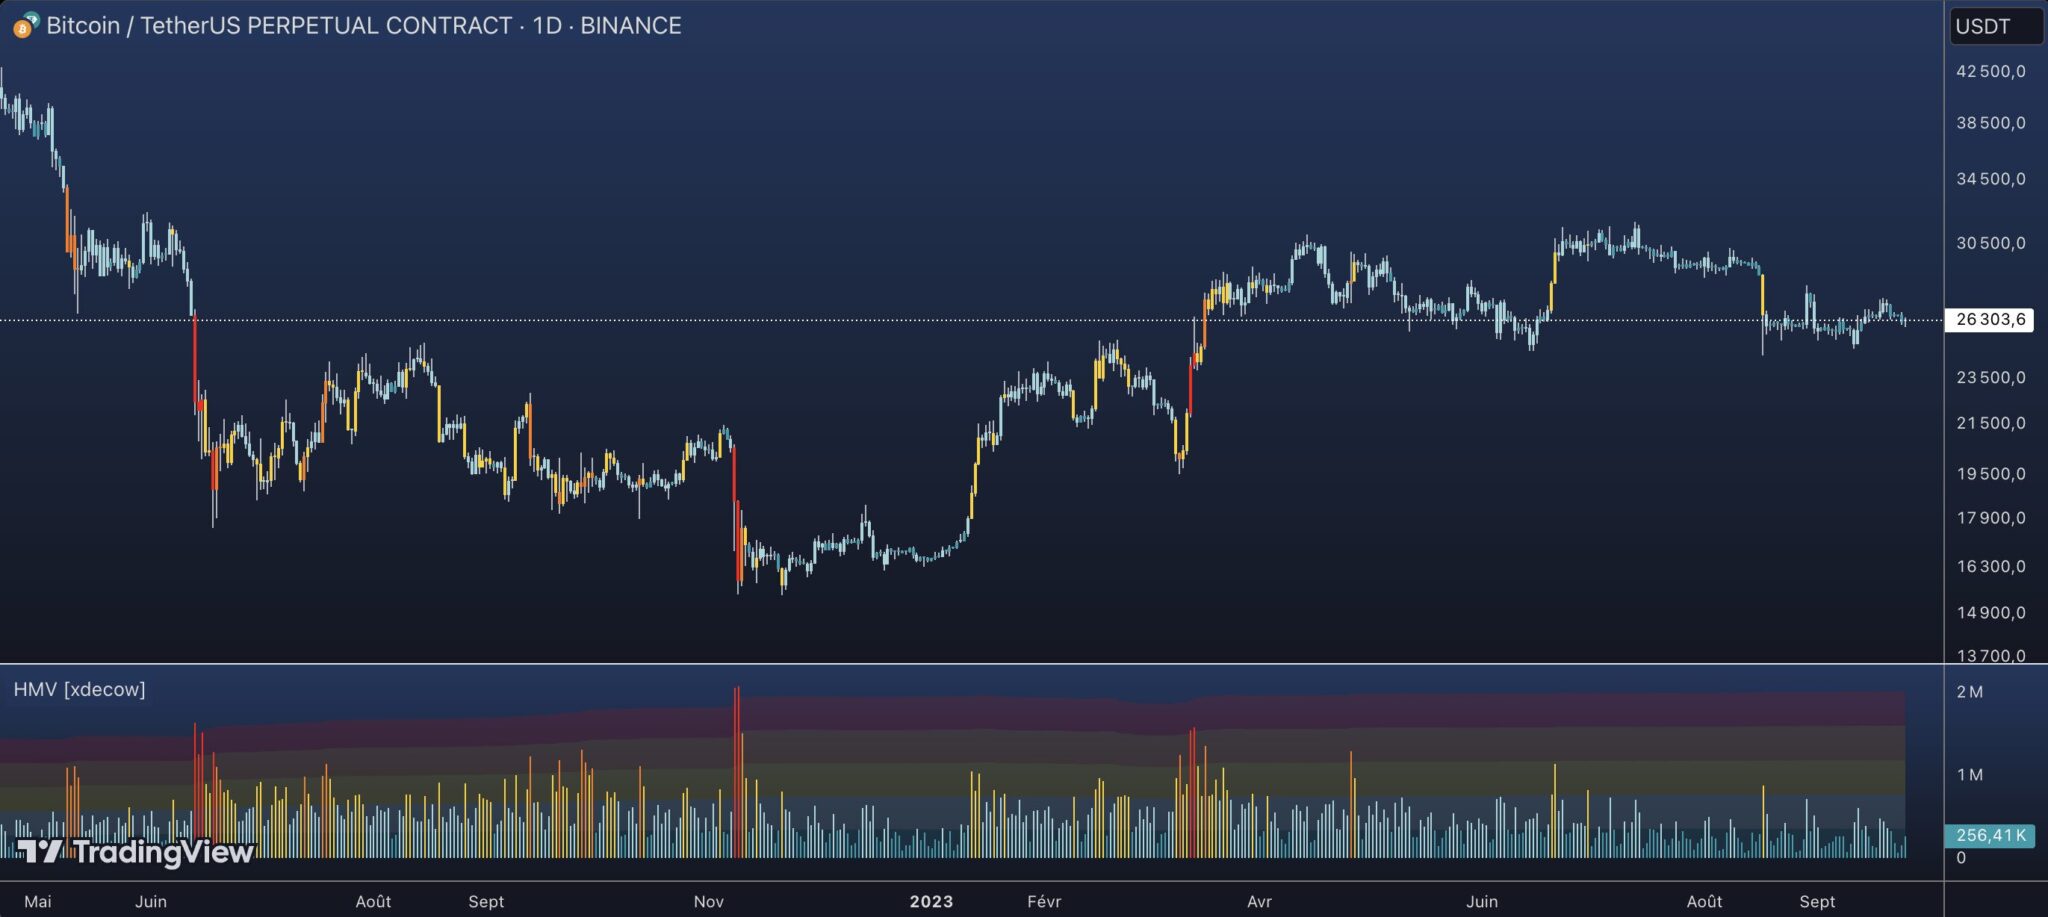
Bonjour, pouvez-vous m’aider à convertir ce code pine script en Probuilder pour PRT ?
//@version=5
indicator(title=’Heatmap Volume [xdecow]’, shorttitle=’HMV [xdecow]’, format=format.volume)
//——————————————————————————
// Inputs
length = input.int(610, title=’MA Length’, minval = 2, tooltip = ‘Moving Average Length\n\n- Smaller values will respond more quickly and activate more frequently. (Best for short-term analysis)\n- Larger values will have a slower response, will be less sensitive to small volume variations, and will highlight large volumes. (Best for long-term analysis)\n\nFormula: How many stdev is the volume far from the Moving Average?’)
slength = input.int(610, title=’Standard Deviation Length’, minval=2, tooltip = ‘Standard Deviation lookback period.\n\nFormula: How many stdev is the volume far from the Moving Average?’)
g_hmz = ‘Heatmap Threshold Multipliers’
thresholdExtraHigh = input.float(4, title=’Extra High Multiplier’, tooltip = ‘Volume Threshold Multiplier\neg: 4 = 400% or 4 x Stdev above the mean’, group=g_hmz)
thresholdHigh = input(2.5, title=’High Multiplier’, group=g_hmz)
thresholdMedium = input.float(1, title=’Medium Multiplier’, group=g_hmz)
thresholdNormal = input(-0.5, title=’Normal Multiplier’, group=g_hmz)
//——————————————————————————
// Colors
// config
g_color = ‘Color settings’
bcolor_enabled = input(true, ‘Colored bars’, group = g_color)
zmode = input.string(‘Backgrounds’, ‘Display Heatmap Zones as’, options=[‘None’, ‘Lines’, ‘Backgrounds’, ‘Both’], group = g_color)
cmode = input.string(‘Heatmap’, ‘Color Mode’, options=[‘Heatmap’, ‘Up/Down’], group = g_color, tooltip = ‘- Heatmap mode: colors based only on volume.\n- Up/Down mode: colors based on candle volume and direction.\nChange the cores below according to the selected mode.’)
// heatmap colors
chm1 = #ff0000 // extra high red
chm2 = #ff7800 // high orange
chm3 = #ffcf03 // medium yellow
chm4 = #a0d6dc // normal
chm5 = #1f9cac // low
// heatmap colors
g_mhcolor = ‘Heatmap colors’
chmthresholdExtraHigh = input(chm1, ‘Extra High’, group=g_mhcolor)
chmthresholdHigh = input(chm2, ‘High’, group=g_mhcolor)
chmthresholdMedium = input(chm3, ‘Medium’, group=g_mhcolor)
chmthresholdNormal = input(chm4, ‘Normal’, group=g_mhcolor)
chmthresholdLow = input(chm5, ‘Low’, group=g_mhcolor)
// up colors
g_up = ‘Up colors’
cupthresholdExtraHigh = input(#00FF00, ‘Extra High’, group = g_up)
cupthresholdHigh = input(#30FF30, ‘High’, group = g_up)
cupthresholdMedium = input(#60FF60, ‘Medium’, group = g_up)
cupthresholdNormal = input(#8FFF8F, ‘Normal’, group = g_up)
cupthresholdLow = input(#BFFFBF, ‘Low’, group = g_up)
// down colors
g_down = ‘Down colors’
cdnthresholdExtraHigh = input(#FF0000, ‘Extra High’, group = g_down)
cdnthresholdHigh = input(#FF3030, ‘High’, group = g_down)
cdnthresholdMedium = input(#FF6060, ‘Medium’, group = g_down)
cdnthresholdNormal = input(#FF8F8F, ‘Normal’, group = g_down)
cdnthresholdLow = input(#FFBFBF, ‘Low’, group = g_down)
// threshold colors
cthresholdExtraHighUp = cmode == ‘Heatmap’ ? chmthresholdExtraHigh : cupthresholdExtraHigh
cthresholdHighUp = cmode == ‘Heatmap’ ? chmthresholdHigh : cupthresholdHigh
cthresholdMediumUp = cmode == ‘Heatmap’ ? chmthresholdMedium : cupthresholdMedium
cthresholdNormalUp = cmode == ‘Heatmap’ ? chmthresholdNormal : cupthresholdNormal
cthresholdLowUp = cmode == ‘Heatmap’ ? chmthresholdLow : cupthresholdLow
cthresholdExtraHighDn = cmode == ‘Heatmap’ ? chmthresholdExtraHigh : cdnthresholdExtraHigh
cthresholdHighDn = cmode == ‘Heatmap’ ? chmthresholdHigh : cdnthresholdHigh
cthresholdMediumDn = cmode == ‘Heatmap’ ? chmthresholdMedium : cdnthresholdMedium
cthresholdNormalDn = cmode == ‘Heatmap’ ? chmthresholdNormal : cdnthresholdNormal
cthresholdLowDn = cmode == ‘Heatmap’ ? chmthresholdLow : cdnthresholdLow
//——————————————————————————
// Calcs
length := length > bar_index + 1 ? bar_index + 1 : length
slength := slength > bar_index + 1 ? bar_index + 1 : slength
dir = close > open
mean = ta.sma(volume, length)
std = ta.stdev(volume, slength)
// how many stdev is the volume far from the mean?
// eg: stdbar = 2.5, is 2.5 * stdev above the mean (2.5 * stdev + mean)
stdbar = (volume – mean) / std
bcolor = stdbar > thresholdExtraHigh ? dir ? cthresholdExtraHighUp : cthresholdExtraHighDn : stdbar > thresholdHigh ? dir ? cthresholdHighUp : cthresholdHighDn : stdbar > thresholdMedium ? dir ? cthresholdMediumUp : cthresholdMediumDn : stdbar > thresholdNormal ? dir ? cthresholdNormalUp : cthresholdNormalDn : dir ? cthresholdLowUp : cthresholdLowDn
// heatmap lines
zshow_lines = zmode == ‘Lines’ or zmode == ‘Both’
zshow_backgrounds = zmode == ‘Backgrounds’ or zmode == ‘Both’
ts1 = std * thresholdExtraHigh + mean
ts2 = std * thresholdHigh + mean
ts3 = std * thresholdMedium + mean
ts4 = std * thresholdNormal + mean
ts0 = 0
tsDelta = ts1 – ts2
tst = ts1 + tsDelta
//——————————————————————————
// Plots
barcolor(bcolor_enabled ? bcolor : na, editable=false)
// hidden heatmap lines to fill
pt = plot(zshow_backgrounds ? tst : na, color=na, display=display.none, editable=false)
p0 = plot(zshow_backgrounds ? ts0 : na, color=na, display=display.none, editable=false)
p1 = plot(zshow_backgrounds ? ts1 : na, color=na, display=display.none, editable=false)
p2 = plot(zshow_backgrounds ? ts2 : na, color=na, display=display.none, editable=false)
p3 = plot(zshow_backgrounds ? ts3 : na, color=na, display=display.none, editable=false)
p4 = plot(zshow_backgrounds ? ts4 : na, color=na, display=display.none, editable=false)
// heatmap fills
tpf = 85
fill(pt, p1, color.new(chm1, tpf), title=’Extra High heatmap zone’)
fill(p1, p2, color.new(chm2, tpf), title=’High heatmap zone’)
fill(p2, p3, color.new(chm3, tpf), title=’Medium heatmap zone’)
fill(p3, p4, color.new(chm4, tpf), title=’Normal heatmap zone’)
fill(p4, p0, color.new(chm5,tpf), title=’Low heatmap zone’)
// volume
plot(volume, color=bcolor, style=plot.style_columns, title=’Volume’, editable=false)
// moving average
plot(mean, color=color.new(#000000, 0), linewidth=2, title=’Moving Average’, style=plot.style_line, display=display.none)
// heatmap lines
tpp = 50
plot(zshow_lines ? ts1 : na, color=color.new(chm1, tpp), title=’Extra High heatmap line’)
plot(zshow_lines ? ts2 : na, color=color.new(chm2, tpp), title=’High heatmap line’)
plot(zshow_lines ? ts3 : na, color=color.new(chm3, tpp), title=’Medium heatmap line’)
plot(zshow_lines ? ts4 : na, color=color.new(chm4, tpp), title=’Normal heatmap line’)
//——————————————————————————
// Alerts
conditionExtraHigh = stdbar > thresholdExtraHigh
conditionHigh = stdbar thresholdHigh
conditionMedium = stdbar thresholdMedium
conditionNormal = stdbar thresholdNormal
conditionLow = stdbar <= thresholdNormal
alertcondition(conditionExtraHigh, title='Any Extra High Vol', message='Any Bar Extra High Volume Threshold')
alertcondition(conditionExtraHigh and open close, title=’Down Extra High’, message=’Down Bar Extra High Volume Threshold’)
alertcondition(conditionHigh, title=’Any High Vol’, message=’Any Bar High Volume Threshold’)
alertcondition(conditionHigh and open close, title=’Down High Vol’, message=’Down Bar High Volume Threshold’)
alertcondition(conditionMedium, title=’Any Medium Vol’, message=’Any Bar Medium Volume Threshold’)
alertcondition(conditionMedium and open close, title=’Down Medium Vol’, message=’Down Bar Medium Volume Threshold’)