Conversion code TV de Ehlers 2 Pole Butterworth Filter

Viewing 3 posts - 1 through 3 (of 3 total)
  • Author
    Posts
  • #206487 quote
    maxlysmaxlys
    Participant
    Senior

    Bonjour,

    Je n’ai pas su trouver d’équivalent sur le forum pour ce code trouvé sur TV.
    pourriez vous le convertir pour PRT ?

    Merci beaucoup

    ————

    study(“Ehlers 2 Pole Butterworth Filter V1 [CC]”, overlay=true)

    inp = input(title=”Source”, type=input.source, defval=hl2)
    res = input(title=”Resolution”, type=input.resolution, defval=””)
    rep = input(title=”Allow Repainting?”, type=input.bool, defval=false)
    bar = input(title=”Allow Bar Color Change?”, type=input.bool, defval=true)
    src = security(syminfo.tickerid, res, inp[rep ? 0 : barstate.isrealtime ? 1 : 0])[rep ? 0 : barstate.isrealtime ? 0 : 1]
    length = input(title=”Length”, type=input.integer, defval=15, minval=1)

    pi = 2 * asin(1)
    a = exp(-1.414 * pi / length)
    b = 2 * a * cos(1.414 * pi / length)
    c2 = b
    c3 = -a * a
    c1 = (1 – b + pow(a, 2)) / 4

    bf = 0.0
    bf := bar_index bf ? 1 : src 0 ? color.green : sig < 0 ? color.red : color.black
    alertcondition(crossover(sig, 0), "Buy Signal", "Bullish Change Detected")
    alertcondition(crossunder(sig, 0), "Sell Signal", "Bearish Change Detected")
    barcolor(bar ? bfColor : na)
    plot(bf, title="2PBF", color=bfColor, linewidth=2)

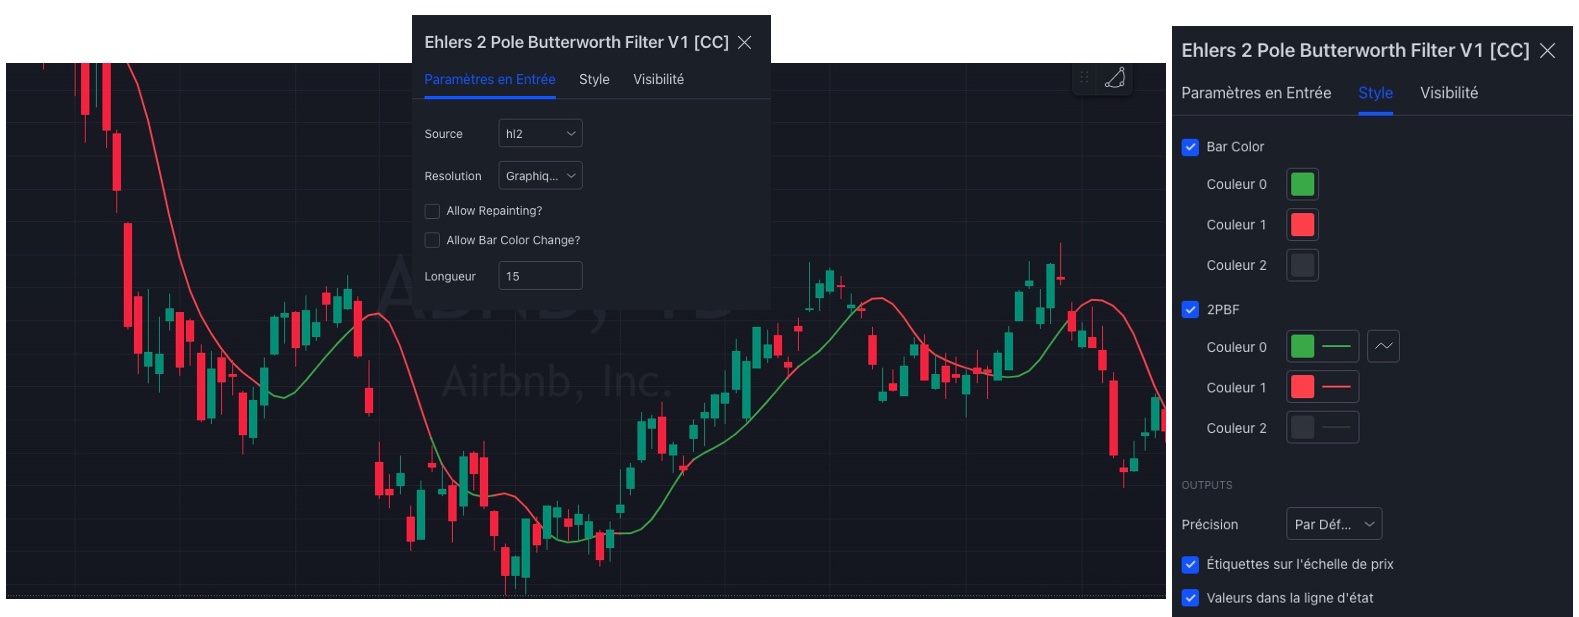
    filtre4.jpg filtre4.jpg
    #206491 quote
    NicolasNicolas
    Keymaster
    Legend
    #206506 quote
    maxlysmaxlys
    Participant
    Senior

    Merci Nicolas,

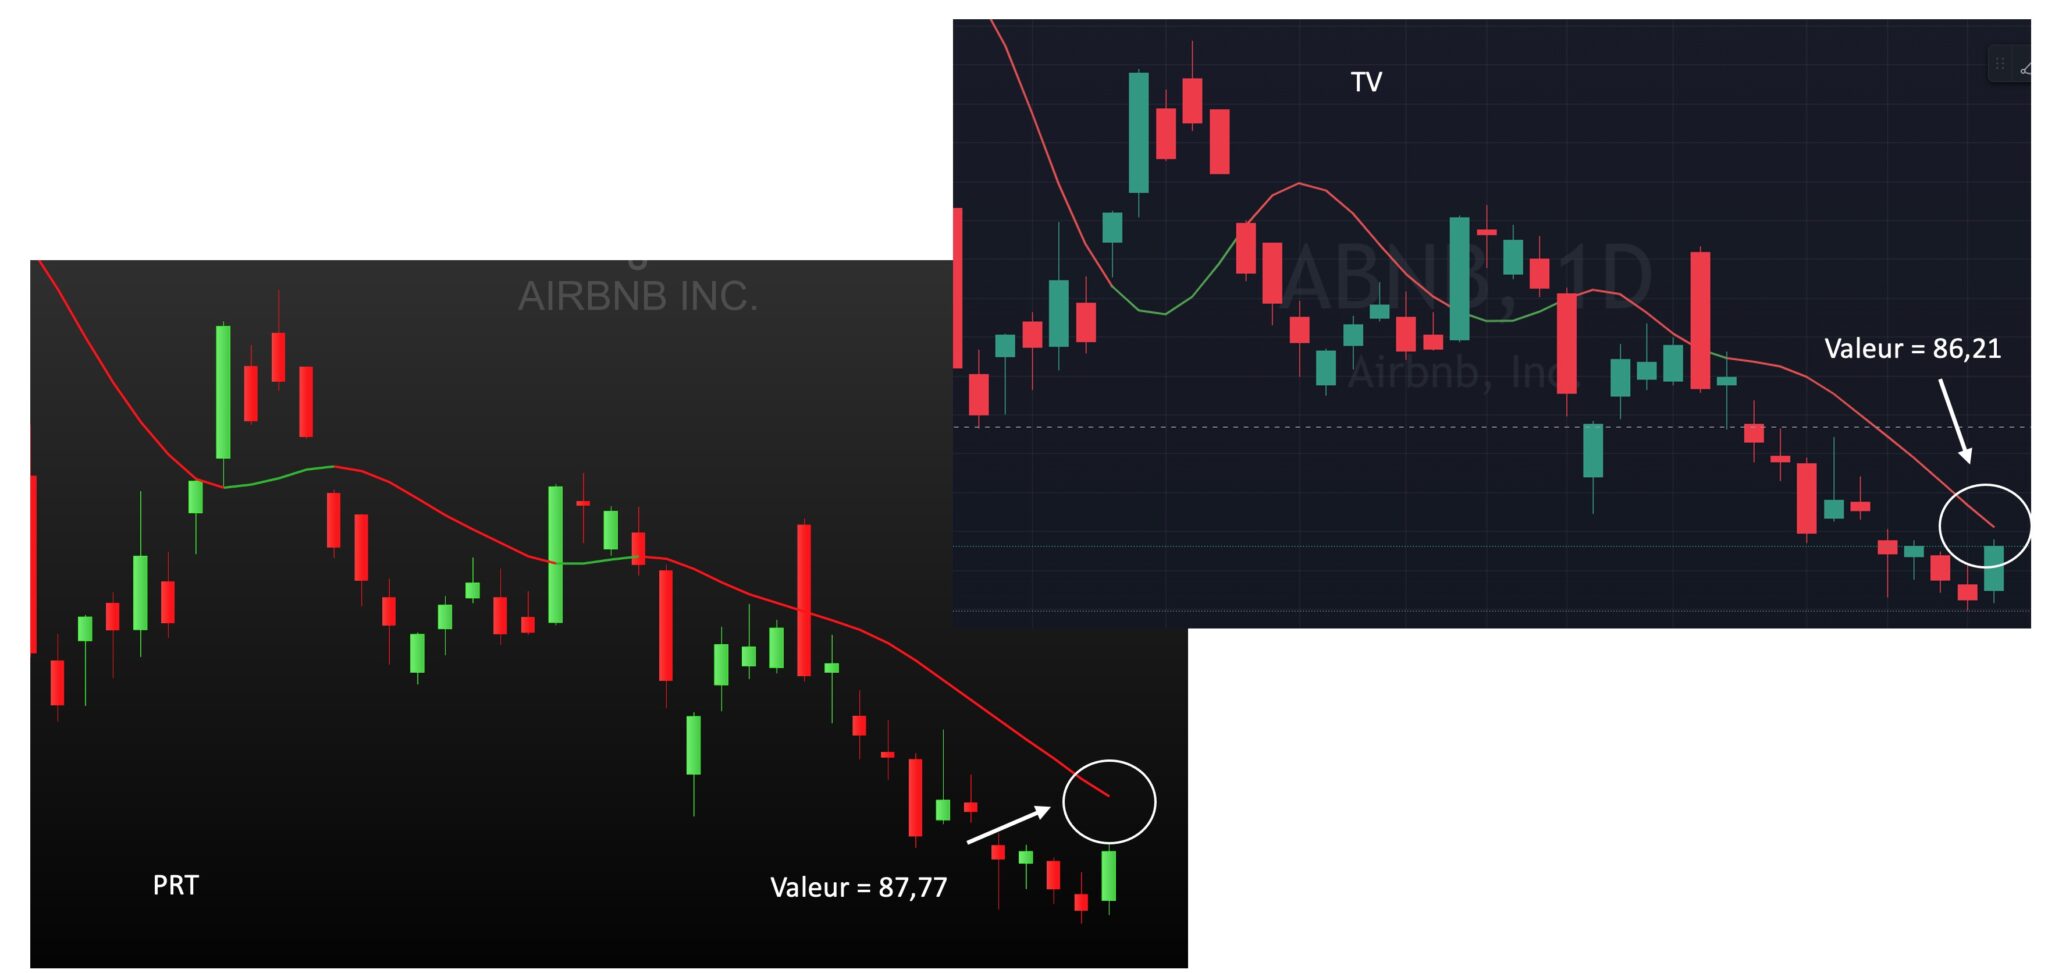
    Dans ce code la période est à 10,  je l’ai donc modifié sur 15 pour respecter les données de l’auteur, mais par rapport au code TV posté, sur la representation graphique il y a un décalage entre celle de TV et celle de PRT.

    Les valeurs calculées ne sont a priori pas les mêmes. Savez vous identifier d’où provient la difference entre ces 2 codes ?

    Sur celui de TV le début est identique :

    Il n’y a qu’a partir de la C1 de TV (c1 = (1 – b + pow(a, 2)) / 4)  et C1 de PRT (c1 = 1 – c2 – c3
    if barindex>Period then.   S = c1*(Data[0]+Data[1])*0.5 + c2*S[1] + c3*S[2].  ).   que je n’arrive pas a comparer ce qui a été fait , ne sachant pas ce qu’est pow de TV)

    Voir graphes joint, sur PRT elle à l’air “plus lissée”

    filtre-6.jpg filtre-6.jpg
Viewing 3 posts - 1 through 3 (of 3 total)

  • You must be logged in to reply to this topic.

ProRealAI ProRealAI New

Stuck on this ProBuilder code?

Describe what this topic is trying to build, in plain English, and ProRealAI writes the ProRealTime™ indicator, screener or system for you.

Available in 7 languages
Try ProRealAI

Conversion code TV de Ehlers 2 Pole Butterworth Filter


ProBuilder : Indicateurs & Outils Personnalisés

New Reply
Author
author-avatar
maxlys @maxlys Participant
Summary

This topic contains 2 replies,
has 2 voices, and was last updated by maxlysmaxlys

3 years, 8 months ago.

Topic Details
Forum: ProBuilder : Indicateurs & Outils Personnalisés
Language: French
Started: 12/30/2022
Status: Active
Attachments: 2 files
ProRealCode ProRealCode
Loading...