


contador de velas del RBO para cada TimeFrame

Viewing 3 posts - 1 through 3 (of 3 total)
  • Author
    Posts
  • #248127 quote
    RAM24RAM24
    Participant
    Average

    Hola a todos,

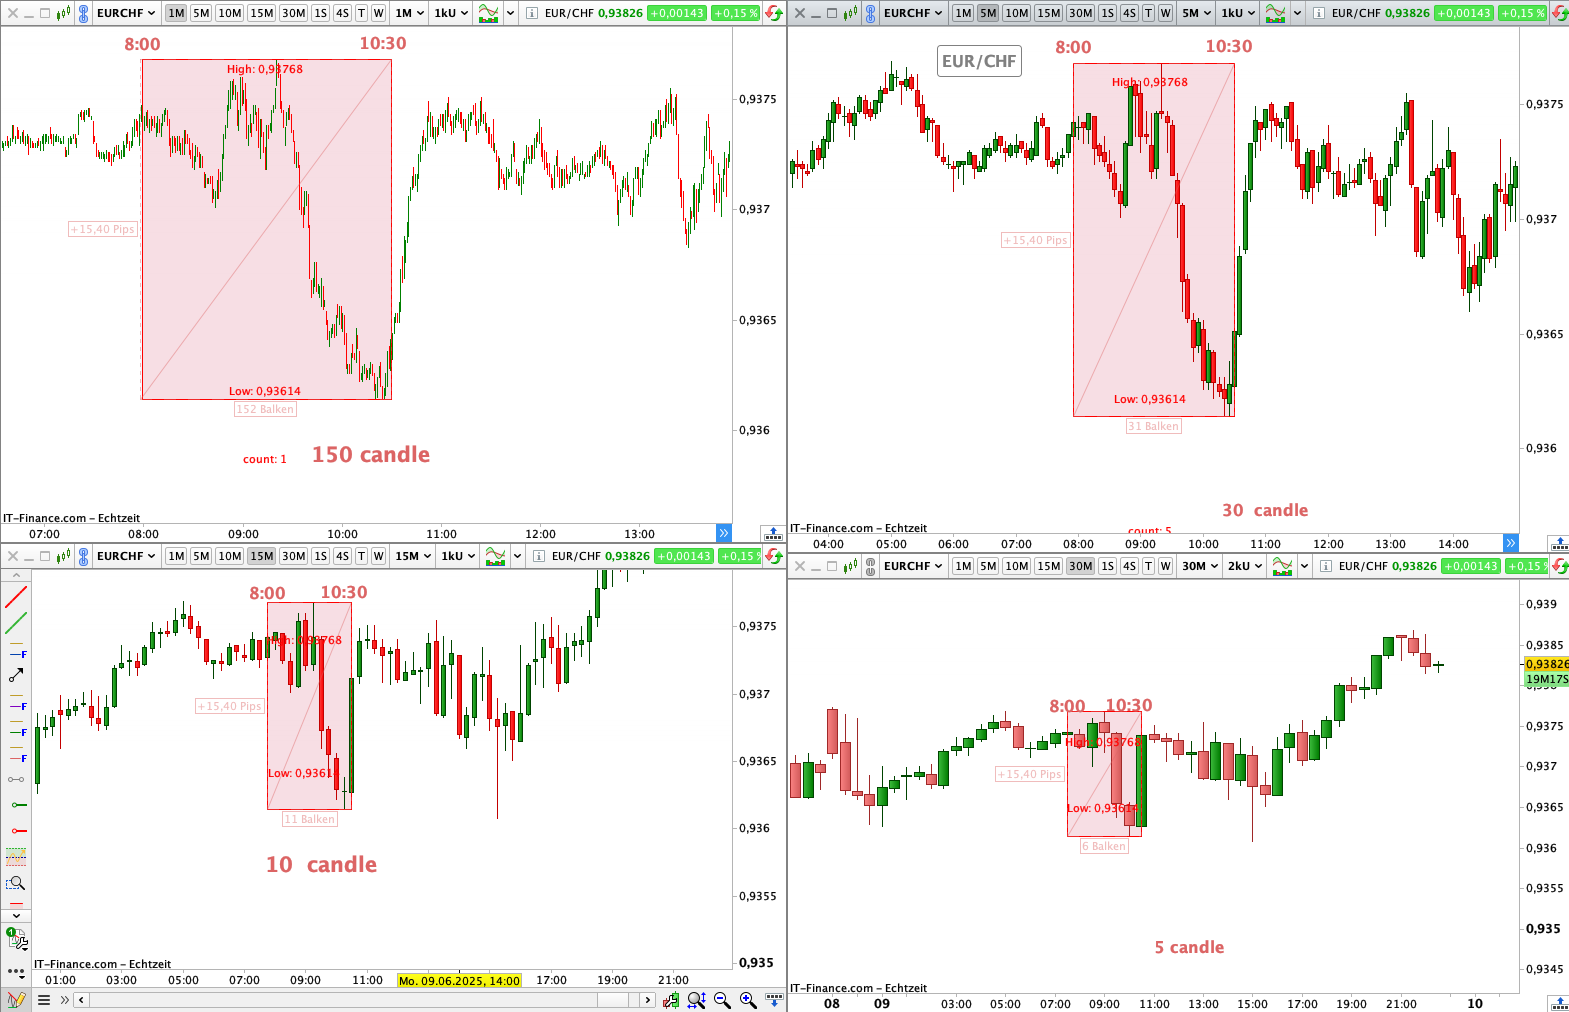
    cómo se puede programar que el indicador  de RBO en el horario de 8:00 a 10:30 muestre un contador de velas desde el inicio del rango hasta el final para cada time frame. Es decir de m1 muestre 150 velas, en m5 30 velas, en m15 10 velas y en m30 5 velas, no consigo la formula adecuada.

    Muchas gracias de antemano.

    ************************************************
    openAS=080000
    closeAS=103000

    //TIMEFRAME(DEFAULT)
    if gettimeframe<=3600 then
    once maxHighAS=high
    once minLowAS=low
    if opentime>=openAS and opentime<=closeAS then
    barAS=barAS+1
    if high>=maxHighAS then
    maxHighAS=high
    else
    maxHighAS= maxHighAS
    endif
    if low<=minLowAS then
    minLowAS=low
    else
    minLowAS=minLowAS
    endif
    ENDIF
    if opentime=closeAS then
    Once MyDate1 = openAS
    Once MyDate2 = closeAs
    Once Count = 0
    If OpenTime >= MyDate1 AND OpenTime <= MyDate2 then
    Count = Count + 1
    drawtext(“count: #count#”,barindex[round(barAS/2)],minLowAS-1.9*tr)coloured(“red”)

    drawrectangle(barindex[barAS],minLowAS,barindex,maxHighAS)coloured(“red”)fillcolor(“red”,30)
    drawtext(“High: #maxHighAS#”,barindex[round(barAS/2)],maxHighAS-0.3*tr)coloured(“red”)
    drawtext(“Low: #minLowAS#”,barindex[round(barAS/2)],minLowAS+0.3*tr)coloured(“red”)
    prevLowAS=minLowAS
    prevHighAS=maxHighAS
    previdxAS=barindex
    barAS=0
    minLowAS=high*100
    maxHighAS=0
    endif
    if low crosses under prevLowAS then
    drawsegment(previdxAS,prevLowAS,barindex,prevLowAS)coloured(“red”)
    prevLowAS=0
    elsif islastbarupdate and prevLowAS<>0 then
    drawsegment(previdxAS,prevLowAS,barindex,prevLowAS)coloured(“red”)
    endif
    if high crosses over prevHighAS then
    drawsegment(previdxAS,prevHighAS,barindex,prevHighAS)coloured(“red”)
    prevHighAS=0
    elsif islastbarupdate and prevHighAS<>0 then
    drawsegment(previdxAS,prevHighAS,barindex,prevHighAS)coloured(“red”)
    endif
    endif
    endif

    return


    candles.png candles.png
    #248141 quote
    Iván GonzálezIván González
    Moderator
    Legend

    Buenas. ya lo tienes creado realmente. La variable barAS está contando las velas.
    Puedes crear otra variable barras=barAS-1 y meter esta línea debajo de la linea que cuenta el número de bloques (por ejemplo).

    openAS=080000
    closeAS=103000
    
    //TIMEFRAME(DEFAULT)
    if gettimeframe<=3600 then
    once maxHighAS=high
    once minLowAS=low
    if opentime>=openAS and opentime<=closeAS then
    barAS=barAS+1
    if high>=maxHighAS then
    maxHighAS=high
    else
    maxHighAS= maxHighAS
    endif
    if low<=minLowAS then
    minLowAS=low
    else
    minLowAS=minLowAS
    endif
    ENDIF
    if opentime=closeAS then
    Once MyDate1 = openAS
    Once MyDate2 = closeAs
    Once Count = 0
    
    If OpenTime >= MyDate1 AND OpenTime <= MyDate2 then
    Count = Count + 1
    drawtext("count: #count#",barindex[round(barAS/2)],minLowAS-1.9*tr)coloured("red")
    barras=barAS-1
    drawtext("#barras#",barindex[round(barAS/2)],minLowAS-1*tr)
    drawrectangle(barindex[barAS],minLowAS,barindex,maxHighAS)coloured("red")fillcolor("red",30)
    drawtext("High: #maxHighAS#",barindex[round(barAS/2)],maxHighAS-0.3*tr)coloured("red")
    drawtext("Low: #minLowAS#",barindex[round(barAS/2)],minLowAS+0.3*tr)coloured("red")
    prevLowAS=minLowAS
    prevHighAS=maxHighAS
    previdxAS=barindex
    barAS=0
    minLowAS=high*100
    maxHighAS=0
    endif
    if low crosses under prevLowAS then
    drawsegment(previdxAS,prevLowAS,barindex,prevLowAS)coloured("red")
    prevLowAS=0
    elsif islastbarupdate and prevLowAS<>0 then
    drawsegment(previdxAS,prevLowAS,barindex,prevLowAS)coloured("red")
    endif
    if high crosses over prevHighAS then
    drawsegment(previdxAS,prevHighAS,barindex,prevHighAS)coloured("red")
    prevHighAS=0
    elsif islastbarupdate and prevHighAS<>0 then
    drawsegment(previdxAS,prevHighAS,barindex,prevHighAS)coloured("red")
    endif
    endif
    endif
    
    return
    #248157 quote
    RAM24RAM24
    Participant
    Average

    Exacto lo que necesitaba, mil gracias Ivan.

Viewing 3 posts - 1 through 3 (of 3 total)

  • You must be logged in to reply to this topic.

ProRealAI ProRealAI New

Stuck on this ProBuilder code?

Describe what this topic is trying to build, in plain English, and ProRealAI writes the ProRealTime™ indicator, screener or system for you.

Available in 7 languages
Try ProRealAI

contador de velas del RBO para cada TimeFrame


ProBuilder: Indicadores y Herramientas

New Reply
Author
author-avatar
RAM24 @ram24 Participant
Summary

This topic contains 2 replies,
has 2 voices, and was last updated by RAM24RAM24

1 year, 3 months ago.

Topic Details
Forum: ProBuilder: Indicadores y Herramientas
Language: Spanish
Started: 06/09/2025
Status: Active
Attachments: 1 files
ProRealCode ProRealCode
Loading...

