BUY and SELL ARROW

Viewing 10 posts - 1 through 10 (of 10 total)

  • Author
    Posts
  • #102310 quote
    cavineetcavineet
    Participant
    Average

    I am trying to get the arrow up Green and down Red for SMA cross overs 8 and 20.

    Does anyone have code which can perform this in existing price chart.

    Also, is there any way to scan the stocks meeting the SMA cross over criteria

    Thank you

    Vineet

    #102312 quote
    robertogozzirobertogozzi
    Moderator
    Legend

    Topic moved to ProBuilder Support, since it’s mainly related to indicators.

    #102313 quote
    robertogozzirobertogozzi
    Moderator
    Legend
    #102314 quote
    robertogozzirobertogozzi
    Moderator
    Legend
    #102482 quote
    cavineetcavineet
    Participant
    Average

    Hello Robert, thank you. This is very helpful.

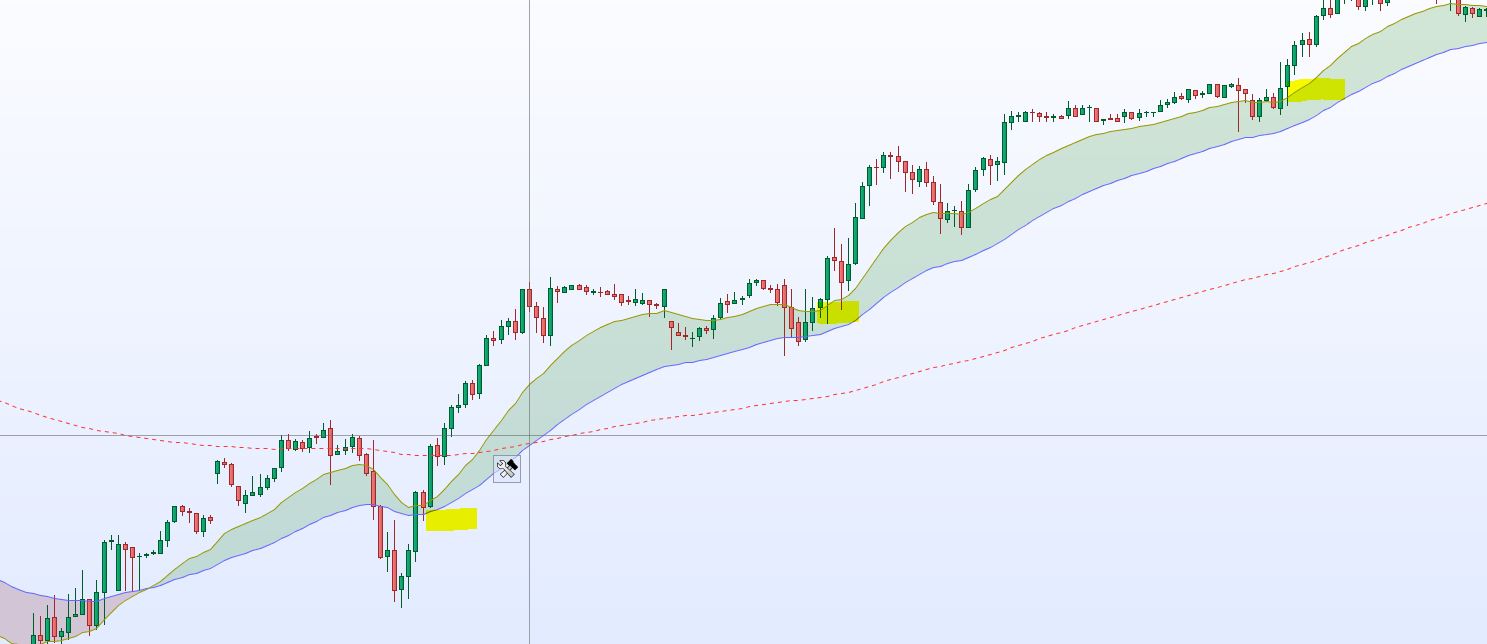
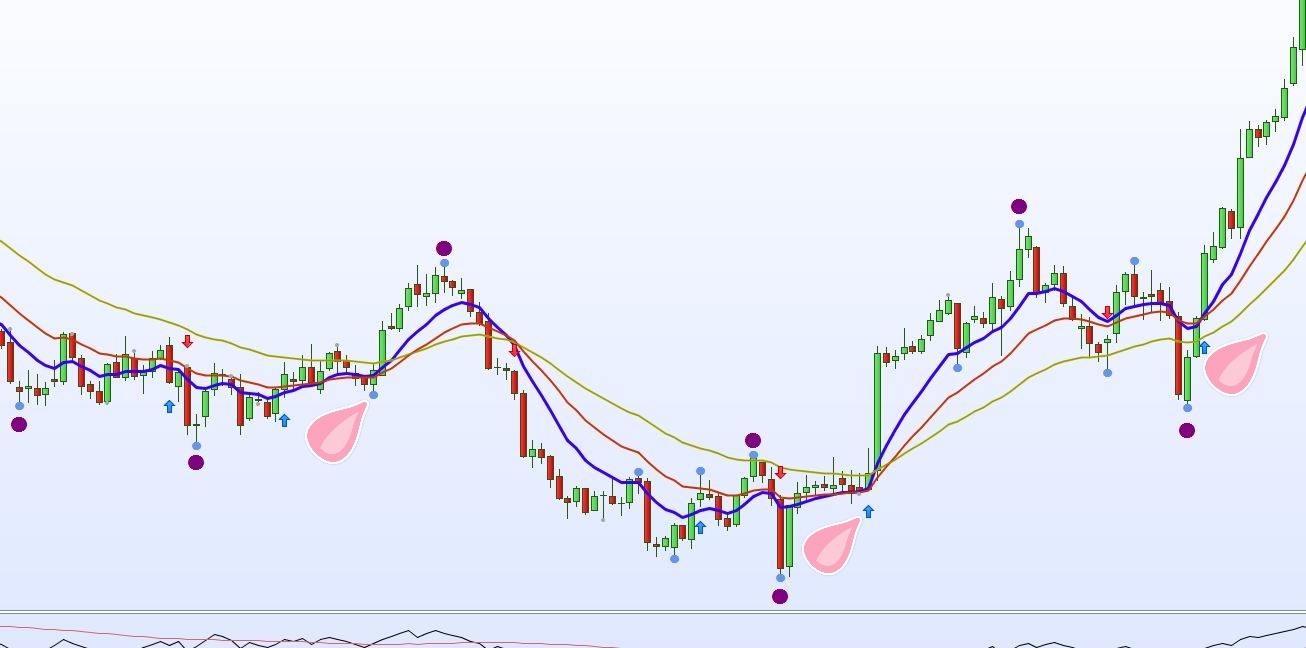
    Do we have any Screener which identifies candle crossing/ bouncing from  20 moving average. I have included the picture. I am looking for candles having a Pear below.


    Thanks

    Vineet

    Candle-Bouncing-20-EMA_SMA.jpg Candle-Bouncing-20-EMA_SMA.jpg
    #102498 quote
    robertogozzirobertogozzi
    Moderator
    Legend

    Yes, it’s possible. I just need to know how you want to define a PEAR, is it an MA rising after the previous candle was falling?

    #183842 quote
    cavineetcavineet
    Participant
    Average

    Hello Robert,


    I just noticed you asked a clarification.


    Ues, I am looking for a screener to identify price bounce from 20 or 50 period EMA, like MA rising after the previous candle was falling as you mentioned.

    #183844 quote
    robertogozzirobertogozzi
    Moderator
    Legend

    Try this one:

    Periods = 20
    Sma     = average[20,0](close)
    Bullish = close > open
    Bearish = close < open
    c1      = close CROSSES OVER Sma
    c2      = (Bullish AND Bearish[1])// OR 1
    c3      = min(low,low[1]) = lowest[Periods](low)
    Cond    = c1 AND c2 AND c3
    SCREENER[Cond]

    you can remove the double slashes in line 6, if you don’t need to have a Bearish candle followed by a Bullish one.

    #183859 quote
    cavineetcavineet
    Participant
    Average

    Hi Robert, thanks

    Somehow the results are not showing the bounce from 20 MA.

    What is the meaning of C2 and C3?

    It shows just a lot of low-cap stocks when I ran on Nasdaq list

    I am looking for something like shown in the picture below.

    bounce-20.jpg bounce-20.jpg
    #183864 quote
    robertogozzirobertogozzi
    Moderator
    Legend

    C2, line 6, ensures that  a Bearish candle is followed by a Bullish one.

    C3, line 7, ensures that one of the last two candles has made a lowest low within the last Periods candies.

    Can you define exactly what a PEAR pattern is?

Viewing 10 posts - 1 through 10 (of 10 total)
  • You must be logged in to reply to this topic.

ProRealAI ProRealAI New

Stuck on this ProBuilder code?

Describe what this topic is trying to build, in plain English, and ProRealAI writes the ProRealTime™ indicator, screener or system for you.

Available in 7 languages
Try ProRealAI

BUY and SELL ARROW


ProBuilder: Indicators & Custom Tools

New Reply
Author
author-avatar
cavineet @cavineet Participant
Summary

This topic contains 9 replies,
has 2 voices, and was last updated by robertogozzirobertogozzi
4 years, 9 months ago.

Topic Details
Forum: ProBuilder: Indicators & Custom Tools
Language: English
Started: 07/09/2019
Status: Active
Attachments: 2 files
ProRealCode ProRealCode
Loading...