Bollinger Divergencia %B

Viewing 3 posts - 1 through 3 (of 3 total)
  • Author
    Posts
  • #246909 quote
    Maricarmen
    Participant
    Veteran

    Hola:

    No se si es posible crear un Screener que cumpla con lo siguiente,

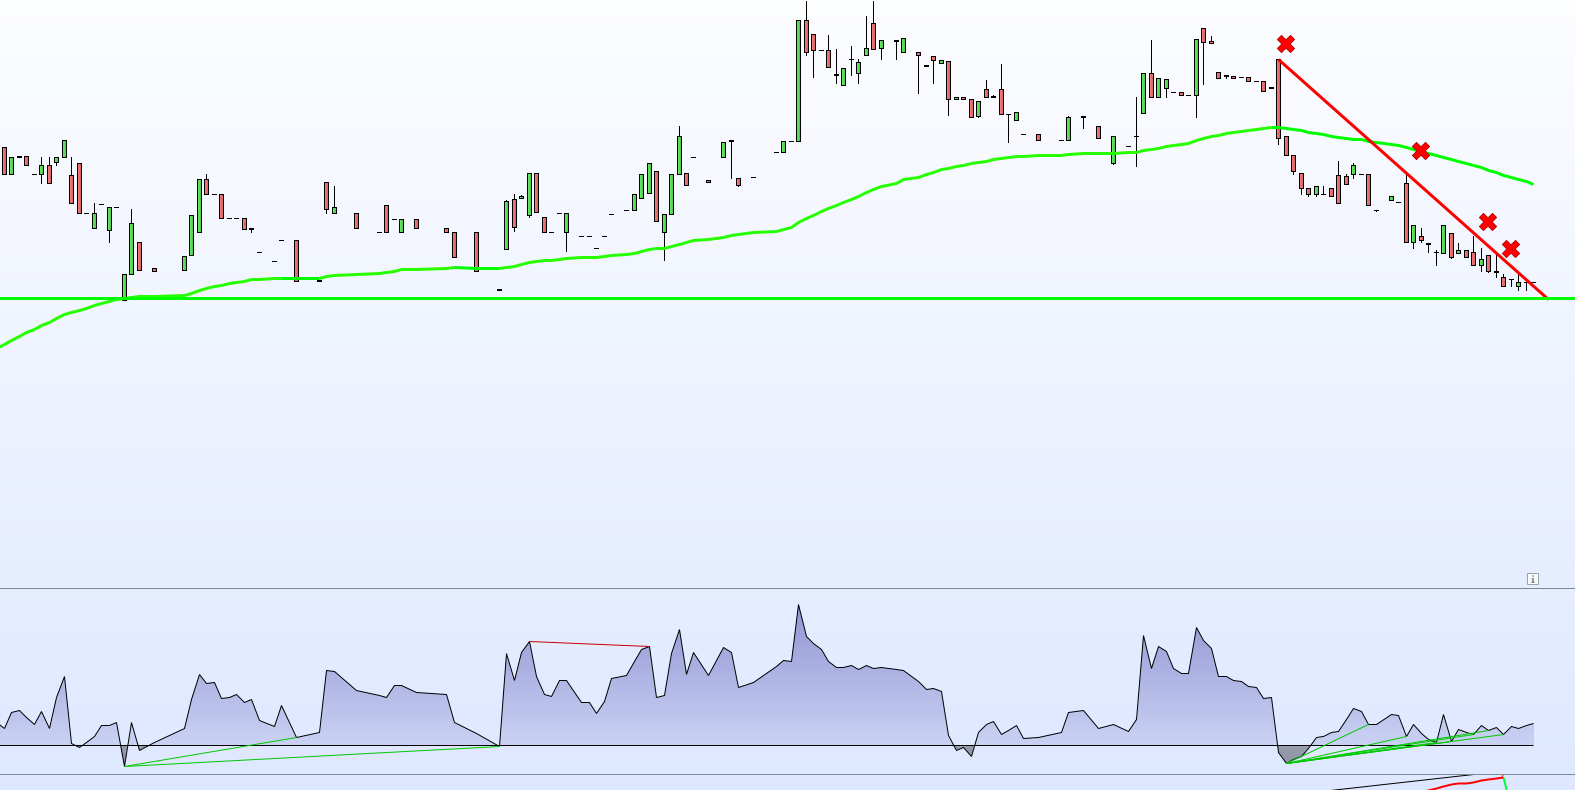
    Que localice valores en máximos con sucesivos mínimos decrecientes y que se de en el mismo una Divergencia en el indicador Bollinger %B.

    Adjunto figura en la que se observa, creo, lo que pretendo

    Gracias,

    MAXIMOS-CON-MINIMOS-DECRECIENTES.png MAXIMOS-CON-MINIMOS-DECRECIENTES.png
    #246914 quote
    Maricarmen
    Participant
    Veteran

    Perdón quise decir con sucesivos máximos decrecientes tal como se aprecia en el gráfico.

    #246933 quote
    Iván González
    Moderator
    Legend

    buenas. he reutilizado uno de los indicadores publicados para adaptarlo a cualquier oscilador.
    De esta forma definiendo la variable osc se pueden calcular los pivots de ésta, compararlo con el precio y así ver si hay o no divergencia.

    //----------------------------------------------//
    //PRC_Any OSCILLATOR Divergence Indicator
    //version = 0
    //09.05.25
    //Iván González @ www.prorealcode.com
    //Sharing ProRealTime knowledge
    //----------------------------------------------//
    //-----Inputs-----------------------------------//
    //----------------------------------------------//
    src=close
    lbr=5 //pivot lookback Right
    lbl=5 //pivot lookback Left
    rangeUpper=60 //Max lookback range
    rangeLower=5 //Min lookback range
    plotBull=1
    plotHiddenBull=1
    plotBear=1
    plotHiddenBear=1
    //----------------------------------------------//
    //-----OSCILLATOR Calculation-------------------//
    //----------------------------------------------//
    len=20
    bbtop=bollingerup[len](src)
    bbbot=bollingerdown[len](src)
    pctBol=(src-bbbot)/(bbtop-bbbot)*100
    
    osc=pctBol
    //----------------------------------------------//
    //-----Pivots High and Low----------------------//
    //----------------------------------------------//
    //---Pivots low
    if osc > osc[lbr] and lowest[lbr](osc) > osc[lbr] and osc[lbr] < lowest[lbl](osc)[lbr+1] then
    $ply[z+1] = osc[lbr]
    $plx[z+1] = barindex[lbr]
    $pricel[z+1] = low[lbr]
    drawpoint(barindex[lbr],osc[lbr],2)coloured("red",80)
    z = z + 1
    endif
    //---Pivots high
    if osc < osc[lbr] and highest[lbr](osc)<osc[lbr] and osc[lbr]>highest[lbl](osc)[lbr+1] then
    $phy[t+1]=osc[lbr]
    $phx[t+1]=barindex[lbr]
    $priceH[t+1]=high[lbr]
    drawpoint(barindex[lbr],osc[lbr],2)coloured("blue",80)
    t=t+1
    endif
    //---Pivot detection
    if z<>z[1] then
    plFound=1
    elsif t<>t[1] then
    phFound=1
    else
    plFound=0
    phFound=0
    endif
    
    barsPL=barssince(plFound[1])
    inrangePL=rangelower<=barsPL and barsPL<=rangeupper
    barsPH=barssince(pHFound[1])
    inrangePH=rangelower<=barsPH and barsPH<=rangeupper
    
    //----------------------------------------------//
    //-----Regular Bullish--------------------------//
    //----------------------------------------------//
    oscHL=osc[lbr]>$ply[max(0,z-1)] and inrangePL
    priceLL=low[lbr]<$pricel[max(0,z-1)]
    bullCondAlert=priceLL and oscHL and plFound
    bullCond=plotBull and bullCondalert
    
    if plFound  and bullCond then
    drawsegment($plx[max(0,z-1)],$ply[max(0,z-1)],$plx[z],$ply[z])coloured("green")style(line,2)
    endif
    //----------------------------------------------//
    //-----Hidden Bullish---------------------------//
    //----------------------------------------------//
    oscLL=osc[lbr]<$ply[max(0,z-1)] and inrangePL
    priceHL=low[lbr]>$pricel[max(0,z-1)]
    hiddenBullCondAlert=priceHL and oscLL and plFound
    hiddenBullCond=hiddenBullCondAlert and plotHiddenBull
    
    if plFound and hiddenBullCond then
    drawsegment($plx[max(0,z-1)],$ply[max(0,z-1)],$plx[z],$ply[z])coloured("green",80)style(line,2)
    endif
    //----------------------------------------------//
    //-----Regular Bearish--------------------------//
    //----------------------------------------------//
    oscLH=osc[lbr]<$phy[max(0,t-1)] and inrangePH
    priceHH=high[lbr]>$priceH[max(0,t-1)]
    bearCondAlert=priceHH and oscLH and pHFound
    bearCond=plotBear and bearCondalert
    
    if pHFound  and bearCond then
    drawsegment($phx[max(0,t-1)],$phy[max(0,t-1)],$phx[t],$phy[t])coloured("red")style(line,2)
    endif
    //----------------------------------------------//
    //-----Hidden Bearish---------------------------//
    //----------------------------------------------//
    oscHH=osc[lbr]>$phy[max(0,t-1)] and inrangePH
    priceLH=high[lbr]<$priceh[max(0,t-1)]
    hiddenBearCondAlert=priceLH and oscHH and phFound
    hiddenBearCond=hiddenBearCondAlert and plotHiddenBear
    
    if pHFound and hiddenBearCond then
    drawsegment($phx[max(0,t-1)],$phy[max(0,t-1)],$phx[t],$phy[t])coloured("red",80)style(line,2)
    endif
    //----------------------------------------------//
    return osc as "Oscillator"coloured("blue")style(line,2)
    
Viewing 3 posts - 1 through 3 (of 3 total)
  • You must be logged in to reply to this topic.

ProRealAI ProRealAI New

Stuck on this ProBuilder code?

Describe what this topic is trying to build, in plain English, and ProRealAI writes the ProRealTime™ indicator, screener or system for you.

Available in 7 languages
Try ProRealAI

Bollinger Divergencia %B


ProScreener: Buscadores de Mercado y Rastreo

New Reply
Author
author-avatar
Maricarmen @maricarmen Participant
Summary

This topic contains 2 replies,
has 2 voices, and was last updated by Iván González

1 year, 4 months ago.

Topic Details
Forum: ProScreener: Buscadores de Mercado y Rastreo
Language: Spanish
Started: 05/08/2025
Status: Active
Attachments: 1 files
Logo Logo
Loading...