So im making a tool that analyses my systems, but i need the underlying market data, so for example i would love to see the open, close, high, low of every candle in the chart. (on any timeframe)
Could i perhaps make a system that trades on every candle to get that info?
Any thoughts?
Perhaps I am being stupid but can’t we get the OHLC of any candle on a chart very easily already?
open[x]
high[x]
low[x]
close[x]
maybe im the stupid one but how would i use that?
I would love a way to extract the high, low, open, close of every candle to excel.
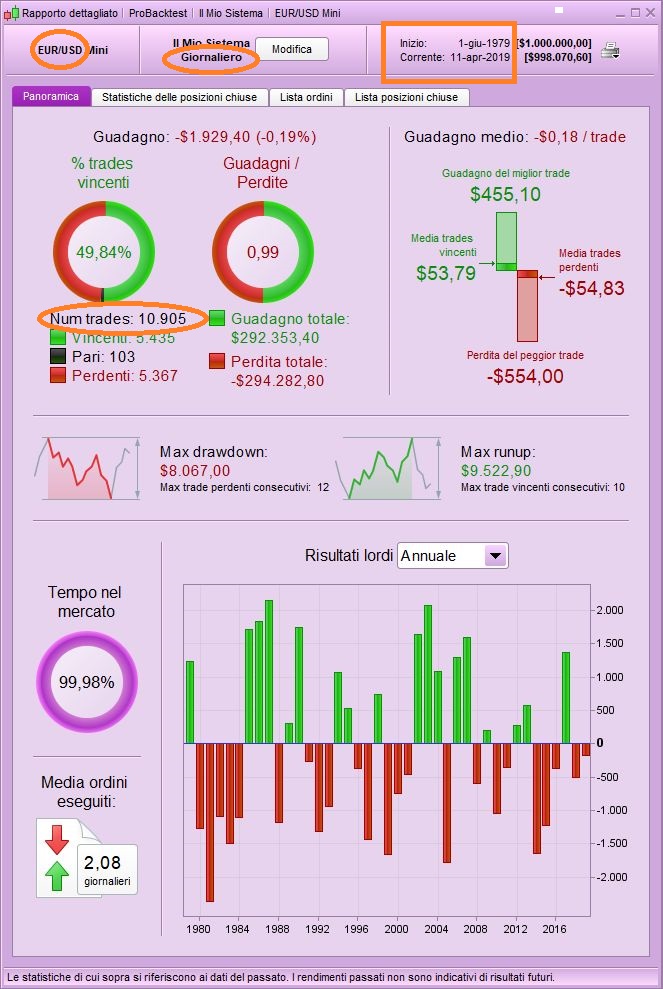
i was thinking that if i could “buy the open” and hold thru the candle then buy the next candle and so on, i could see the high/low with the mfe/mae on the detailed report but i guess thats faulty thinking anyways because it wouldnt say what the price is but rather the +/- of pips, which might help but i dunno..
excel
The critical missing bit of information from your topic title and first post! I’ve edited your title.
There’s no way to export candles’data. Just use a pen and plenty of paper!
I don’t think any broker would let anyone do this, maybe some make that data avilable if you pay a fee.
Well i guess i could calculate it if i could buy at opening and sell at close, using mfe and mae in detailed report, on every candle? Is this possible?
Thanks for the edit Vonasi.
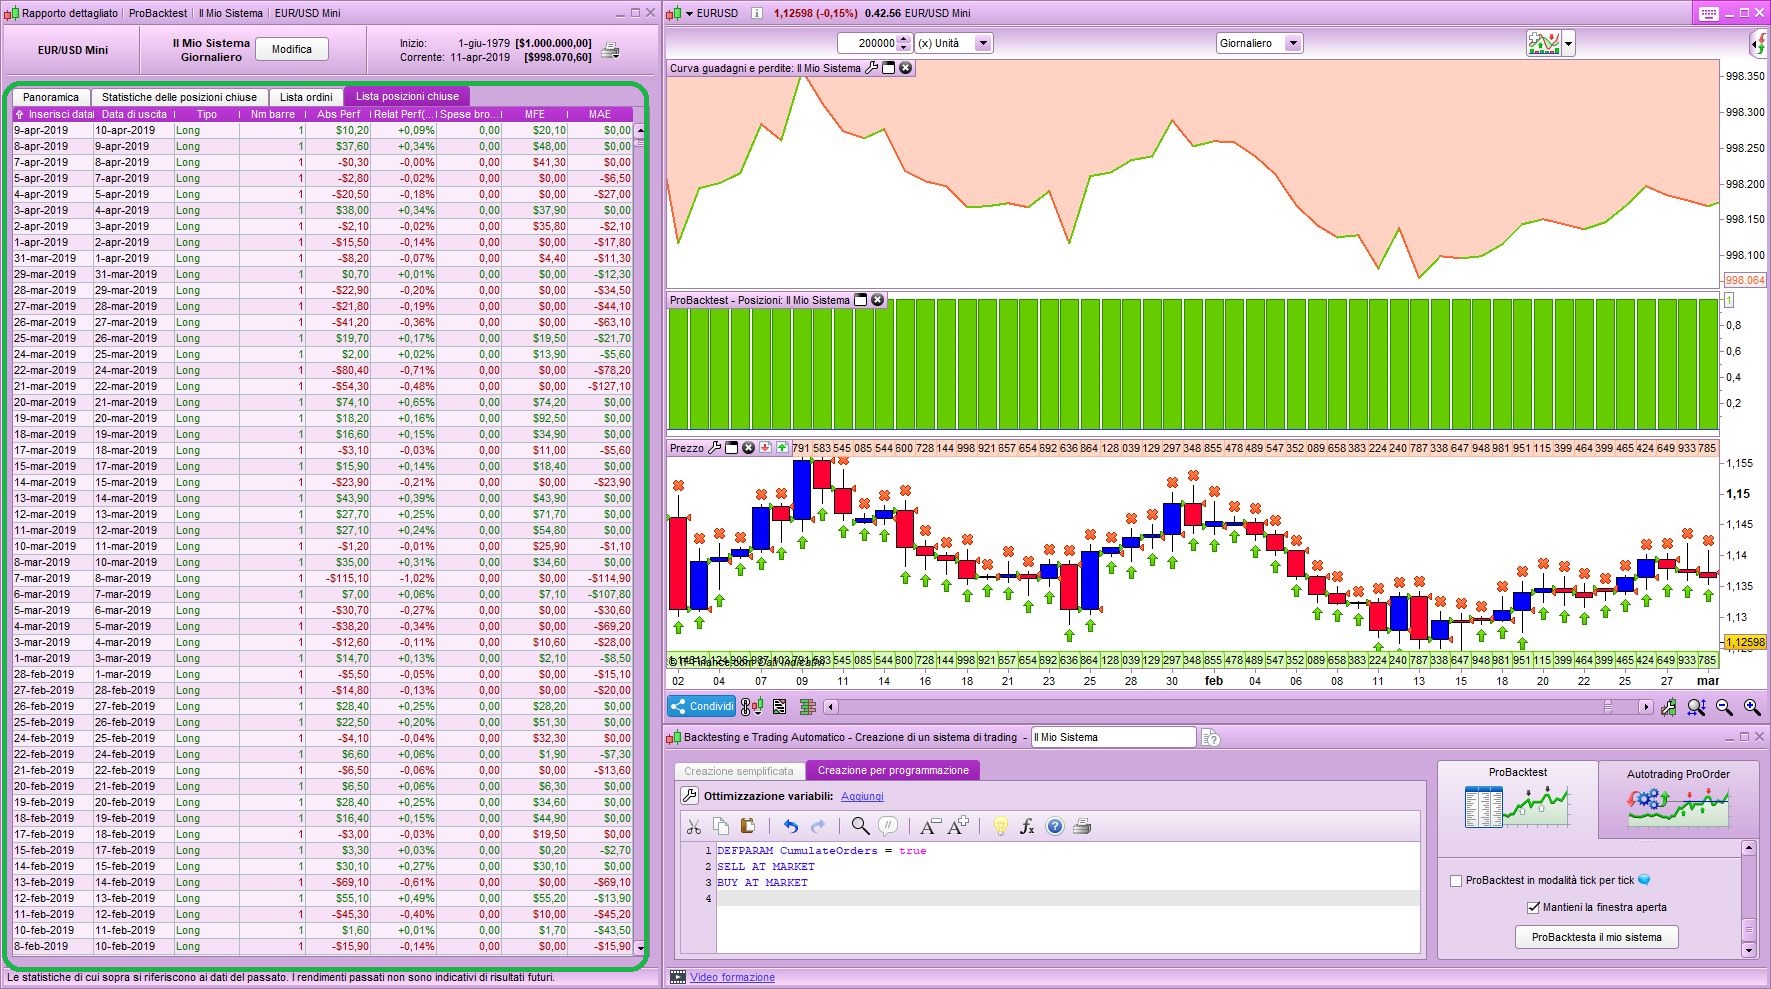
Use this code, then drag data from report to excel:
DEFPARAM CumulateOrders = true
SELL AT MARKET
BUY AT MARKET
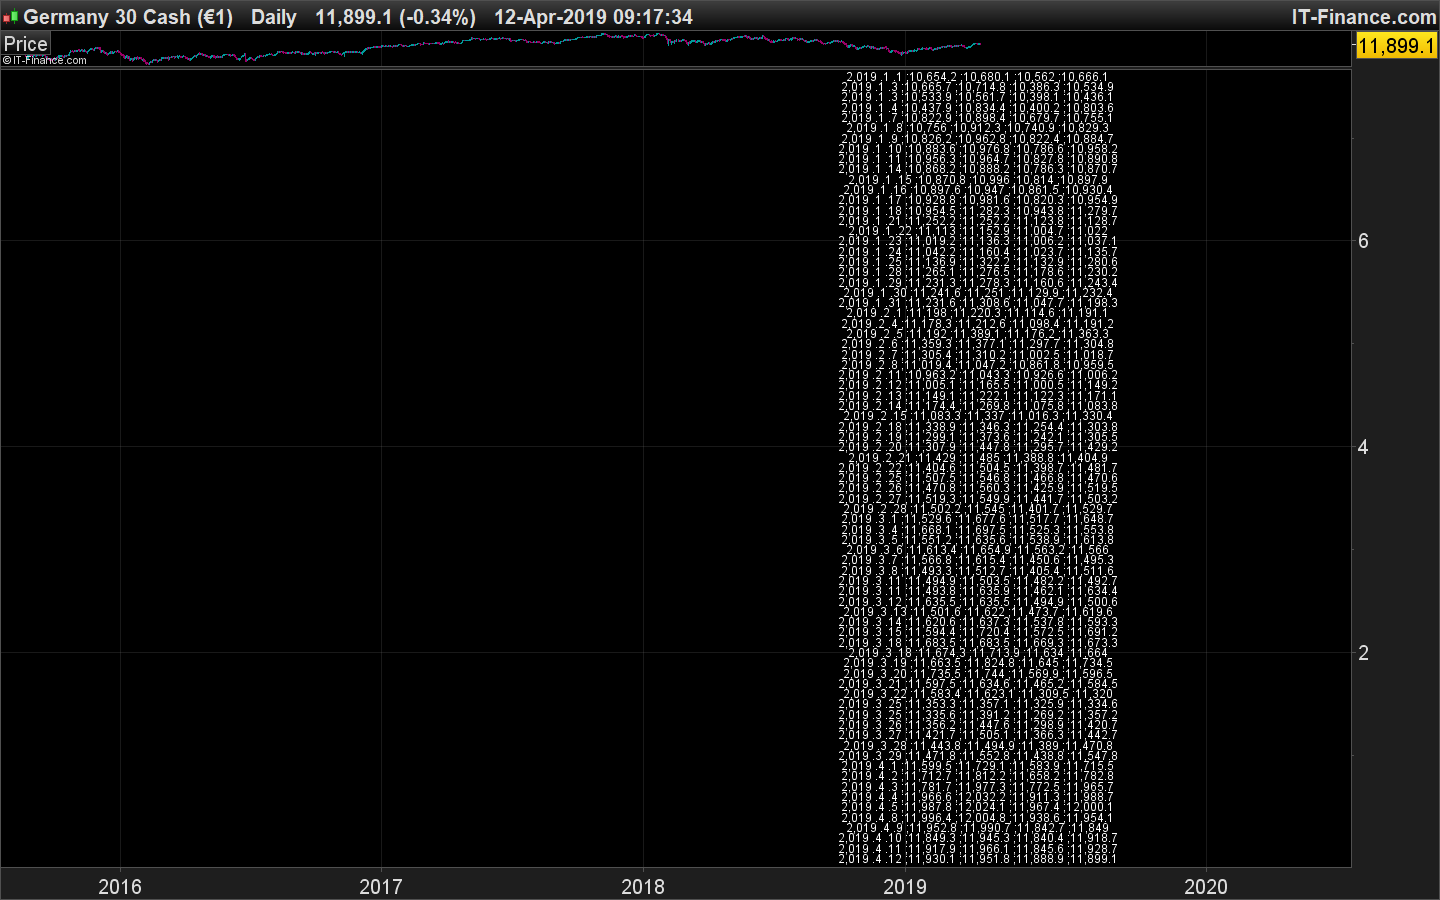
Another solution would be to drawtext every OHLC on the chart, make a screenshot or a PDF of the screen and send it through an OCR software. I should try to code something 🙂
This code works only for daily timeframe:
defparam drawonlastbaronly=true

startDate = 20190101

once plotted=0
if date=startDate then
startbar=barindex
endif
if date=today and not plotted then
for i = 0 to barindex-startbar do
iday=day[i]
imonth=month[i]
iyear=year[i]
iopen=open[i]
ihigh=high[i]
ilow=low[i]
iclose=close[i]
y=i*0.1
drawtext("#iyear#.#imonth#.#iday#;#iopen#;#ihigh#;#ilow#;#iclose#",barindex,y,dialog,standard,12)
next
plotted=1
endif

return
Let’s try an OCR now..
OCR works, but the result is not yet perfect, should try black text on white background and/or with larger text. The thousand separator with comma is also annoying..
I used this website: https://www.onlineocr.net/
I was able to generate a txt file and imported it as text data into an Excel worksheet as data separated with semicolon.
Damn, was hoping there was some sort of way… oh well..
Anyone got a good idea on how to calculate Beta (on ur system), which needs the underlying markets data?, without getting that data?
 Bard
BardParticipant
Master
Thanks Nicolas, okay so there is a kind of work around. A couple of thoughts:
What is line 18 for?
How would I derive the values for say, eg Ehler’s Universal Oscillator, a Zero Lag Average and a DPO or COG?
I’m not clear how you lift the data in your image into a text file for the OCR website assuming there are more rows than a snapshot can take for the OCR s/ware?
Cheers,
Y variable is the price coordinate.
How would I derive the values for say, eg Ehler’s Universal Oscillator, a Zero Lag Average and a DPO or COG?
By learning how to use a loop 😉
BardParticipant
Master
I’m guessing a blank indicator (whether the background is white or black) isn’t right? Loops, yes I’m familiar with the concept!
I tried an RSI but got a warning about a positive integer is needed for the RSI?
Then I added Ehler’s Oscillator, my original Ehler’s indicator returns the “Result” of the oscillator and the 0 as “0.” I also have the bandedge added as a variable in the indicator.
So its warning me: The function “Ehler’s Unic Osc SuperSmoother” called from “Get OHLC Data” returns 2 values but your code needs 1…. but I am not sure how to correct the syntax because I am already using an “=” sign straight after the “UnivOsc ” (pls see second line) but I need to use “indicator1, ignored = Call….” and that’s two equals signs in one line?
Cheers again,
defparam drawonlastbaronly=true

//UnivOsc = indicator1, ignored = Call "Ehler's Univ Osc SuperSmoother"
UnivOsc = Call "Ehler's Univ Osc SuperSmoother"[25]

startDate = 20190522
once plotted=0
if date=startDate then
startbar=barindex
endif
if date=today and not plotted then
for i = 0 to barindex-startbar do
iday=day[i]
imonth=month[i]
iyear=year[i]
iopen=open[i]
ihigh=high[i]
ilow=low[i]
iclose=close[i]
iRSI = RSI[i]
iUnivOsc = UnivOsc[i]
y=i*0.1
drawtext("#iyear#.#imonth#.#iday#;#iopen#;#ihigh#;#ilow#;#iclose#;#iRSI#;#iUnivOsc#",barindex,y,dialog,standard,12)
next
plotted=1
endif

return
BardParticipant
Master
I meant, the indicator — even in it’s original form — doesn’t produce anything, regardless of a white or black background?
I have it set on daily £/$ candles.
Any ideas? (Anything to avoid having to use Yahoo Finance O/H/L/C and formulate indicator values in Excel!). Cheers,