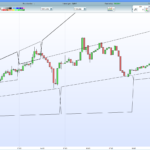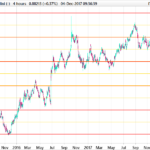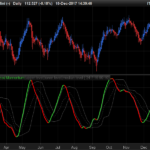






ZigZag indicator V6 + Stats + Levels
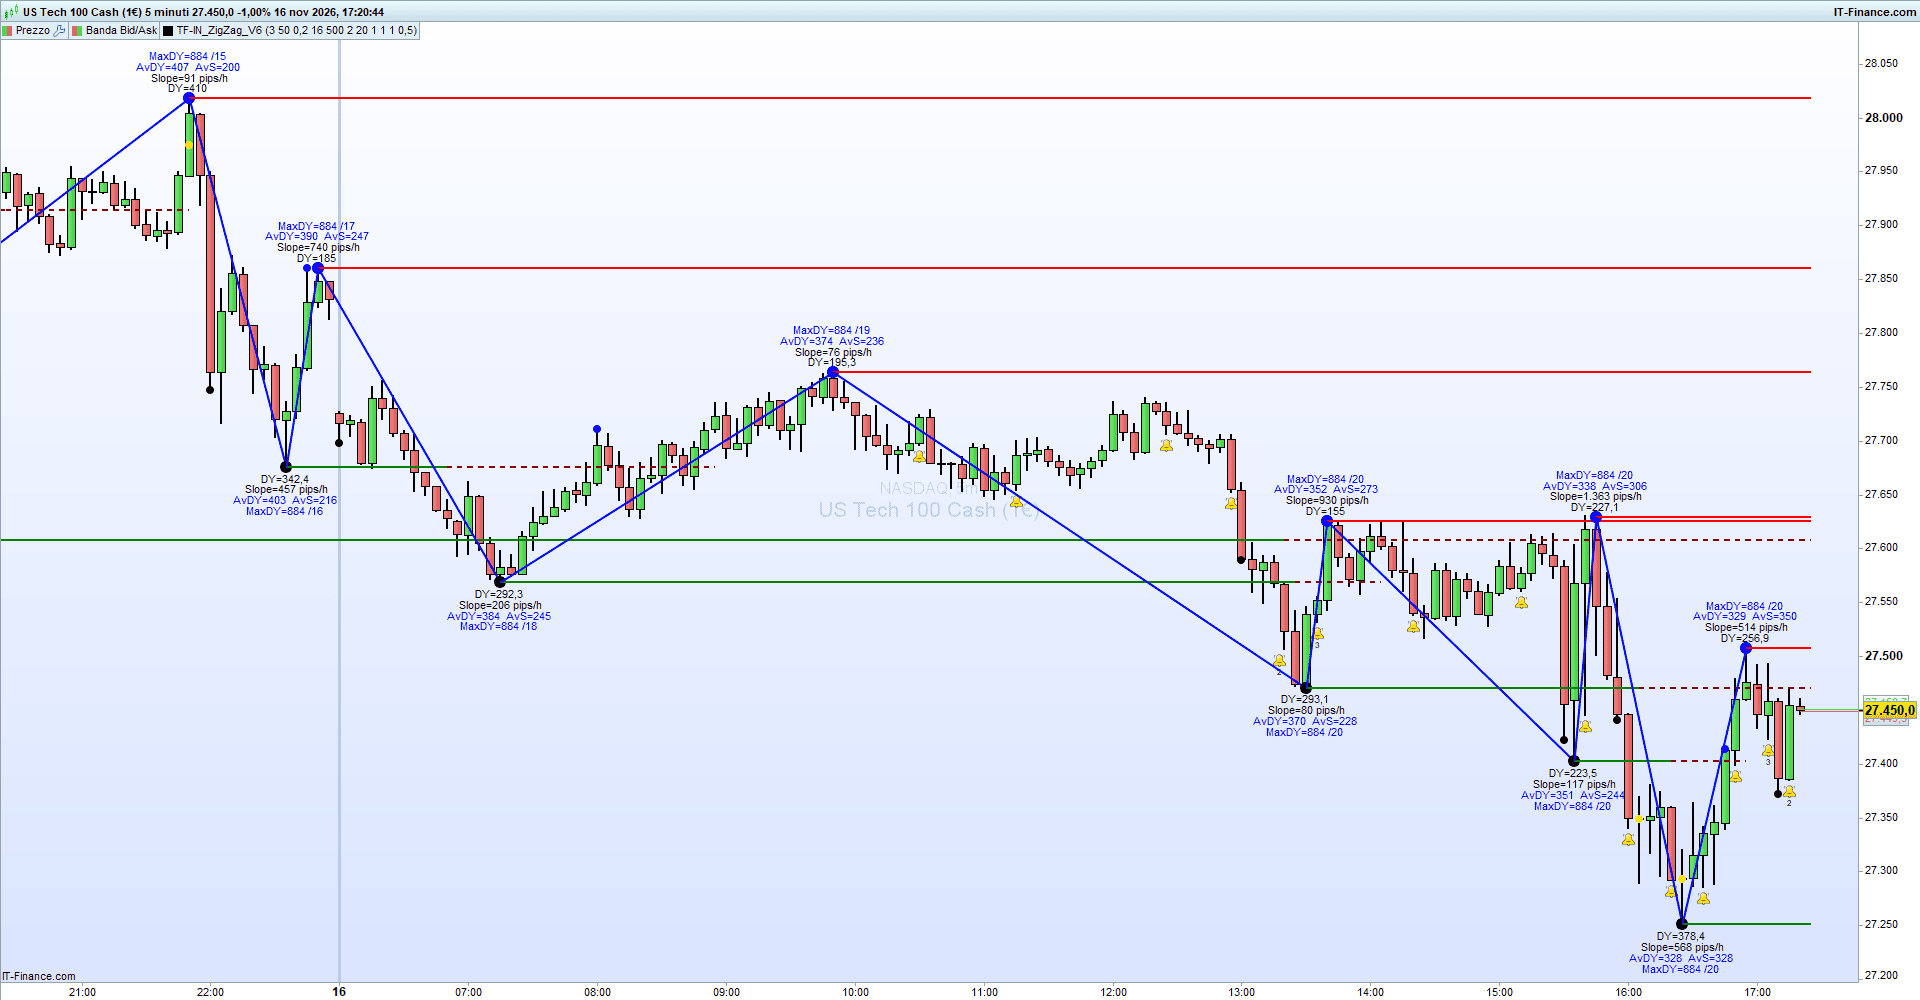
New version of Zig Zag, featuring additional graphical and statistical elements.
Note: The segment currently forming does not repaint. The indicator highlights the specific candle at which the previous segment becomes finalized.
Operation
Four operating modes:
- Type=1: DeltaY is determined by a threshold in pips (ZZPointsT1).
- Type=2: DeltaY is a percentage of the instrument’s price (ZZPercT2; it uses the previous day’s closing price, which remains constant throughout the current day).
- Type=3: DeltaY is a percentage of the 5-day daily ATR (Average True Range).
- Type=4: DeltaY is a percentage of the 14-period ATR for the current timeframe.
Option to select which part of the candle is used for plotting the angles:
- VarType=1: Custom close.
- VarType=2: Uses lows and highs alternately for the lower and upper vertices.
Statistics
The last N segments—determined by the “Segments” variable—are stored in a FIFO (First-In, First-Out) array, including their X, Y, Type, LevelStatus, and Slope values, which can then be used for further calculations. The most recent value is inserted at index 0 of the array, while the oldest value at the end of the table is removed.
In this version, setting “Stats=1” identifies the maximum and average values within the dataset and highlights the candles associated with segments that exceed the average size (serving as a pre-alert for a Zig-Zag reversal). Additionally, the average slope of the segments is calculated, expressed in pips per hour, regardless of the timeframe being used.
Info
The “Info” variable allows for the display of additional information:
- Info=1: Displays the size and slope of each segment.
- Info=2: Displays a table showing the status of all values currently stored in the array.
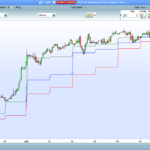
Levels
The “Levels” variable enables the plotting of support/resistance levels, starting from the confirmed vertices of the Zig-Zag pattern stored in the array. Naturally, levels associated with values that are removed from the array will also cease to be plotted (as they would become outdated, depending on the “Levels” setting).
The code in this version handles color changes when a level is broken (e.g., a broken resistance level becomes a potential support level, and vice versa). Upon a second breakout, the level is considered deactivated.
A breakout is triggered when a subsequent candle’s High and Low both extend beyond the level. A tolerance threshold can be applied using the “KLevStateChange” parameter, which adds a portion of the current ATR (Average True Range) to the level’s threshold.
This version works on any instrument and across any timeframe.
//V6 16/11/2026 - T.F. - ZigZag code with Array
//V6 general general overhaul, with a single array for per zzHigh e zzLow, added type 3 and 4, error correction, statistics, levels

//Variables:
//ZZType=3 //1=pips; 2=perc; 3=perc on ATRD6; 4==perc on ATR current timeframe
//ZZPointsT1=50 //Pips using Type=1
//ZZPercT2=0.25 //% of price using Type=2
//ZZPercT3=15 //% of ATRD5 using Type=3
//ZZPercT4=500 //% of ATR14 current timeframe using Type=4
//VarType=2 //1=customclose; 2=High/Low
//Segments=40  //n. segments up/dw to store in the array
//Info=0 //1=show slope and delta between points; 2=show array contents;
//Stats=0 //1=show max and average DY of array content
//Levels=0 //1=show levels with resistance and support management
//KLevStateChange=0.5 //ATR multiplier for the current timeframe, used for managing level state changes

//define first point of ZZ
once LastPoint = 1
once Hx0    = barindex
once Hy0    = Close
once Lx0    = barindex
once Ly0    = Close
//initializing array
once $zzX[0] = barindex //barindex vertex
once $zzY[0] = Close    //price level vertex
once $zzT[0] = 1        //vertex type: 1=high ;-1=low
once $zzLS[0] = 1       //level status: 1=resistence; -1=support; 11=resistace (was a broken support); -11=support (was a broken resistace)
once $zzS[0] = 0        //slope previous segment

//ZZ Type
If ZZType=1 then //ZZ in pips
DeltaY=ZZPointsT1*pipsize
elsif ZZType=2 then //ZZ in % of price
DeltaY=ZZPercT2/100*Dclose(1) //Dclose used as ref.
elsif ZZType=3 then //ZZ in % of AtrD5
if day<>day[1] then
AtrD5=(Dhigh(5)-Dlow(5)+Dhigh(4)-Dlow(4)+Dhigh(3)-Dlow(3)+Dhigh(2)-Dlow(2)+Dhigh(1)-Dlow(1))/5
endif
DeltaY=ZZPercT3/100*AtrD5
elsif ZZType=4 then //ZZ in % of Atr14 current timeframe
DeltaY=ZZPercT4/100*averagetruerange[14](close)
endif

//Variable Type
if Vartype=1 then
VarH=Customclose
VarL=customclose
elsif Vartype=2 then
VarH=High
VarL=Low
endif

//ZZ in phase 1 - now search for a new lower vertex
if LastPoint=1 then //lastpoint was a top - start search for a bottom
if VarH>Hy0 then //update last top and stay in LastPoint=1
Hy0=VarH
Hx0=barindex
//drawpoint(Hx0,Hy0,2) coloured("blue") //new temporary top
if abs(Hy0-Ly0)>AvDeltaZZ*pipsize and stats=1 and (date=today OR date=Yesterday) then
drawpoint (barindex,(open+close)/2,2) coloured("yellow")
//drawarrowdown(barindex,(open+close)/2) coloured("cyan")
endif
//drawsegment(Lx0,Ly0,Hx0,Hy0) //new temporary segment
elsif VarL<(Hy0-DeltaY) and barindex>Hx0+1 then //first point in low - confirm last top stored Hy0
for i=Segments-1 downto 0 do //array shifting
$zzX[i+1]=$zzX[i]
$zzY[i+1]=$zzY[i]
$zzT[i+1]=$zzT[i]
$zzLS[i+1]=$zzLS[i]
$zzS[i+1]=$zzS[i]
next
drawsegment(Lx0,Ly0,Hx0,Hy0) coloured ("blue") style (line,2)
drawpoint(Hx0,Hy0,3) coloured ("blue") //new final ZZhigh
Slope=round(abs((Hy0-Ly0)/pipsize/(Hx0-Lx0)/gettimeframe*3600)) //slope in pips/hour
$zzX[0]=Hx0 //store last index ZZhigh
$zzY[0]=Hy0 //store last value ZZlhigh
$zzT[0]=1   //type high
$zzLS[0]=1  //level status=resistance
$zzS[0]=slope //slope
if Info=>1 then //delta & slope
dy=abs((Hy0-Ly0)/pipsize)
drawtext ("DY=#dy#",Hx0,Hy0+10*pipsize)
drawtext ("Slope=#slope#pips/h",Hx0, Hy0+20*pipsize)
endif
if Info=2 then //array contents
for i=0 to segments do
n=i
a=$zzX[i]
b=$zzY[i]
c=$zzT[i]
d=$zzLS[i]
e=$zzS[i]
drawtext("#n# #a# #b# #c# #d# #e#", Hx0, Hy0+50*pipsize+i*5*pipsize)
next
endif
//store new temporary low and change lastpoint status
Ly0=VarL
Lx0=barindex
drawpoint(Lx0,Ly0,2) coloured("black") //first temporary low
LastPoint=-1
endif
endif

//ZZ in phase -1 - now search for a new higher vertex
if LastPoint=-1 then //lastpoint was a low - start search for a top
if VarL<Ly0 then //update last low and stay in LastPoint=-1
Ly0=VarL
LX0=barindex
//drawpoint(Lx0,Ly0,2) coloured("black") //new temporary low
if abs(Hy0-Ly0)>AvDeltaZZ*pipsize and stats=1 and (date=today OR date=Yesterday) then
drawpoint(barindex,(open+close)/2,2) coloured("yellow")
//drawarrowup(barindex,(open+close)/2) coloured("magenta")
endif
//drawsegment(Lx0,Ly0,Hx0,Hy0) //new temporary segment
elsif VarH>(Ly0+DeltaY) and barindex>Lx0+1 then //first point in top - confirm last low stored Ly0
for i=Segments-1 downto 0 do  //array shifting
$zzX[i+1]=$zzX[i]
$zzY[i+1]=$zzY[i]
$zzT[i+1]=$zzT[i]
$zzLS[i+1]=$zzLS[i]
$zzS[i+1]=$zzS[i]
next
drawsegment(Hx0,Hy0,Lx0,Ly0) coloured ("blue") style (line,2)
drawpoint(Lx0,Ly0,3) coloured ("black") //new final ZZlow
Slope=round(abs((Hy0-Ly0)/pipsize/(Hx0-Lx0)/gettimeframe*3600)) //slope in pips/hour
$zzX[0]=Lx0  //store last index ZZlow
$zzY[0]=Ly0  //store last value ZZlow
$zzT[0]=-1   //type low
$zzLS[0]=-1  //level status=support
$zzS[0]=slope //slope
if Info=>1 then //delta & slope
dy=abs((Hy0-Ly0)/pipsize)
drawtext ("DY=#dy#",Lx0,Ly0-10*pipsize)
drawtext ("Slope=#slope#pips/h",Lx0,Ly0-20*pipsize)
endif
if Info=2 then //array contents
for i=0 to segments do
n=i
a=$zzX[i]
b=$zzY[i]
c=$zzT[i]
d=$zzLS[i]
e=$zzS[i]
drawtext("#n# #a# #b# #c# #d# #e#", LX0, Ly0-50*pipsize-i*5*pipsize)
next
endif
//store new temporary high and change lastpoint status
Hy0=VarH
Hx0=barindex
drawpoint(Hx0,Hy0,2) coloured("blue") //first temporary top
LastPoint=1
endif
endif

//STATISTICS
//search for mean and maximum values, segments, and slope
if stats=1 and lastpoint<>lastpoint[1] and (date=today OR date=Yesterday) then
SumDeltaZZ=0
SumValue=0
MaxDeltaZZ=0
SumSlope=0
for i=0 to lastset($zzY)-1 do
if $zzX[i]<>0 then //nel caso in n. di segmenti sia eccessivo per le candele sul grafico
SumDeltaZZ=SumDeltaZZ+abs($zzY[i]-$zzY[i+1])
SumSlope=SumSlope+$zzS[i]
SumValue=SumValue+1
if abs($zzY[i]-$zzY[i+1])>MaxDeltaZZ then
MaxDeltaZZ=abs($zzY[i]-$zzY[i+1])
endif
endif
next
AvDeltaZZ=SumDeltaZZ/SumValue
AvSlope=SumSlope/SumValue
aa=round(AvDeltaZZ/pipsize) //average in pips for text
bb=round(AvSlope)
drawtext("AvDY=#aa# AvS=#bb#", $zzX[0],$zzY[0]+30*pipsize*$zzT[0]) coloured ("blue")
cc=MaxDeltaZZ/pipsize //max value in pips for text
drawtext("MaxDY=#cc#/#SumValue#", $zzX[0],$zzY[0]+40*pipsize*$zzT[0]) coloured ("blue")
endif

//LEVELS
atrCT=averagetruerange[14](close)*KLevStateChange
if levels=1 then
//primo tratto dal vartice al punto di cambio stato ZZ
if lastpoint crosses under 0 then
drawsegment(Hx0,Hy0,barindex,Hy0) coloured ("red") style (line,2)
endif
if lastpoint crosses over 0 then
drawsegment(Lx0,Ly0,barindex,Ly0) coloured ("green") style (line,2)
endif
for i=0 to lastset($zzY) do
//cambio stato livelli
if $zzLS[i]=1 and low>$zzY[i]+atrCT then //Resistance level broken, it becomes support and changes color.
$zzLS[i]=-11
endif
if $zzLS[i]=-11 and high<$zzY[i]-atrCT then //Level that has become a support is broken a second time, it is deactivated.
$zzLS[i]=0
endif
if $zzLS[i]=-1 and high<$zzY[i]-atrCT then //Support level broken, it becomes resistance and changes color.
$zzLS[i]=11
endif
if $zzLS[i]=11 and low>$zzY[i]+atrCT then //Level that has become a resistance is broken a second time, it is deactivated.
$zzLS[i]=0
endif
//grafica segmenti - traciati solo da quando il vertice è confermato
if $zzLS[i]=1 then
drawsegment(barindex,$zzY[i],barindex+1,$zzY[i]) coloured ("red") style (line,2)
elsif $zzLS[i]=11 then
drawsegment(barindex,$zzY[i],barindex+1,$zzY[i]) coloured ("darkred") style (dottedline,2)
elsif $zzLS[i]=-1 then
drawsegment(barindex,$zzY[i],barindex+1,$zzY[i]) coloured ("green") style (line,2)
elsif $zzLS[i]=-11 then
drawsegment(barindex,$zzY[i],barindex+1,$zzY[i]) coloured ("darkgreen") style (dottedline,2)
endif
next
endif

return