







Volume Surprise
Introduction
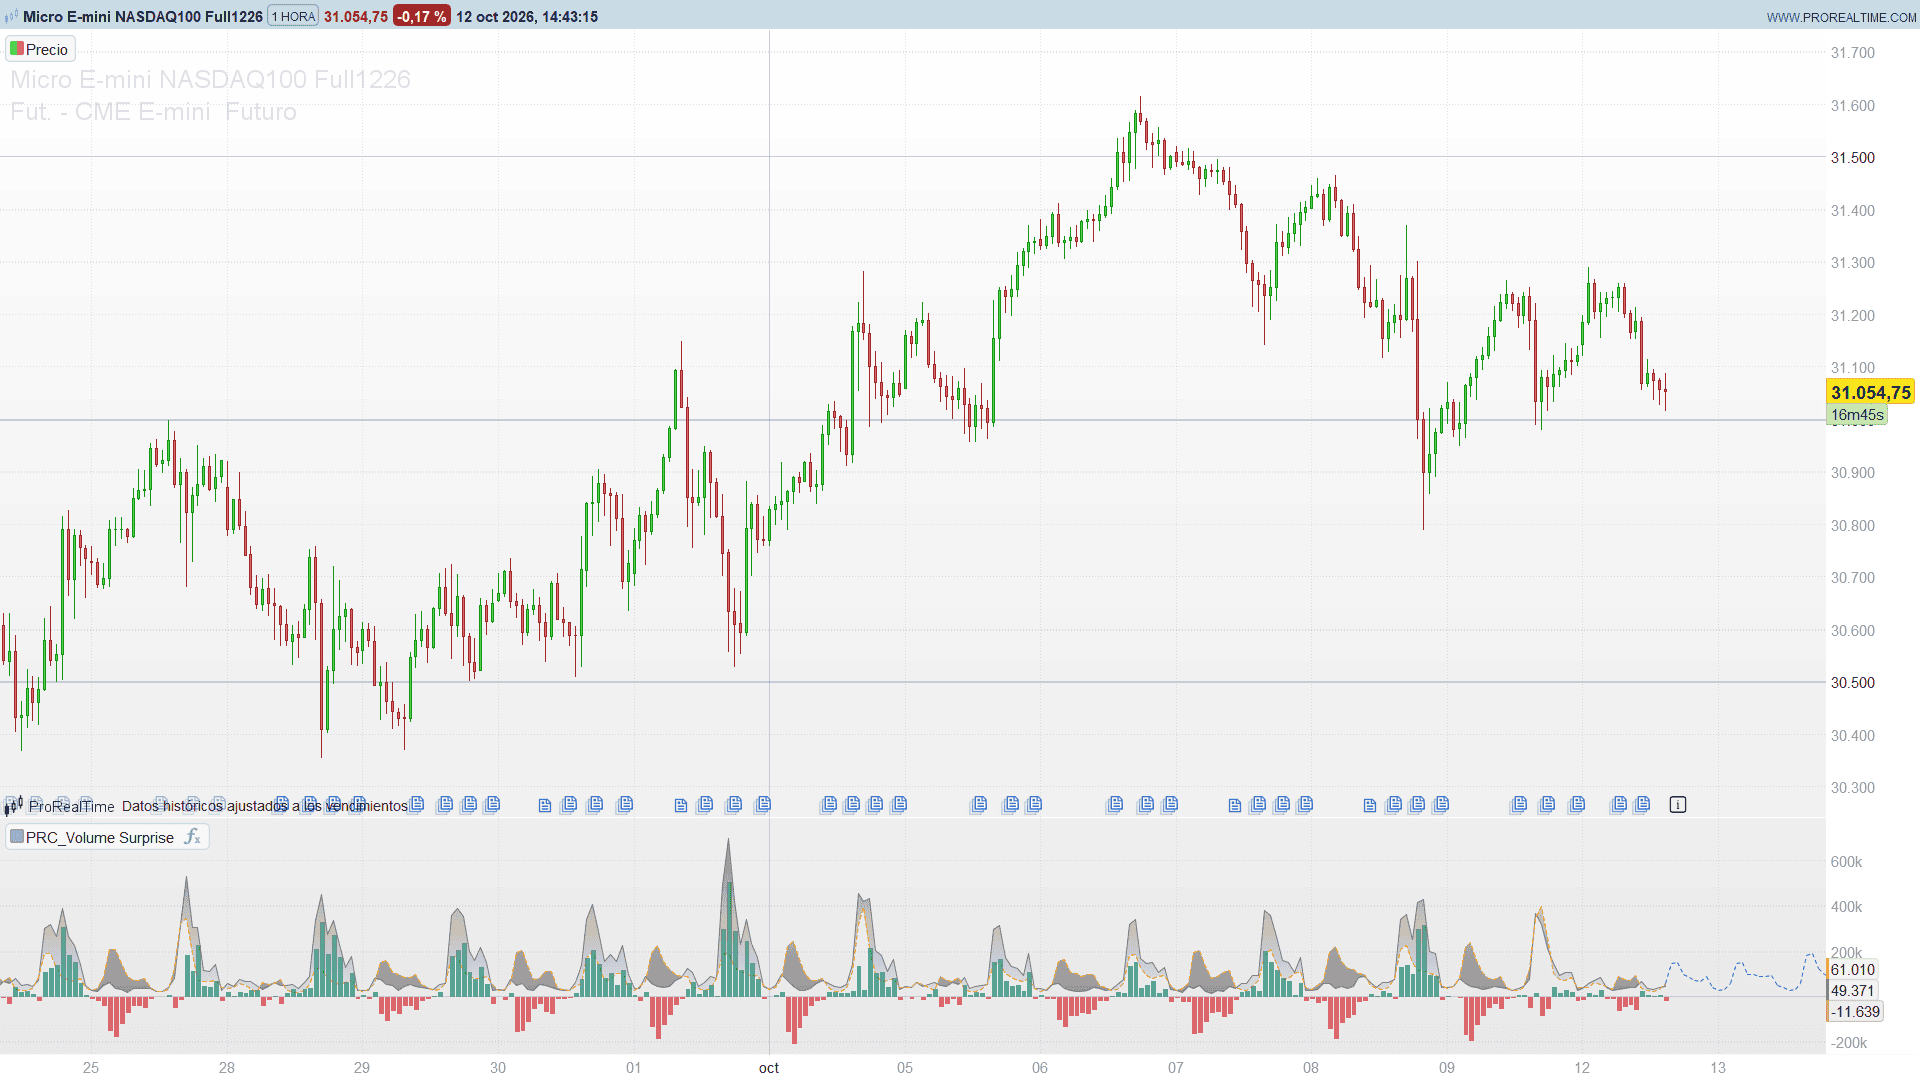
Raw volume is hard to judge on its own. Two thousand contracts at the open may be a quiet bar, while the same two thousand at lunchtime may be exceptional. Volume Surprise solves this by comparing each bar with what is normal for that moment of the session: the volume traded at the same time on previous days, on the same weekday and hour, or in the same month, depending on the chart timeframe.
The indicator shows the current volume, the expected volume for that period and the difference between the two as green or red columns. On the last bar it also projects the expected volume of the coming bars, so you know in advance when activity usually picks up or fades.
Theory Behind the Indicator
Periods
Every bar is assigned to a period built from its opening time. With the automatic selection:
- below 1 hour (seconds and minutes charts), the period is the hour and minute of the bar, so each bar is compared with the bars that opened at the same time on previous sessions;
- from 1 hour up to intraday, the period is the day of the week and the hour, so Monday 10:00 is compared with previous Mondays at 10:00;
- on daily and higher timeframes, the period is the month of the year.
The hour uses a 12-hour clock: on markets that trade around the clock, 9:00 and 21:00 belong to the same period. With the automatic selection off you choose the parts yourself: minutes, hours, days (day of the week, of the month or of the year) and months.
Expected volume
For each period the indicator keeps the last 50 volumes (the length setting). The expected volume of a bar is the mean of those values, or a percentile of them if you prefer a robust measure. It is calculated before adding the current bar, so the bar is compared only with the past. An optional smoothing applies a simple moving average to volume before everything else.
Surprise
The difference column is volume minus expected volume. It is green when the bar trades more than usual for its period and red when it trades less.
Forecast
On the last bar the indicator looks at the periods of the next bars (50 by default) and draws the expected volume of each one as a line to the right of the panel. The sequence of upcoming periods is taken from the history of the instrument itself, so session closes, weekends and month changes follow the real trading calendar.
Key Features at a Glance
- Expected volume per time of day, weekday and hour, or month, chosen automatically from the chart timeframe.
- Mean or percentile summary over a configurable number of past values.
- Green and red surprise columns.
- Forecast line with the typical volume of the next bars.
- Works on any timeframe, from seconds to monthly.
How to Read the Indicator
- Green columns mark bars that traded more than usual for their time. Repeated green columns during a move show real participation; a single large one often marks news or a climax.
- Red columns mark bars that traded less than usual. A breakout on red columns is weak: the market is moving without the volume that the time of day would normally bring.
- The dotted expected volume draws the intraday volume curve of the instrument: high at the open and close, lower in the middle of the session for most stocks.
- The forecast line tells you how active the next bars usually are. It helps to time entries, to avoid trading in the quietest part of the day, or to expect a pick-up in volume at a scheduled time.
Practical Applications
- Breakout confirmation. Accept breakouts that come with a positive surprise and be sceptical of those with a negative one.
- Session planning. Use the forecast to see when liquidity is usually highest for the instrument and timeframe you trade.
- Spotting unusual activity. A strong positive surprise in a period that is normally quiet often signals that something has changed for that market.
Indicator Configuration
Settings:
- length (default: 50): number of past values kept for each period.
- smooth (default: 1): length of the simple moving average applied to volume (1 = no smoothing).
Periods:
- autoFormat (default: 1): 1 chooses the periods from the chart timeframe; 0 uses the switches below.
- useMinutes (default: 1), useHours (default: 1), useDays (default: 0), useMonths (default: 0): parts of the bar time that define a period when autoFormat = 0.
- daysOption (default: 0): type of day used when days are part of the period: 0 day of the week, 1 day of the month, 2 day of the year.
Summary:
- summaryMethod (default: 0): 0 mean, 1 percentile.
- pctValue (default: 50): percentile used when summaryMethod = 1.
Forecast:
- showForecast (default: 1): 1 draws the forecast of the next bars.
- forecastWindow (default: 50): number of future bars projected (1 to 499).
- fcR, fcG, fcB: colour of the forecast line.
- fcStyle (default: 2): 0 solid, 1 dashed, 2 dotted.
Internal:
- tfWarm (default: 10): bars used to detect the chart timeframe before the first calculation.
- hashSize (default: 10007): size of the table that stores the periods; it must be larger than the number of different periods on the chart.
Leave some free space on the right of the chart (about 50 bars with the default settings) to see the forecast.
Code
//---------------------------------------------------------------
// PRC_Volume Surprise
// version = 0
// 12.10.2026
// Iván González @ www.prorealcode.com
// Author: LuxAlgo
// Sharing ProRealTime knowledge
//--------------------------------------------------------------------//
defparam drawonlastbaronly = true
//--------------------------------------------------------------------//
// Settings
//--------------------------------------------------------------------//
length = 50             // Values kept per period (minimum 1)
smooth = 1              // Volume smoothing: simple average of this many bars (minimum 1)
//--------------------------------------------------------------------//
// Periods: which parts of the bar time define "the same period"
//--------------------------------------------------------------------//
autoFormat = 1          // 1 = choose the periods from the chart timeframe (below 1 hour: hour + minute; 1 hour and above: day + hour; daily and above: month)
useMinutes = 1          // Used when autoFormat = 0
useHours = 1            // Used when autoFormat = 0 (12-hour clock, as in the original)
useDays = 0             // Used when autoFormat = 0
daysOption = 0          // Day type: 0 = day of week, 1 = day of month, 2 = day of year
useMonths = 0           // Used when autoFormat = 0
//--------------------------------------------------------------------//
// Summary
//--------------------------------------------------------------------//
summaryMethod = 0       // 0 = mean, 1 = percentile
pctValue = 50           // Percentile used when summaryMethod = 1
//--------------------------------------------------------------------//
// Forecast
//--------------------------------------------------------------------//
showForecast = 1        // 1 = project the expected volume of the next bars
forecastWindow = 50     // Number of future bars projected (1 - 499)
fcR = 41                // Forecast colour
fcG = 98
fcB = 255
fcStyle = 2             // 0 = solid, 1 = dashed, 2 = dotted
//--------------------------------------------------------------------//
// Internal
//--------------------------------------------------------------------//
tfWarm = 10             // Bars used to detect the chart timeframe before the first calculation
hashSize = 10007        // Size of the period table (more than the number of distinct periods)
//--------------------------------------------------------------------//
// Smoothed volume
//--------------------------------------------------------------------//
volS = average[smooth](volume)
volOk = 0
IF barindex >= smooth - 1 THEN
   IF volS >= 0 THEN
      volOk = 1
   ENDIF
ENDIF
//--------------------------------------------------------------------//
// Time components of each bar (opening time)
//--------------------------------------------------------------------//
hhS = floor(opentime / 10000)
miS = floor(opentime / 100) - hhS * 100
seS = opentime - floor(opentime / 100) * 100
h12S = hhS - floor(hhS / 12) * 12
moS = month
IF daysOption = 1 THEN
   dyS = day
ELSIF daysOption = 2 THEN
   IF year - floor(year / 4) * 4 = 0 THEN
      kLeap = 1
   ELSE
      kLeap = 2
   ENDIF
   dyS = floor(275 * month / 9) - kLeap * floor((month + 9) / 12) + day - 30
ELSE
   dyS = dayofweek
ENDIF
stampS = date * 1000000 + opentime
//--------------------------------------------------------------------//
// Chart timeframe: smallest gap in seconds between two bars of the same day
//--------------------------------------------------------------------//
ONCE tfSec = 0
ONCE modeSet = 0
ONCE fM = 0
ONCE fD = 0
ONCE fH = 0
ONCE fMi = 0
sNow = hhS * 3600 + miS * 60 + seS
IF barindex > 0 THEN
   IF date = date[1] THEN
      dtS = sNow - sNow[1]
      IF dtS > 0 THEN
         IF tfSec = 0 OR tfSec > dtS THEN
            tfSec = dtS
         ENDIF
      ENDIF
   ENDIF
ENDIF
IF barindex = tfWarm THEN
   fMi = useMinutes
   fH = useHours
   fD = useDays
   fM = useMonths
   IF autoFormat = 1 THEN
      IF tfSec = 0 THEN
         fMi = 0
         fH = 0
         fD = 0
         fM = 1
      ELSIF tfSec >= 3600 THEN
         fMi = 0
         fH = 1
         fD = 1
         fM = 0
      ELSE
         fMi = 1
         fH = 1
         fD = 0
         fM = 0
      ENDIF
   ENDIF
   modeSet = 1
ENDIF
//--------------------------------------------------------------------//
// Period tables live in arrays: arrays are NOT rewound between ticks,
// so every closed bar is stored exactly once ($gst[0] = last stored bar)
//--------------------------------------------------------------------//
IF barindex = 0 THEN
   UNSET($hk)
   UNSET($hs)
   UNSET($cnt)
   UNSET($head)
   UNSET($buf)
   $gst[0] = -1
   $gst[1] = 0
ENDIF
summary = 0
sumOk = 0
IF modeSet = 1 THEN
   curKey = (((fM * moS * 400 + fD * dyS) * 12 + fH * h12S) * 60 + fMi * miS) * 60 + seS
   //----------------------------------------------------------------//
   // Forecast anchor: the latest past bar at the same point of the cycle,
   // at least forecastWindow bars back. The bars that followed it give the
   // periods of the next bars.
   //----------------------------------------------------------------//
   anchorK = -1
   IF showForecast = 1 AND islastbarupdate THEN
      IF fM = 1 OR (fD = 1 AND daysOption >= 1) THEN
         yb = 1
         tgt = (date - 10000 * yb) * 1000000 + opentime
         k = 1
         WHILE anchorK = -1 AND barindex >= k DO
            IF tgt >= stampS[k] THEN
               IF k >= forecastWindow THEN
                  anchorK = k
               ELSE
                  yb = yb + 1
                  tgt = (date - 10000 * yb) * 1000000 + opentime
               ENDIF
            ELSE
               k = k + 1
            ENDIF
         WEND
      ELSE
         k = forecastWindow
         WHILE anchorK = -1 AND barindex >= k DO
            IF opentime[k] = opentime AND (fD = 0 OR dayofweek[k] = dayofweek) THEN
               anchorK = k
            ENDIF
            k = k + 1
         WEND
      ENDIF
   ENDIF
   nJobs = 0
   IF anchorK >= 1 THEN
      nJobs = forecastWindow
   ENDIF
   //----------------------------------------------------------------//
   // Operations, in order:
   //   1) store the closed bars not stored yet (oldest first)
   //   2) summary of the current bar, read BEFORE storing it
   //   3) forecast: summary of each projected period
   //   4) store the current bar if it is already closed (historical bar)
   //----------------------------------------------------------------//
   kFrom = max(0, barindex - ($gst[0] + 1))
   pushCur = 0
   IF NOT islastbarupdate AND barindex > $gst[0] THEN
      pushCur = 1
   ENDIF
   opCount = kFrom + 1 + nJobs + pushCur
   FOR op = 1 TO opCount DO
      isPush = 0
      extra = 0
      qJob = -1
      IF kFrom >= op THEN
         isPush = 1
         ofs = kFrom - op + 1
      ELSIF op = kFrom + 1 THEN
         qJob = 0
         ofs = 0
      ELSIF kFrom + 1 + nJobs >= op THEN
         qJob = op - kFrom - 1
         ofs = anchorK - qJob
      ELSE
         isPush = 1
         ofs = 0
      ENDIF
      opKey = (((fM * moS[ofs] * 400 + fD * dyS[ofs]) * 12 + fH * h12S[ofs]) * 60 + fMi * miS[ofs]) * 60 + seS[ofs]
      IF qJob >= 1 AND opKey = curKey AND volOk = 1 THEN
         extra = 1           // the projection also counts the current bar, as the original does
      ENDIF
      opOk = 1
      IF isPush = 1 AND volOk[ofs] = 0 THEN
         opOk = 0            // no volume on that bar: nothing to store
      ENDIF
      slot = -1
      IF opOk = 1 THEN
         // look the period up in the table (open addressing)
         hIdx = opKey - floor(opKey / hashSize) * hashSize
         probe = 0
         WHILE slot = -1 AND hashSize > probe DO
            IF isset($hk[hIdx]) THEN
               IF $hk[hIdx] = opKey THEN
                  slot = $hs[hIdx]
               ELSE
                  hIdx = hIdx + 1
                  IF hIdx >= hashSize THEN
                     hIdx = 0
                  ENDIF
                  probe = probe + 1
               ENDIF
            ELSIF isPush = 1 THEN
               slot = $gst[1]
               $hk[hIdx] = opKey
               $hs[hIdx] = slot
               $cnt[slot] = 0
               $head[slot] = 0
               $gst[1] = slot + 1
            ELSE
               slot = -2      // period never seen
            ENDIF
         WEND
      ENDIF
      IF isPush = 1 THEN
         IF slot >= 0 THEN
            base = slot * length
            IF length > $cnt[slot] THEN
               $buf[base + $cnt[slot]] = volS[ofs]
               $cnt[slot] = $cnt[slot] + 1
            ELSE
               $buf[base + $head[slot]] = volS[ofs]
               hNew = $head[slot] + 1
               IF hNew >= length THEN
                  hNew = 0
               ENDIF
               $head[slot] = hNew
            ENDIF
         ENDIF
         $gst[0] = barindex - ofs
      ELSE
         // summary of the period (plus the current bar when extra = 1)
         valOk = 0
         val = 0
         IF slot >= 0 THEN
            n0 = $cnt[slot]
            base = slot * length
            skipE = -1
            IF extra = 1 AND n0 >= length THEN
               skipE = $head[slot]      // the oldest value leaves when the current bar enters
            ENDIF
            nn = 0
            FOR e = 0 TO n0 - 1 DO
               IF NOT (e = skipE) THEN
                  $w[nn] = $buf[base + e]
                  nn = nn + 1
               ENDIF
            NEXT
            IF extra = 1 THEN
               $w[nn] = volS
               nn = nn + 1
            ENDIF
            valOk = 1
         ELSIF extra = 1 THEN
            $w[0] = volS
            nn = 1
            valOk = 1
         ENDIF
         IF valOk = 1 THEN
            IF summaryMethod = 0 THEN
               sm = 0
               FOR e = 0 TO nn - 1 DO
                  sm = sm + $w[e]
               NEXT
               val = sm / nn
            ELSE
               // insertion sort, then linear interpolation between the two closest ranks
               IF nn >= 2 THEN
                  FOR e = 1 TO nn - 1 DO
                     wv = $w[e]
                     e2 = e - 1
                     WHILE e2 >= 0 AND $w[max(e2, 0)] > wv DO
                        $w[e2 + 1] = $w[e2]
                        e2 = e2 - 1
                     WEND
                     $w[e2 + 1] = wv
                  NEXT
               ENDIF
               pPos = pctValue / 100 * (nn - 1)
               pLo = floor(pPos)
               pFr = pPos - pLo
               IF nn - 1 >= pLo + 1 THEN
                  val = $w[pLo] + pFr * ($w[pLo + 1] - $w[pLo])
               ELSE
                  val = $w[pLo]
               ENDIF
            ENDIF
         ENDIF
         IF qJob = 0 THEN
            summary = val
            sumOk = valOk
            $fcV[0] = val
            $fcOk[0] = valOk
         ELSE
            $fcV[qJob] = val
            $fcOk[qJob] = valOk
         ENDIF
      ENDIF
   NEXT
   //----------------------------------------------------------------//
   // Forecast line
   //----------------------------------------------------------------//
   IF nJobs >= 1 THEN
      FOR q = 1 TO nJobs DO
         IF $fcOk[q - 1] = 1 AND $fcOk[q] = 1 THEN
            IF fcStyle = 0 THEN
               DRAWSEGMENT(barindex + q - 1, $fcV[q - 1], barindex + q, $fcV[q]) COLOURED(fcR, fcG, fcB, 255) STYLE(line, 1)
            ELSIF fcStyle = 1 THEN
               DRAWSEGMENT(barindex + q - 1, $fcV[q - 1], barindex + q, $fcV[q]) COLOURED(fcR, fcG, fcB, 255) STYLE(dottedline2, 1)
            ELSE
               DRAWSEGMENT(barindex + q - 1, $fcV[q - 1], barindex + q, $fcV[q]) COLOURED(fcR, fcG, fcB, 255) STYLE(dottedline, 1)
            ENDIF
         ENDIF
      NEXT
   ENDIF
ENDIF
//--------------------------------------------------------------------//
// Plots: hidden with alpha 0 where there is nothing to show
//--------------------------------------------------------------------//
volP = 0
volA = 0
IF volOk = 1 THEN
   volP = volS
   volA = 255
ENDIF
sumP = volP
sumA = 0
diffV = 0
diffA = 0
dR = 242
dG = 54
dB = 69
IF sumOk = 1 AND volOk = 1 THEN
   sumP = summary
   sumA = 255
   diffV = volS - summary
   diffA = 128
   IF volS > summary THEN
      dR = 8
      dG = 153
      dB = 129
   ENDIF
ENDIF
RETURN volP COLOURED(120, 123, 134, volA) AS "Volume", sumP COLOURED(255, 152, 0, sumA) STYLE(dottedline, 1) AS "Expected Volume", diffV COLOURED(dR, dG, dB, diffA) STYLE(histogram) AS "Difference"